IPA Advanced Training Course
|
|
|
- Kerry Harrell
- 6 years ago
- Views:
Transcription
 Supervisor and IPA certified")
1 IPA Advanced Training Course Academia Sinica 2015 Oct Gene( 陳冠文 ) Supervisor and IPA certified analyst 1

2 Review for Introductory Training course Searching Building a Pathway Editing a Pathway for Publication 2


3 Searching Searching Basics Gene/chemical search and results Function/Disease search and results Drug target search and results Advanced search: Limiting results to a molecule type, family or subcellular location 3

4 Using the Build Tools Grow, Path Explorer, and Connect can be used to add molecules and relationships to a pathway. Trim, Keep and Highlight can be used to remove or highlight objects that already appear in a pathway. Build Tools: Grow: Adds new molecules and their relationships given the criteria that the user specifies Path Explorer: Calculates the Shortest Path between 2 molecules or 2 sets of molecules Connect: Connects molecules given the criteria that the user specifies Trim: Removes molecules/relationships that meet the criteria that the user specifies Keep: Keeps molecules/relationships that meet the criteria that the user specifies Add Molecule/Relationship: Allows adding a custom molecules or relationship to the current pathway that does not exist in Ingenuity s KB as well as ones that already exist 4

5 Grow Upstream from AKT1 to kinases and phosphatases Build and Grow Networks of Molecules 5
6 Agenda A. Data Upload and How to Run a Core Analysis B. Functional Interpretation in IPA Hands-on Exercises C. Comparison Analyses D. Using IPA to Explore microrna Impacts on Molecular Mechanisms of Disease E. Q&A 6
7 Agenda A. Data Upload and How to Run a Core Analysis B. Functional Interpretation in IPA Hands-on Exercises C. Comparison Analyses D. Using IPA to Explore microrna Impacts on Molecular Mechanisms of Disease E. Q&A 7
8 Introduction to Data Upload and Analysis Why do we Run an Analysis? Ingenuity s Analyses return The relevant functions associated with the uploaded data Affected signaling and metabolic pathways associated with the uploaded data Networks of interactions among the uploaded molecules as well as related molecules What types of Analyses does IPA have? Core Analysis Tox Analysis Metabolomics Analysis All IPA Analyses return the same information and algorithms. The data is presented in a different order! 8


9 Workflow for Dataset Analysis IPA Genomic, exon, mirna, SNP, protein arrays; Any molecule lists; Other proteomic & metabolomic assays Identify functions, diseases, and canonical pathways associated with your data 9
10 IPA Data Analysis Workflow Upload Data Run Core Analysis Pathways (overlay) Functional Effects IPA Transcription Regulators Research Genes of Interest Save Export Experiment approval IPA User platform General Analysis Workflow in IPA 10
11 Key Terminology Observation: An experimental condition such as a time point, disease subtype, or compound concentration Expression Value: Numerical value indicating level of expression, significance, or other assay result for a specific identifier (gene, RNA, protein, or chemical) Reference Set: The set of molecules used as the universe of molecules when calculating the statistical relevance of biological functions and pathways with respect to a dataset file. The set of molecules are the user's dataset or molecules in Ingenuity's Knowledge Base (genes, endogenous chemicals, or both). Focus Molecule: Molecules that are from uploaded list, pass filters are applied, and are available for generating networks 11


12 Setting Up a Dataset ID Replicates Average Other observations (Comparison) 12
13 Best Practices for Dataset Analysis Calculate averages and p-values for replicate samples outside of IPA Create an Excel spreadsheet One column must have identifiers Up to 20 observations Up to 3 expression value types per observation Only 1 header row Set a cutoff value for each expression value type used For large datasets, use a p-value and another expression value type. Check the number of Molecules Eligible for Network generation Cutoffs depend on the confidence in values, but many use fold change 1.5 and -1.5 and a p-value 0.01 Use the Recalculate button to refresh the screen 13

14 分析用的 Dataset 的範例格式 Chronic obstructive pulmonary disease Observation 1 : Smokers vs. NonSmokers Observation 2 : Early COPD vs. NonSmokers Observation 3 : COPD vs. NonSmokers 14
15 Live Demo 16
16 Agenda A. Data Upload and How to Run a Core Analysis B. Functional Interpretation in IPA Hands-on Exercises C. Comparison Analyses D. Using IPA to Explore microrna Impacts on Molecular Mechanisms of Disease E. Q&A 21
17 Functional analysis Functions analysis: identify what biological processes, diseases, or toxicological functions are affected in the experiment. Canonical Pathways : list the canonical pathways that your in your experimental dataset may be involved in. Upstream Analysis: identify the upstream regulators that may be responsible for gene expression changes observed in your experimental dataset. Networks : Networks are collections of interconnected molecules assembled by a network algorithm. 22
18 Network types in IPA Upstream Analysis Mechanistic Network of Upstream Regulators Upstream Regulator Dataset Molecules Other upstream regulators Dataset Molecules Function Analysis Dataset Molecules Regulator Effect Network Any Interaction Network Diseases / functions Diseases / functions Dataset Molecules
19 Functional analysis Functions analysis: identify what biological processes, diseases, or toxicological functions are affected in the experiment. Canonical Pathways : list the canonical pathways that your in your experimental dataset may be involved in. Upstream Analysis: identify the upstream regulators that may be responsible for gene expression changes observed in your experimental dataset. Networks : Networks are collections of interconnected molecules assembled by a network algorithm. 24

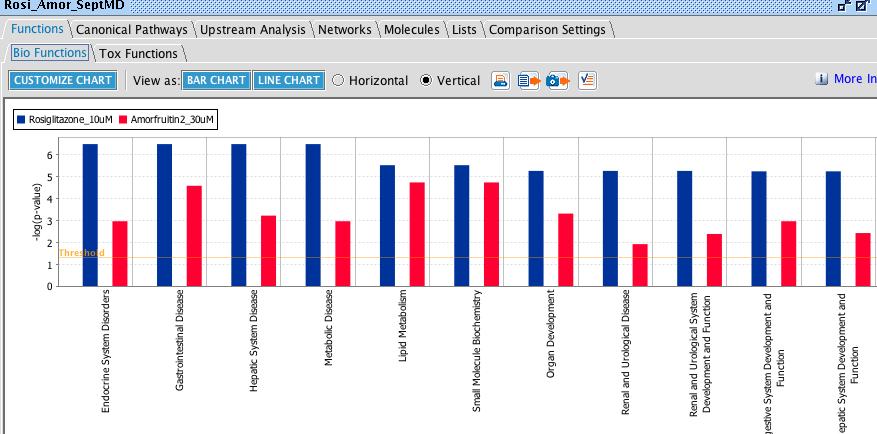
20 Interpret Downstream Biological Functions Identify over-represented biological functions and predict how those functions are increased or decreased in the experiment 25


21 Downstream Effect on Biological Function Size of the Square Color by and Scale Toggle to the Bar Chart Click on a Square to Drill Down within that function 26


22 Downstream Effect on Biological Function Ontology Levels Click to See the Specific Genes and Findings 27

23 Disease and Molecules relationships Powerful functionality enables you to understand causal connections between molecules and diseases. Interactive visual exploration of causality between molecules and disease, function, or phenotypes from a network or My Pathway Visualize the impact of genes on diseases or biological functions in Downstream Effects Analysis. 28

24 Disease or Function View provides details associated with the disease or biological function such as molecules associated with that disease or function, known drug targets, drugs known to target those molecules, and more. 29
25 Functional analysis Functions analysis: identify what biological processes, diseases, or toxicological functions are affected in the experiment. Canonical Pathways : list the canonical pathways that your in your experimental dataset may be involved in. Upstream Analysis: identify the upstream regulators that may be responsible for gene expression changes observed in your experimental dataset. Networks : Networks are collections of interconnected molecules assembled by a network algorithm. 30


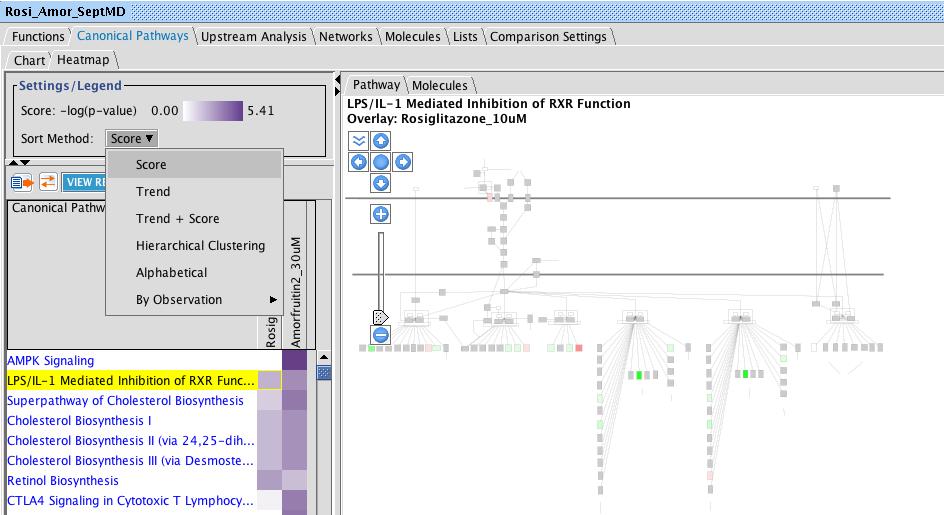
26 Canonical Pathways Understanding the biology of your data in an established signaling and metabolic context 32


27 How to use the Molecule Activity Predictor (MAP) Turn on or off the prediction Set whether predictions should flow downstream upstream, or both Use your dataset or analysis to set the activation state of the molecules 33
28 Functional analysis Functions analysis: identify what biological processes, diseases, or toxicological functions are affected in the experiment. Canonical Pathways : list the canonical pathways that your in your experimental dataset may be involved in. Upstream Analysis: identify the upstream regulators that may be responsible for gene expression changes observed in your experimental dataset. Networks : Networks are collections of interconnected molecules assembled by a network algorithm. 34


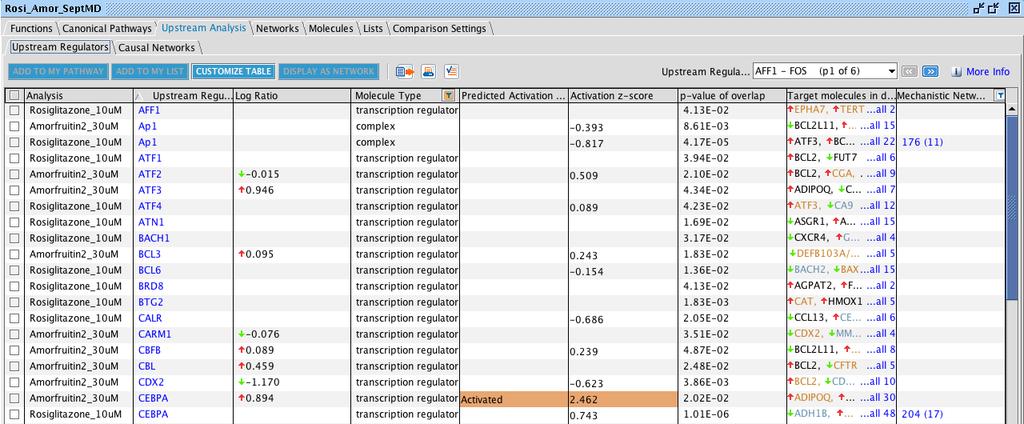
29 Upstream Regulator Analysis: How does it work? Use experimentally observed relationships (vs. Predicted event) between Upstream Regulators and genes to predict potential regulator and activation Predict activation or inhibition of regulator to explain the changes in gene expression in your dataset Calculates two complementary statistical measures: Activation z-score Overlap p-value 35

30 Mechanistic Network Algorithm Algorithm seeks large overlaps between an upstream regulator s targets and a more downstream regulator s targets Upstream molecule likely to operate thru this more downstream regulator A Upstream molecule less likely to operate thru this more downstream regulator A B B Shares 6 of 7 of the more downstream regulator s targets Shares 1 of 7 of the more downstream regulator s targets 41


31 Concept of Regulator Effects - Spring 2014 Hypotheses for how activated or inhibited upstream regulators cause downstream effects on biology Upstream Regulators A Simplest Regulator Effects result A Molecules in the dataset Disease or Function Algorithm First iteration Disease or Function Displays a relationship between the regulator and disease/function if it exists Downstream Effects Analysis Causally consistent networks score higher The algorithm runs iteratively to merge additional regulators with diseases and functions 42

32 Functional analysis Functions analysis: identify what biological processes, diseases, or toxicological functions are affected in the experiment. Canonical Pathways : list the canonical pathways that your in your experimental dataset may be involved in. Upstream Analysis: identify the upstream regulators that may be responsible for gene expression changes observed in your experimental dataset. Networks : Networks are collections of interconnected molecules assembled by a network algorithm. 43
33 Networks in IPA Purpose: To show as many interactions between user-specified molecules in a given dataset and how they might work together at the molecular level Why are Ingenuity networks biologically interesting? Highly-interconnected networks are likely to represent significant biological function Networks involve molecules you don t see in your data set. This allows genes you have assayed to be linked to metabolites and chemicals that you couldn t have assayed for, to imply a regulation network that is meaningful. 44
34 How Networks Are Generated 1. Focus molecules are seeds 2. Focus molecules with the most interactions to other focus molecules are then connected together to form a network 3. Non-focus molecules from the dataset are then added 4. Molecules from the Ingenuity s Knowledge Base are added 5. Resulting Networks are scored and then sorted based on the score 45
35 Live Demo 47
36 Hands-on Exercises I 1. Upload a dataset into IPA. You may use your own or we can provide you with an example. 2. What is the top function associated with your dataset? 3. How can you find out what main functions a Canonical Pathway (or group of Canonical Pathways) is involved in? 4. What are the functions of the top network in this analysis?
37 Agenda A. Data Upload and How to Run a Core Analysis B. Functional Interpretation in IPA Hands-on Exercises C. Comparison Analyses D. Using IPA to Explore microrna Impacts on Molecular Mechanisms of Disease E. Q&A 49
38 Bringing together multiple types of genomic data Research AIM: To attain a systems biology understanding of your research by bringing multiple types of genomic data together (SNP, CNA, mrna, microrna, proteomics, etc.). Challenge: Data types measured different molecular status in experiment Too much data, some data types may have extra noise (i.e. arrays) Venn Diagram-type comparison excludes A affects B information Solution: Identify phenotypes, disease associations, and pathways that are common themes for multiple data types using Comparison Analysis Interactive pathways overlay multiple data types and find genes up or down-stream that change in the various data types. Pathway tools find regulatory connections between molecules of interest and the various data types microrna Target Filter can link micrornas and targets from mirna and target data sets How do you integrate multiple data types now? 50
39 Single Experiment Time Course Dose Response Multi Experiment System biology Combining SNP, CNA, mrna, microrna, proteomics, etc. Set Analysis Exploring Common Molecules across one or more experiment (s) 51
40 Core Comparison Analysis 52
41 Single Experiment Time Course Dose Response Multi Experiment System biology Combining SNP, CNA, mrna, microrna, proteomics, etc Set Analysis Exploring Common Molecules across one or more experiment (s) 53


42 IPA: A Point of Data Integration Mutations CNA /CNV mrna Expression Methylation ChIP-Seq mirna Expression IPA Biological Interpretation Phosphorylation Protein Expression 54
43 IPA: A Point of Data Integration Mutations CNA /CNV mrna Expression Methylation ChIP-Seq mirna Expression IPA Biological Interpretation Phosphorylation Protein Expression 55
44 Example of Core Analysis with 3-Data Types File Name Mutations CNAs mrnas GBM paper mutation data GBM paper CNA GBM vs Norm Expression ID Gene Symbol Gene Symbol Gene Symbol Observation 1 frequency of nonsilent mutation across samples Pct. Sample/Other frequency of CNA across samples [Pct/Other], increase or decrease in copy number [Amp/Other], and [qvalue/p-value] Log2 ratio change, p-value Core Analysis Frequency of mutation 2% p-value < 0.05 Log ratio 1.5 Keep in mind To set the same Reference Set across the 3 core analyses To check the Expression value type used for coloring the nodes


45 What do you want out of this comparison? Review your workflow What are your goals? mrna data Core Analysis CNA data Core Analysis Comparison Analysis? mutation data Core Analysis Pathways? Export? References? Lists? 57
; re-order or review whole table for Functions significant for other data types 2.")
46 Comparison of Functions for 3 data sets: 1. Sorted by 1 st data type (mrna); re-order or review whole table for Functions significant for other data types 2. Look for Functions common to mrna, CNA, mutations from glioblastoma 3. Table may be customized or exported 58
47 Single Experiment Time Course Dose Response Multi Experiment System biology Combining SNP, CNA, mrna, microrna, proteomics, etc Set Analysis Exploring Common Molecules across one or more experiment (s) 59
48 Genes Overlap Gene Exp CNA Mutated 60

49 Compare Tool 61
50 Live Demo 64
51 Agenda A. Data Upload and How to Run a Core Analysis B. Functional Interpretation in IPA Hands-on Exercises C. Comparison Analyses D. Using IPA to Explore microrna Impacts on Molecular Mechanisms of Disease E. Q&A 65

 mrna?")


52 Filter Datasets for Biomarkers or mirna Targets mirna Data mirna Target Filter Molecule Type Pathways (Cancer/ Growth) mrna? 88 data points 13,690 targets 1,090 targets 333 targets 39 targets 32 targets Use Pathway tools to build hypothesis for microrna to mrna target association
53 Live Demo 69
54 Hands-on Exercises II Overall Exercises: Use the COPD analytical results in exercises I. 1. What is the observed effect on the Xenobiotic Metabolism Signaling Canonical Pathway in the Early COPD group? \ 2. In the COPD group, focus on the function Cellular Movement. Select these genes and add them to a new My Pathway in your IPA account. How many of the proteins in this pathway are enzymes? 3. In Early COPD vs NonSmokers observation Upstream Regulators chapter, filter the Molecule Type to only Transcription Factors, which molecule is predicted to be Inhibited with the lowest z-score?
55 Hands-on Exercises II cont. Overall Exercises: 5. In studies of nicotine metabolism in smokers, it has been estimated that 70% of a nicotine dose is metabolized to cotinine. Which group express the highest effect on the Nicotine Degradation pathway? 6. In observation Upstream Regulators chapter. Which molecule is predicted to be activated in Both of early and late COPD groups?
56 Q&A 97

57 歡迎與我們聯絡 Office: #3014 Fax: EXT 1022 My MSC Support:
Training Account. Account: ~ Password: ingenuity123. Sample & Assay Technologies
 Training Account Account: asininca21@ingenuity.com ~ asinica40@ingenuity.com Password: ingenuity123 1 IPA Introductory Training Course Academia Sinica 2014 September Chris (Yu-Lun Kuo) 2 About me Chris
IPA : Maximizing the Biological Interpretation of Gene, Transcript & Protein Expression Data with IPA
 IPA : Maximizing the Biological Interpretation of Gene, Transcript & Protein Expression Data with IPA Marisa Chen Account Manager Qiagen Advanced Genomics Marisa.Chen@qiagen.com (203) 500-1237 Dev Mistry,
Research Powered by Agilent s GeneSpring
 Research Powered by Agilent s GeneSpring Agilent Technologies, Inc. Carolina Livi, Bioinformatics Segment Manager Research Powered by GeneSpring Topics GeneSpring (GS) platform New features in GS 13 What
Ingenuity Pathway Analysis (IPA )
") Ingenuity Pathway Analysis (IPA ) For the analysis and interpretation of omics data IPA is a web-based software application for the analysis, integration, and interpretation of data derived from omics
Ingenuity Pathway Analysis (IPA ) For the analysis and interpretation of omics data IPA is a web-based software application for the analysis, integration, and interpretation of data derived from omics
March Product Release Information. About IPA. IPA Spring Release (2016): Release Notes. Table of Contents
: Release Notes. Table of Contents") IPA Spring Release (2016): Release Notes Table of Contents IPA Spring Release (2016): Release Notes... 1 Product Release Information... 1 About IPA... 1 What s New in the IPA Spring Release (March 2016)...
IPA Spring Release (2016): Release Notes Table of Contents IPA Spring Release (2016): Release Notes... 1 Product Release Information... 1 About IPA... 1 What s New in the IPA Spring Release (March 2016)...
Microarray Data Analysis in GeneSpring GX 11. Month ##, 200X
 Microarray Data Analysis in GeneSpring GX 11 Month ##, 200X Agenda Genome Browser GO GSEA Pathway Analysis Network building Find significant pathways Extract relations via NLP Data Visualization Options
From Variants to Pathways: Agilent GeneSpring GX s Variant Analysis Workflow
 From Variants to Pathways: Agilent GeneSpring GX s Variant Analysis Workflow Technical Overview Import VCF Introduction Next-generation sequencing (NGS) studies have created unanticipated challenges with
AGILENT S BIOINFORMATICS ANALYSIS SOFTWARE
 ACCELERATING PROGRESS IS IN OUR GENES AGILENT S BIOINFORMATICS ANALYSIS SOFTWARE GENESPRING GENE EXPRESSION (GX) MASS PROFILER PROFESSIONAL (MPP) PATHWAY ARCHITECT (PA) See Deeper. Reach Further. BIOINFORMATICS
Course on Functional Analysis
 Course on Functional Analysis ::: An Introduction to Ingenuity Pathway Analysis. Madrid, June 31st, 2007. Gonzalo Gómez, PhD. ggomez@cnio.es Bioinformatics Unit Structural Biology and Biocomputing program
Data Analysis & Interpretation
 Applications Target Identification and Validation Biomarker Discovery Drug Mechanism of Action Drug Mechanism of Toxicity Disease Mechanisms Experimental approaches supported RNA-Seq microarray microrna
Agilent GeneSpring GX 10: Beyond. Pam Tangvoranuntakul Product Manager, GeneSpring October 1, 2008
 Agilent GeneSpring GX 10: Gene Expression and Beyond Pam Tangvoranuntakul Product Manager, GeneSpring October 1, 2008 GeneSpring GX 10 in the News Our Goals for GeneSpring GX 10 Goal 1: Bring back GeneSpring
The first thing you will see is the opening page. SeqMonk scans your copy and make sure everything is in order, indicated by the green check marks.
 Open Seqmonk Launch SeqMonk The first thing you will see is the opening page. SeqMonk scans your copy and make sure everything is in order, indicated by the green check marks. SeqMonk Analysis Page 1 Create
Object Groups. SRI International Bioinformatics
 Object Groups 1 SRI International Bioinformatics Object Groups Collect and save lists of genes, metabolites, pathways Transform, filter, and analyze them Share groups with colleagues Use groups in conjunction
Next-Generation Sequencing Gene Expression Analysis Using Agilent GeneSpring GX
 Next-Generation Sequencing Gene Expression Analysis Using Agilent GeneSpring GX Technical Overview Introduction RNA Sequencing (RNA-Seq) is one of the most commonly used next-generation sequencing (NGS)
Knowledge-Guided Analysis with KnowEnG Lab
 Han Sinha Song Weinshilboum Knowledge-Guided Analysis with KnowEnG Lab KnowEnG Center Powerpoint by Charles Blatti Knowledge-Guided Analysis KnowEnG Center 2017 1 Exercise In this exercise we will be doing
Bioinformatics Analysis of Nano-based Omics Data
 Bioinformatics Analysis of Nano-based Omics Data Penny Nymark, Pekka Kohonen, Vesa Hongisto and Roland Grafström Hands-on Workshop on Nano Safety Assessment, 29 th September, 2016, National Technical University
Smart India Hackathon
 TM Persistent and Hackathons Smart India Hackathon 2017 i4c www.i4c.co.in Digital Transformation 25% of India between age of 16-25 Our country needs audacious digital transformation to reach its potential
April transmart v1.2 Case Study for PredicTox
 April 2015 transmart v1.2 Case Study for PredicTox Agenda Agenda! What is PredicTox?! Brief transmart overview! Answering scientific questions with transmart s help: A case study maximizing data value!
Whole Transcriptome Analysis of Illumina RNA- Seq Data. Ryan Peters Field Application Specialist
 Whole Transcriptome Analysis of Illumina RNA- Seq Data Ryan Peters Field Application Specialist Partek GS in your NGS Pipeline Your Start-to-Finish Solution for Analysis of Next Generation Sequencing Data
PeCan Data Portal. rnal/v48/n1/full/ng.3466.html
 PeCan Data Portal https://pecan.stjude.org/ http://www.nature.com/ng/jou rnal/v48/n1/full/ng.3466.html Home Page Pie chart of samples representing cancer types in Data Portal cohorts Top genes for diagnosis
Identifying Signaling Pathways. BMI/CS 776 Spring 2016 Anthony Gitter
 Identifying Signaling Pathways BMI/CS 776 www.biostat.wisc.edu/bmi776/ Spring 2016 Anthony Gitter gitter@biostat.wisc.edu Goals for lecture Challenges of integrating high-throughput assays Connecting relevant
Analysis of Microarray Data
 Analysis of Microarray Data Lecture 3: Visualization and Functional Analysis George Bell, Ph.D. Senior Bioinformatics Scientist Bioinformatics and Research Computing Whitehead Institute Outline Review
Progress and Future Directions in Integrated Systems Toxicology. Mary McBride Agilent Technologies
 Progress and Future Directions in Integrated Systems Toxicology Mary McBride Agilent Technologies 1 Toxicity testing tools of the late 20 th century Patchwork approach to testing dates back to the 1930
Final exam: Introduction to Bioinformatics and Genomics DUE: Friday June 29 th at 4:00 pm
 Final exam: Introduction to Bioinformatics and Genomics DUE: Friday June 29 th at 4:00 pm Exam description: The purpose of this exam is for you to demonstrate your ability to use the different biomolecular
Course Agenda. Day One
 Course Agenda BioImmersion: Biotech for the Non-Scientist A three-day, in-depth course that provides the background required for understanding today s fast-paced biotech marketplace. Beginning with an
KnetMiner USER TUTORIAL
 KnetMiner USER TUTORIAL Keywan Hassani-Pak ROTHAMSTED RESEARCH 10 NOVEMBER 2017 About KnetMiner KnetMiner, with a silent "K" and standing for Knowledge Network Miner, is a suite of open-source software
Agilent Solutions for Metabolomics YOUR PATH TO SUCCESS
 Agilent Solutions for Metabolomics YOUR PATH TO SUCCESS UNDERSTANDING METABOLOMICS Agilent is the leading global metabolomics vendor, offering our customers a broad array of cutting-edge instrumentation
Capabilities & Services
 Capabilities & Services Accelerating Research & Development Table of Contents Introduction to DHMRI 3 Services and Capabilites: Genomics 4 Proteomics & Protein Characterization 5 Metabolomics 6 In Vitro
Our website:
 Biomedical Informatics Summer Internship Program (BMI SIP) The Department of Biomedical Informatics hosts an annual internship program each summer which provides high school, undergraduate, and graduate
MetaMiner Cystic Fibrosis Report
 White Paper MetaMiner Cystic Fibrosis Report Prepared by Yuri Nikolsky CONTENT n Overview n Annotated content Genes and proteins CF drugs & active compounds CF Pathway maps CF relevant networks n Tools
Introduction to Genome Biology
 Introduction to Genome Biology Sandrine Dudoit, Wolfgang Huber, Robert Gentleman Bioconductor Short Course 2006 Copyright 2006, all rights reserved Outline Cells, chromosomes, and cell division DNA structure
Measuring and Understanding Gene Expression
 Measuring and Understanding Gene Expression Dr. Lars Eijssen Dept. Of Bioinformatics BiGCaT Sciences programme 2014 Why are genes interesting? TRANSCRIPTION Genome Genomics Transcriptome Transcriptomics
Supplemental Figure 1.
 Supplemental Data. Charron et al. Dynamic landscapes of four histone modifications during de-etiolation in Arabidopsis. Plant Cell (2009). 10.1105/tpc.109.066845 Supplemental Figure 1. Immunodetection
Analysis of Microarray Data
 Analysis of Microarray Data Lecture 3: Visualization and Functional Analysis George Bell, Ph.D. Bioinformatics Scientist Bioinformatics and Research Computing Whitehead Institute Outline Review Visualizing
Briefly, this exercise can be summarised by the follow flowchart:
 Workshop exercise Data integration and analysis In this exercise, we would like to work out which GWAS (genome-wide association study) SNP associated with schizophrenia is most likely to be functional.
RNA-Seq Analysis. August Strand Genomics, Inc All rights reserved.
 RNA-Seq Analysis August 2014 Strand Genomics, Inc. 2014. All rights reserved. Contents Introduction... 3 Sample import... 3 Quantification... 4 Novel exon... 5 Differential expression... 12 Differential
Gene Network Central (GNC) Pro Tutorial
 Pro Tutorial") Gene Network Central (GNC) Pro Tutorial.Enhancing Biological Research with Gene Networks Topics to be Discussed What is GNC Pro and what can it do for me? Gene Network Versus Canonical Pathway Entering
Gene Network Central (GNC) Pro Tutorial.Enhancing Biological Research with Gene Networks Topics to be Discussed What is GNC Pro and what can it do for me? Gene Network Versus Canonical Pathway Entering
Upstream/Downstream Relation Detection of Signaling Molecules using Microarray Data
 Vol 1 no 1 2005 Pages 1 5 Upstream/Downstream Relation Detection of Signaling Molecules using Microarray Data Ozgun Babur 1 1 Center for Bioinformatics, Computer Engineering Department, Bilkent University,
Pathway Analysis. Min Kim Bioinformatics Core Facility 2/28/2018
 Pathway Analysis Min Kim Bioinformatics Core Facility 2/28/2018 Outline 1. Background 2. Databases: KEGG, Reactome, Biocarta, Gene Ontology, MSigDB, MetaCyc, SMPDB, IPA. 3. Statistical Methods: Overlap
Gene Signature Lab: Exploring integrative LINCS (ilincs) Data and Signatures Analysis Portal & Other LINCS Resources
 Data and Signatures Analysis Portal & Other LINCS Resources") Gene Signature Lab: Exploring integrative LINCS (ilincs) Data and Signatures Analysis Portal & Other LINCS Resources Jarek Meller, PhD BD2K-LINCS Data Coordination and Integration Center University of
Gene Signature Lab: Exploring integrative LINCS (ilincs) Data and Signatures Analysis Portal & Other LINCS Resources Jarek Meller, PhD BD2K-LINCS Data Coordination and Integration Center University of
Frumkin, 2e Part 1: Methods and Paradigms. Chapter 6: Genetics and Environmental Health
 Frumkin, 2e Part 1: Methods and Paradigms Chapter 6: Genetics and Environmental Health Genetics Genetics, the study of individual genes, has expanded to include genomics, which is the study of all the
Microarray Gene Expression Analysis at CNIO
 Microarray Gene Expression Analysis at CNIO Orlando Domínguez Genomics Unit Biotechnology Program, CNIO 8 May 2013 Workflow, from samples to Gene Expression data Experimental design user/gu/ubio Samples
Finding Major Regulators/Cellular Processes/Diseases in Experimental Data
 Finding Major Regulators/Cellular Processes/Diseases in Experimental Data Sub-Network Enrichment Analysis (SNEA) is used to identify and prioritize the targets and regulators most implicated in the experimental
Thermo Scientific Compound Discoverer Software. Integrated solutions. for small molecule research
 Thermo Scientific Compound Discoverer Software Integrated solutions for small molecule research Compound Discoverer Software The complete small molecule identification and characterization solution Based
Editorial. Current Computational Models for Prediction of the Varied Interactions Related to Non-Coding RNAs
 Editorial Current Computational Models for Prediction of the Varied Interactions Related to Non-Coding RNAs Xing Chen 1,*, Huiming Peng 2, Zheng Yin 3 1 School of Information and Electrical Engineering,
SUPPLEMENTARY FIGURES AND TABLES
 SUPPLEMENTARY FIGURES AND TABLES Supplementary Figure S1: Plot shows the percentage of initially identified backsplice junctions against the Read depth value. Junctional circrna candidate have one mate
Gene expression connectivity mapping and its application to Cat-App
 Gene expression connectivity mapping and its application to Cat-App Shu-Dong Zhang Northern Ireland Centre for Stratified Medicine University of Ulster Outline TITLE OF THE PRESENTATION Gene expression
Transcriptome Assembly, Functional Annotation (and a few other related thoughts)
") Transcriptome Assembly, Functional Annotation (and a few other related thoughts) Monica Britton, Ph.D. Sr. Bioinformatics Analyst June 23, 2017 Differential Gene Expression Generalized Workflow File Types
Transcriptome Assembly, Functional Annotation (and a few other related thoughts) Monica Britton, Ph.D. Sr. Bioinformatics Analyst June 23, 2017 Differential Gene Expression Generalized Workflow File Types
From Genotype to Phenotype
 From Genotype to Phenotype Johanna Vilkki Green technology, Natural Resources Institute Finland Systems biology Genome Transcriptome genes mrna Genotyping methodology SNP TOOLS, WG SEQUENCING Functional
Gene-Level Analysis of Exon Array Data using Partek Genomics Suite 6.6
 Gene-Level Analysis of Exon Array Data using Partek Genomics Suite 6.6 Overview This tutorial will demonstrate how to: Summarize core exon-level data to produce gene-level data Perform exploratory analysis
Agilent Genomic Workbench 7.0
 Agilent Genomic Workbench 7.0 Product Overview Guide Agilent Technologies Notices Agilent Technologies, Inc. 2012, 2015 No part of this manual may be reproduced in any form or by any means (including electronic
GeneWEB Tutorial. Enhancing Biological Research with Gene Networks Bioinformatics Department
 GeneWEB Tutorial Enhancing Biological Research with Gene Networks Bioinformatics Department 1 Topics to be Discussed What is GeneWEB and what can it do for me? Gene Network Versus Canonical Pathway Entering
Microarray Analysis of Gene Expression in Huntington's Disease Peripheral Blood - a Platform Comparison. CodeLink compatible
 Microarray Analysis of Gene Expression in Huntington's Disease Peripheral Blood - a Platform Comparison CodeLink compatible Microarray Analysis of Gene Expression in Huntington's Disease Peripheral Blood
Genome-wide association study of aggressive behaviour in chicken
 Genome-wide association study of aggressive behaviour in chicken Zhenhui Li 1, 2, Ming Zheng 1, 2, Bahareldin Ali Abdalla 1, 2, Zhe Zhang 1, 2, Zhenqiang Xu 1, 2, 3, Qiao Ye 1, 2, Haiping Xu 1, 2, Wei
Computational Approaches to Analysis of DNA Microarray Data
 2006 IMI and Schattauer GmbH 91 Computational pproaches to nalysis of DN Microarray Data J. Quackenbush Department of Biostatistics and Computational Biology, Dana-Farber Cancer Institute and Department
Microarray Informatics
 Microarray Informatics Donald Dunbar MSc Seminar 4 th February 2009 Aims To give a biologistʼs view of microarray experiments To explain the technologies involved To describe typical microarray experiments
Week 1 BCHM 6280 Tutorial: Gene specific information using NCBI, Ensembl and genome viewers
 Week 1 BCHM 6280 Tutorial: Gene specific information using NCBI, Ensembl and genome viewers Web resources: NCBI database: http://www.ncbi.nlm.nih.gov/ Ensembl database: http://useast.ensembl.org/index.html
Pioneering Clinical Omics
 Pioneering Clinical Omics Clinical Genomics Strand NGS An analysis tool for data generated by cutting-edge Next Generation Sequencing(NGS) instruments. Strand NGS enables read alignment and analysis of
Introduction to human genomics and genome informatics
 Introduction to human genomics and genome informatics Session 1 Prince of Wales Clinical School Dr Jason Wong ARC Future Fellow Head, Bioinformatics & Integrative Genomics Adult Cancer Program, Lowy Cancer
Sanger vs Next-Gen Sequencing
 Tools and Algorithms in Bioinformatics GCBA815/MCGB815/BMI815, Fall 2017 Week-8: Next-Gen Sequencing RNA-seq Data Analysis Babu Guda, Ph.D. Professor, Genetics, Cell Biology & Anatomy Director, Bioinformatics
Identification of biological themes in microarray data from a mouse heart development time series using GeneSifter
 Identification of biological themes in microarray data from a mouse heart development time series using GeneSifter VizX Labs, LLC Seattle, WA 98119 Abstract Oligonucleotide microarrays were used to study
Introduction to BIOINFORMATICS
 COURSE OF BIOINFORMATICS a.a. 2016-2017 Introduction to BIOINFORMATICS What is Bioinformatics? (I) The sinergy between biology and informatics What is Bioinformatics? (II) From: http://www.bioteach.ubc.ca/bioinfo2010/
David Crossman, Ph.D. UAB Heflin Center for Genomic Science. Immersion Course
 David Crossman, Ph.D. UAB Heflin Center for Genomic Science Immersion Course What to do with your list of genes Apply a Systems Biology approach to data mine and analyze your data Tools and databases available
Development of quantitative targeted RNA-seq methodology for use in differential gene expression
 Development of quantitative targeted RNA-seq methodology for use in differential gene expression Dr. Jens Winter, Market Development Group Biological Biological Research Content EMEA QIAGEN Universal Workflows
Introduction to RNA-Seq. David Wood Winter School in Mathematics and Computational Biology July 1, 2013
 Introduction to RNA-Seq David Wood Winter School in Mathematics and Computational Biology July 1, 2013 Abundance RNA is... Diverse Dynamic Central DNA rrna Epigenetics trna RNA mrna Time Protein Abundance
Data Mining for Biological Data Analysis
 Data Mining for Biological Data Analysis Data Mining and Text Mining (UIC 583 @ Politecnico di Milano) References Data Mining Course by Gregory-Platesky Shapiro available at www.kdnuggets.com Jiawei Han
Agilent Solutions for Metabolomics EMERGING INSIGHTS
 Agilent Solutions for Metabolomics EMERGING INSIGHTS Understanding Metabolic Fingerprints A Powerful Way to Investigate Biology What is Metabolomics? Metabolomics is the study of the metabolite content
Basics of RNA-Seq. (With a Focus on Application to Single Cell RNA-Seq) Michael Kelly, PhD Team Lead, NCI Single Cell Analysis Facility
 Michael Kelly, PhD Team Lead, NCI Single Cell Analysis Facility") 2018 ABRF Meeting Satellite Workshop 4 Bridging the Gap: Isolation to Translation (Single Cell RNA-Seq) Sunday, April 22 Basics of RNA-Seq (With a Focus on Application to Single Cell RNA-Seq) Michael Kelly,
2018 ABRF Meeting Satellite Workshop 4 Bridging the Gap: Isolation to Translation (Single Cell RNA-Seq) Sunday, April 22 Basics of RNA-Seq (With a Focus on Application to Single Cell RNA-Seq) Michael Kelly,
all official ACS meetings and events without the express written consent from the ACS.
 248th American Chemical Society National Meeting & Exposition www.acs.org/sanfran2014 The use of any device to capture images (e.g., cameras and camera phones) or sound (e.g., tape and digital recorders)
The 150+ Tomato Genome (re-)sequence Project; Lessons Learned and Potential
sequence Project; Lessons Learned and Potential") The 150+ Tomato Genome (re-)sequence Project; Lessons Learned and Potential Applications Richard Finkers Researcher Plant Breeding, Wageningen UR Plant Breeding, P.O. Box 16, 6700 AA, Wageningen, The Netherlands,
The 150+ Tomato Genome (re-)sequence Project; Lessons Learned and Potential Applications Richard Finkers Researcher Plant Breeding, Wageningen UR Plant Breeding, P.O. Box 16, 6700 AA, Wageningen, The Netherlands,
Runs of Homozygosity Analysis Tutorial
 Runs of Homozygosity Analysis Tutorial Release 8.7.0 Golden Helix, Inc. March 22, 2017 Contents 1. Overview of the Project 2 2. Identify Runs of Homozygosity 6 Illustrative Example...............................................
About Strand NGS. Strand Genomics, Inc All rights reserved.
 About Strand NGS Strand NGS-formerly known as Avadis NGS, is an integrated platform that provides analysis, management and visualization tools for next-generation sequencing data. It supports extensive
ChIP-seq data analysis with Chipster. Eija Korpelainen CSC IT Center for Science, Finland
 ChIP-seq data analysis with Chipster Eija Korpelainen CSC IT Center for Science, Finland chipster@csc.fi What will I learn? Short introduction to ChIP-seq Analyzing ChIP-seq data Central concepts Analysis
The Major Function Of Rna Is To Carry Out The Genetic Instructions For Protein Synthesis
 The Major Function Of Rna Is To Carry Out The Genetic Instructions For Protein Synthesis For example, protein synthesis in human mitochondria relies on a genetic code that Leder and Nirenberg were able
The human gene encoding Glucose-6-phosphate dehydrogenase (G6PD) is located on chromosome X in cytogenetic band q28.
 is located on chromosome X in cytogenetic band q28.") Data mining in Ensembl with BioMart Worked Example The human gene encoding Glucose-6-phosphate dehydrogenase (G6PD) is located on chromosome X in cytogenetic band q28. Which other genes related to human
Data mining in Ensembl with BioMart Worked Example The human gene encoding Glucose-6-phosphate dehydrogenase (G6PD) is located on chromosome X in cytogenetic band q28. Which other genes related to human
FROM DISCOVERY TO INSIGHT
 Agilent Pathway Architect FROM DISCOVERY TO INSIGHT METABOLOMICS PROTEOMICS PATHWAY ARCHITECT GENOMICS TRANSCRIPTOMICS AGILENT PATHWAY ARCHITECT SPEED DISCOVERY TO UNDERSTANDING Today s scientists face
TARGET VALIDATION. Maaike Everts, PhD (with slides from Dr. Suto)
") TARGET VALIDATION Maaike Everts, PhD (with slides from Dr. Suto) Drug Discovery & Development Source: http://dlab.cl/molecular-design/drug-discovery-phases/ How do you identify a target? Target: the naturally
TARGET VALIDATION Maaike Everts, PhD (with slides from Dr. Suto) Drug Discovery & Development Source: http://dlab.cl/molecular-design/drug-discovery-phases/ How do you identify a target? Target: the naturally
sherwood - UltramiR shrna Collections
 sherwood - UltramiR shrna Collections Incorporating advances in shrna design and processing for superior potency and specificity sherwood - UltramiR shrna Collections Enabling Discovery Across the Genome
Agilent Genomics Software Future Directions
 Agilent Genomics Software Future Directions Michael Rosenberg, PhD Director, Genomics Software Agilent: A Focused Measurement Company Serving Diverse End Markets Electronic Measurement 2008 Revenue: $3.6
Analysis of a Tiling Regulation Study in Partek Genomics Suite 6.6
 Analysis of a Tiling Regulation Study in Partek Genomics Suite 6.6 The example data set used in this tutorial consists of 6 technical replicates from the same human cell line, 3 are SP1 treated, and 3
Introduction to Microarray Analysis
 Introduction to Microarray Analysis Methods Course: Gene Expression Data Analysis -Day One Rainer Spang Microarrays Highly parallel measurement devices for gene expression levels 1. How does the microarray
resequencing storage SNP ncrna metagenomics private trio de novo exome ncrna RNA DNA bioinformatics RNA-seq comparative genomics
 RNA Sequencing T TM variation genetics validation SNP ncrna metagenomics private trio de novo exome mendelian ChIP-seq RNA DNA bioinformatics custom target high-throughput resequencing storage ncrna comparative
Measuring gene expression (Microarrays) Ulf Leser
 Ulf Leser") Measuring gene expression (Microarrays) Ulf Leser This Lecture Gene expression Microarrays Idea Technologies Problems Quality control Normalization Analysis next week! 2 http://learn.genetics.utah.edu/content/molecules/transcribe/
Measuring gene expression (Microarrays) Ulf Leser This Lecture Gene expression Microarrays Idea Technologies Problems Quality control Normalization Analysis next week! 2 http://learn.genetics.utah.edu/content/molecules/transcribe/
New Features in JMP Genomics 4.1 WHITE PAPER
 WHITE PAPER Table of Contents Platform Updates...2 Expanded Operating Systems Support...2 New Import Features...3 Affymetrix Import and Analysis... 3 New Expression Features...5 New Pattern Discovery Features...8
Gene expression analysis: Introduction to microarrays
 Gene expression analysis: Introduction to microarrays Adam Ameur The Linnaeus Centre for Bioinformatics, Uppsala University February 15, 2006 Overview Introduction Part I: How a microarray experiment is
Network System Inference
 Network System Inference Francis J. Doyle III University of California, Santa Barbara Douglas Lauffenburger Massachusetts Institute of Technology WTEC Systems Biology Final Workshop March 11, 2005 What
CodeLink Human Whole Genome Bioarray
 CodeLink Human Whole Genome Bioarray 55,000 human gene targets on a single bioarray The CodeLink Human Whole Genome Bioarray comprises one of the most comprehensive coverages of the human genome, as it
Satellite Education Workshop (SW4): Epigenomics: Design, Implementation and Analysis for RNA-seq and Methyl-seq Experiments
: Epigenomics: Design, Implementation and Analysis for RNA-seq and Methyl-seq Experiments") Satellite Education Workshop (SW4): Epigenomics: Design, Implementation and Analysis for RNA-seq and Methyl-seq Experiments Saturday March 17, 2012 Orlando, Florida Workshop Description: This full day
Satellite Education Workshop (SW4): Epigenomics: Design, Implementation and Analysis for RNA-seq and Methyl-seq Experiments Saturday March 17, 2012 Orlando, Florida Workshop Description: This full day
Non-Organic-Based Isolation of Mammalian microrna using Norgen s microrna Purification Kit
 Application Note 13 RNA Sample Preparation Non-Organic-Based Isolation of Mammalian microrna using Norgen s microrna Purification Kit B. Lam, PhD 1, P. Roberts, MSc 1 Y. Haj-Ahmad, M.Sc., Ph.D 1,2 1 Norgen
11/22/13. Proteomics, functional genomics, and systems biology. Biosciences 741: Genomics Fall, 2013 Week 11
 Proteomics, functional genomics, and systems biology Biosciences 741: Genomics Fall, 2013 Week 11 1 Figure 6.1 The future of genomics Functional Genomics The field of functional genomics represents the
Microarray Informatics
 Microarray Informatics Donald Dunbar MSc Seminar 31 st January 2007 Aims To give a biologist s view of microarray experiments To explain the technologies involved To describe typical microarray experiments
Chapter 18: Regulation of Gene Expression. 1. Gene Regulation in Bacteria 2. Gene Regulation in Eukaryotes 3. Gene Regulation & Cancer
 Chapter 18: Regulation of Gene Expression 1. Gene Regulation in Bacteria 2. Gene Regulation in Eukaryotes 3. Gene Regulation & Cancer Gene Regulation Gene regulation refers to all aspects of controlling
Microbial Metabolism Systems Microbiology
 1 Microbial Metabolism Systems Microbiology Ching-Tsan Huang ( 黃慶璨 ) Office: Agronomy Hall, Room 111 Tel: (02) 33664454 E-mail: cthuang@ntu.edu.tw MIT OCW Systems Microbiology aims to integrate basic biological
Introduction to Bioinformatics and Gene Expression Technology
 Vocabulary Introduction to Bioinformatics and Gene Expression Technology Utah State University Spring 2014 STAT 5570: Statistical Bioinformatics Notes 1.1 Gene: Genetics: Genome: Genomics: hereditary DNA
TEDDY Omics Data Availability
 Dietary Biomarkers Ascorbic Acid Result file Available, Final December 2015 1) Samples that did not pass the lab s QC were excluded from the 2) These data are considered the TEDDY standard for Ascorbic
 Genome Annotation Genome annotation What is the function of each part of the genome? Where are the genes? What is the mrna sequence (transcription, splicing) What is the protein sequence? What does
Agilent s NEW MassHunter Profinder
 Agilent s NEW MassHunter Profinder The Most Advanced Batch Feature Extraction Software for Metabolomics Theodore Sana, Ph.D. Metabolomics Marketing Manager 1 MassHunter Profinder A Batch Feature Extraction
Motivation From Protein to Gene
 MOLECULAR BIOLOGY 2003-4 Topic B Recombinant DNA -principles and tools Construct a library - what for, how Major techniques +principles Bioinformatics - in brief Chapter 7 (MCB) 1 Motivation From Protein
Design. Construction. Characterization
 Design Construction Characterization DNA mrna (messenger) A C C transcription translation C A C protein His A T G C T A C G Plasmids replicon copy number incompatibility selection marker origin of replication
Functional microrna targets in protein coding sequences. Merve Çakır
 Functional microrna targets in protein coding sequences Martin Reczko, Manolis Maragkakis, Panagiotis Alexiou, Ivo Grosse, Artemis G. Hatzigeorgiou Merve Çakır 27.04.2012 microrna * micrornas are small