Designing Complex Omics Experiments
|
|
|
- Samson Cunningham
- 6 years ago
- Views:
Transcription
1 Designing Complex Omics Experiments Xiangqin Cui Section on Statistical Genetics Department of Biostatistics University of Alabama at Birmingham 6/15/2015 Some slides are from previous lectures given by Grier Page
2 The Myth That Metabolomics does not need a Hypothesis There always needs to be a biological question in the experiment. The question could be nebulous: What happens to the metabolome of this tissue when I apply Drug A. The purpose of the question drives the experimental design. Make sure the samples answer the question
3 Experimental design Experimental design: is a term used about efficient methods for planning the collection of data, in order to obtain the maximum amount of information for the least amount of work. Anyone collecting and analyzing data, be it in the lab, the field or the production plant, can benefit from knowledge about experimental design.

4
5 UMSA Analysis Day 1 Day 2 Insulin Resistant Insulin Sensitive
6 Experimental design general principals Randomization Replication Blocking Use of factorial experiments instead of the one-factor-at-a-time methods. Orthogonality
7 Randomization The experimental treatments are assigned to the experimental units (subjects) in a random fashion. It helps to eliminate effect of "lurking variables", uncontrolled factors which might vary over the length of the experiment.
8 Commonly used randomization method Number the objects to be randomized and then randomly draw the numbers using paper pieces in a hat or computer random number generator. Example: Assign two treatments, Hormone and control, to 6 plants Hormone treatment: (1,3,4) ; (1,2,6) Control : (2,5,6) ; (3,4,5)
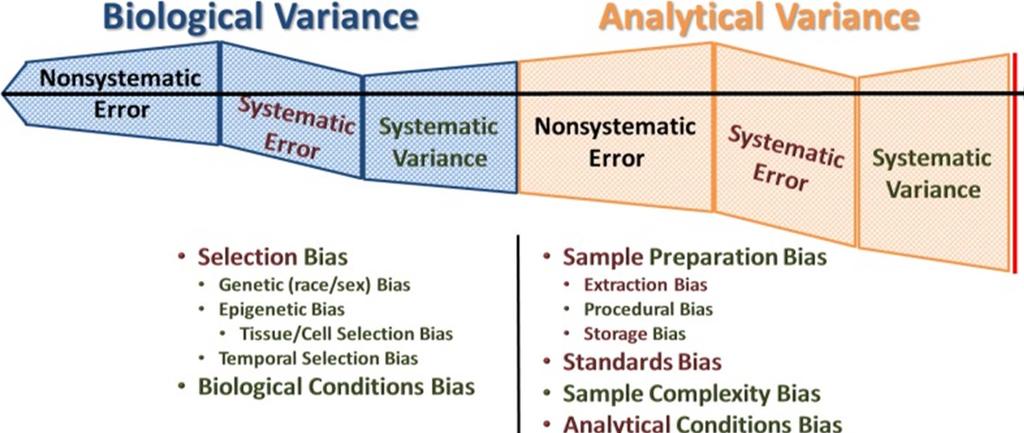
9 Design Issues in Omics Exp Known sources of non-biological error (not exhaustive) that must be addressed Technician / post-doc Reagent lot Temperature Protocol Date Location Cage/ Field positions
10 Randomization in Omics Experiments Randomize samples in respect to treatments Randomize the order of handling samples. Randomize arrays/runs/gels/days in respect to samples
11 How to Randomize Not covering your eyes and pick a subject Number your subjects and use random generator on your computer to pick random numbers. Write numbers on pieces of paper and do a random pick.
12 Replication Replication is repeating the creation of a phenomenon, so that the variability associated with the phenomenon can be estimated. Replications should not be confused with repeated measurements which refer to literally taking several measurements of a single occurrence of a phenomenon.
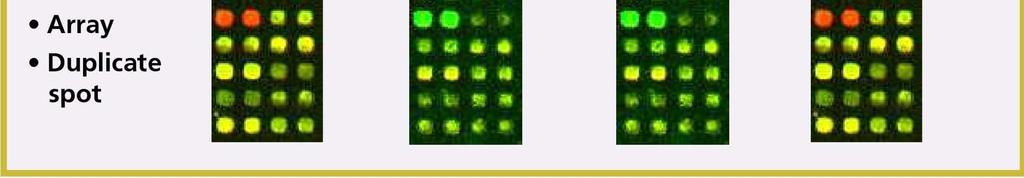
13 Replication in omics experiments What to replicate? Biological replicates (replicates at the experimental unit level, e.g. mouse, plant, pot of plants ) Experimental unit is the unit that the experiment treatment or condition is directly applied to, e.g. a plant if hormone is sprayed to individual plants; a pot of seedlings if different fertilizers are applied to different pots. Technical replicates Any replicates below the experimental unit, e.g. different leaves from the same plant sprayed with one hormone level; different seedlings from the same pot; Different aliquots of the same RNA extraction; multiple arrays hybridized to the same RNA; multiple spots on the same array.

14 Blood Array or Spec /run
15 Replication in Omics experiments Biological replicates are typically more important than technical replicates unless estimating the variation at different levels is the purpose of the experiment in evaluating the technology. Biological replicates are often more effective in increasing the power for detecting differential metabolites/genes. Technical replicates are useful when technical variability is large and technical replicates are cheap.
16 How Many to Replicate? ---Sample Size Replication is repeating the creation of a phenomenon, so that the variability associated with the phenomenon can be estimated. The accuracy of the estimation of the variability depends on the degree of freedom for estimating the variability. Degree of freedom (df) is a measure of the number of independent pieces of information on which the precision of a parameter estimate (e.g. variance) is based. The degrees of freedom for an estimate equals the number of observations (values) minus the number of additional parameters estimated for that calculation.
17 How many replicates? ---- Sample Size Example: degree of freedom (df) for estimating the variance. Using a 2x2 factorial design to examine the effects of two factors, A and B. Each factor has two levels. ANOVA model: y A B A* B Factorial 2 x 2 A1(m) A2(f) B1 (Trt) r r B2 (Ctr) r r S.V. (r=1) (r=2) (r=3) μ A B A*B Var Total
18 Sample Size and Power Sample size for a general two sample comparison n 2 z z (1 / 2) (1 ) ( / ) 2 2 n increases as error, σ, increases. n increases as the difference between two means, δ,decreases. n increases as the significant level of the test, α, decreases. n increases as the power of the test, 1-β, increases.

19
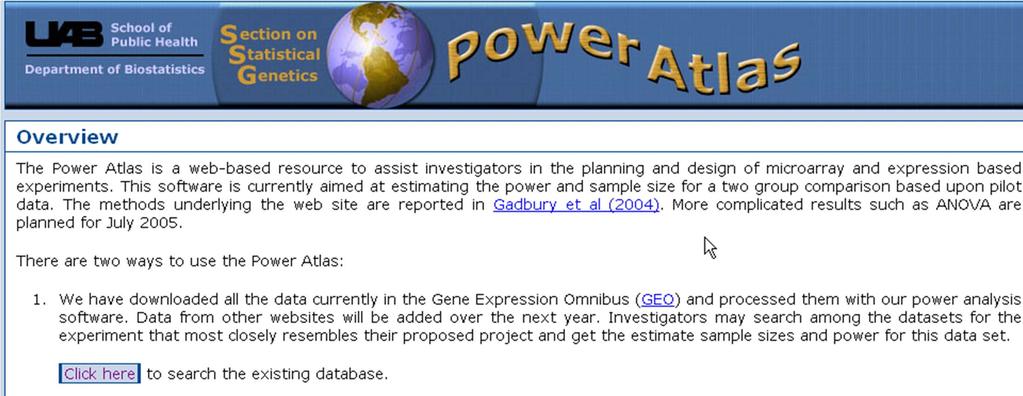
20 Some R Power Packages in Bioconductor RNASeqPower Sizepower SSPA CSSP
21 Multilevel Replication and Resource allocation: When there are both biological replications and technical replications. Example: Biological variation EV 2 2 M e m mn Technical variation m n mouse / trt (biorep) runs / mouse Error variance of the fold change C M C A cost / mouse cost / run Note: to reduce EV increasing m (number of biological replicates) is more efficient.
22 Resource Allocation Considering the error variance and the cost equations, we can obtain how many biological replicates and how many technical replicates to best allocate the money. 2 2 M e EV m mn Cost mc m M nc A (reference design with dye-swaps) The optimum number of runs per biological replicate: n 2 e 2 M C C M A
23 Examples for resource allocation in early microarray experiments Using variance components estimated from kidney in Project Normal data. No replicated spots on array Reference design Mouse price Array price/pair # of array pairs per mouse $15 $600 1 $300 $600 1 $1500 $600 2 More efficient array level designs, such as direct comparisons and loop designs, can reduce the optimum number of arrays per mouse.
24 Pooling Biological Samples Theoretically, pooling can reduce the biological variance but not the technical variances. The biological variance will be replaced by: 2 1 pool 2 M k k : # of samples per pool 2 M 2 pool individual biorep variance pool variance Note: It is often assumed that pooling will reduce the biological variance, therefore, be more efficient.
25 Potential problems of Pooling Reduced ability to estimate individual variability Prevent from identifying proper transformation and removing outliers. Not valid for classification studies (important for biomarker identification) Pooling samples is averaging at the raw level while the average of multiple samples is often after transformation (e.g. log2). The biological variability reduction is often smaller than 1/k. 2 1 pool k 2 M α : constant for the effect of pooling. 0 < α < 1 α = 1, pooling has maximum effect. α = 0, pooling has no effect. α < 0, pooling has negative effect.
26 Potential Advantage of Pooling When individual sample quantity is limited or technology is extremely expensive, pooling samples can increase the accuracy of the Fold Change estimation between two groups. Pooling has the potential to reduce the overall variance.
27 Example: Power Increase to Detect 2 fold change by Pooling in a mouse experiment (CAMDA 2002) ( Pool size k = 3, α = 1 ) 2 pools / trt 4 pools / trt 6 pools / trt 8 pools / trt 2 mice / trt 4 mice / trt 6 mice / trt 8 mice / trt Significance level: 0.05 after Bonferroni correction
28 General Design Principles -- Continues Use of factorial experiments instead of the one-factorat-a-time methods. Orthogonality: Factors are perpendicular to each other. Otherwise, the factors are called confounded or even nested. To compare two treatments (T1, T2) and two strains (S1, S2) T1 T2 S1 T1S1 T2S1 S2 T1S2 T2S2
29 Example If we want to compare cases vs controls and male vs female. This two-factor design is more efficient than two experiments focusing on one factor in each. male female case m/case f/case ctrl m/ctrl f/ctrl
30 Blocking Some identified uninteresting but varying factors can be controlled through blocking. COMPLETELY RANDOMIZED DESIGN COMPLETE BLOCK DESIGN INCOMPLETELY BLOCK DESIGNS
.")
31 Completely Randomized Design There is no blocking Example Compare two hormone treatments (trt and control) using 6 Arabidopsis plants (or mice or human) Hormone trt: (1,3,4); (1,2,6) Control : (2,5,6); (3,4,5)
32 Complete Block Design There is blocking and the block size is equal to the number of treatments. Example: Compare two hormone treatments (trt and control) using 6 Arabidopsis plants. For some reason plant 1 and 2 are taller, plant 5 and 6 are thinner Hormone treatment: (1,4,5) ; (1,3,6) Control : (2,3,6) ; (2,4,5) Randomization within blocks

33 UMSA Analysis Day 1 Day 2 Insulin Resistant Insulin Sensitive
34 Incomplete Block Design There is blocking and the block size is smaller than the number of treatments. Example: Compare three hormone treatments (hormone level 1, hormone level 2, and control) using 6 Arabidopsis plants. For some reason plant 1 and 2 are taller, plant 5 and 6 are thinner Hormone level1: (1,4) ; (2,4) Hormone level2: (2,5) ; (1,6) Control : (3,6) ; (3.5) Randomization within blocks
35 Example: Incomplete Blocking in 2- color Microarray Experiments There are a smaller number of unit in each block than number of treatments/conditions to be compared. Example: In two-color microarrays, each array is a block of size 2, the samples are compared within each array. Example: compare three samples: A, B, C A B B C C A Block (array) 1 Block (array) 2 Block (array) 3
36 Reference design All samples are compared to a single reference sample. The reference sample is of no interest to the investigator. common reference A B C R
37 Loop Design A D B C
38 Can Get Complicated T1 T2 T3 M1 M2 M3 M4 M5 M6 M7 M8 M9 M10 M11 M12 M13 M14 M15 R R R R R R R R R R R R R R R (Churchill and Oliver, 2001)
39 Statistical analyses Supervised analyses linear models etc Assume IID (independently identically distibuted) Normality Sometimes can rely on central limit Weird variances Using fold change alone as a statistic alone is not valid. Shrinkage and or use of Bayes can be a good thing. False-discovery rate is a good alternative to conventional multiple-testing approaches. Pathway testing is desirable.

40 Volcano Plot for Two Group Comparison
41 Other Plots
42 Classification Supervised classification Supervised-classification procedures require independent cross-validation. See MAQC-II recommendations Nat Biotechnol August ; 28(8): doi: /nbt Wholly separate model building and validation stages. Can be 3 stage with multiple models tested Unsupervised classification Unsupervised classification should be validated using resampling-based procedures.
43 Unsupervised classification - continued Unsupervised analysis methods Cluster analysis Principle components All have assumptions and input parameters and changing them results in very different answers
44 References Churchill GA. Fundamentals of experimental design for cdna microarrays. Nature Genet. 32: , Cui X and Churchill GA. How many mice and how many arrays? Replication in mouse cdna microarray experiments, in "Methods of Microarray Data Analysis III", Edited by KF Johnson and SM Lin. Kluwer Academic Publishers, Norwell, MA. pp , Gadbury GL, et al. Power and sample size estimation in high dimensional biology. Stat Meth Med Res 13: , Kerr MK. Design considerations for efficient and effective microarray studies. Biometrics 59: , Kerr MK and Churchill GA. Statistical design and the analysis of gene expression microarray data. Genet. Res. 77: , Kuehl RO. Design of experiments: statistical principles of research design and analysis, 2 nd ed., 1994, (Brooks/cole) Duxbry Press, Pacific Grove, CA. Page GP et al. The PowerAtlas: a power and sample size atlas for microarray experimental design and research. BMC Bioinformatics Feb 22;7:84. Rosa GJM, et al. Reassessing design and analysis of two-colour microarray experiments using mixed effects models. Comp. Funct. Genomics 6: Wit E, et al. Near-optimal designs for dual channel microarray studies. Appl. Statist. 54: , Yand YH and Speed T. Design issues for cdna microarray experiments. Nat. Rev. Genet. 3: , 2002.
Designing a Complex-Omics Experiments. Xiangqin Cui. Section on Statistical Genetics Department of Biostatistics University of Alabama at Birmingham
 Designing a Complex-Omics Experiments Xiangqin Cui Section on Statistical Genetics Department of Biostatistics University of Alabama at Birmingham 1/7/2015 Some slides are from previous lectures of Grier
Designing a Metabolomics Experiment
 UAB Metabolomics Workshop July 18, 2016 Designing a Metabolomics Experiment Xiangqin Cui, PhD Experimental Design Experimental design: is a term used about efficient methods for planning the collection
Integrative Genomics 1a. Introduction
 2016 Course Outline Integrative Genomics 1a. Introduction ggibson.gt@gmail.com http://www.cig.gatech.edu 1a. Experimental Design and Hypothesis Testing (GG) 1b. Normalization (GG) 2a. RNASeq (MI) 2b. Clustering
Terminology. Introduction to Experimental Design. Terminology (continued) Terminology (continued) Example 1
 Terminology (continued) Example 1") Terminology Introduction to Experimental Design /9/0 Copyright 0 Dan Nettleton Experiment An investigation in which the investigator applies some treatments to experimental units and then observes the
Terminology Introduction to Experimental Design /9/0 Copyright 0 Dan Nettleton Experiment An investigation in which the investigator applies some treatments to experimental units and then observes the
Terminology. Introduction to Experimental Design. Terminology (continued) Terminology (continued) Example 1
 Terminology (continued) Example 1") Terminology Introduction to Experimental Design /6/009 Copyright 009 Dan Nettleton Experiment An investigation in which the investigator applies some treatments to experimental units and then observes
Terminology Introduction to Experimental Design /6/009 Copyright 009 Dan Nettleton Experiment An investigation in which the investigator applies some treatments to experimental units and then observes
Outline. Analysis of Microarray Data. Most important design question. General experimental issues
 Outline Analysis of Microarray Data Lecture 1: Experimental Design and Data Normalization Introduction to microarrays Experimental design Data normalization Other data transformation Exercises George Bell,
Estoril Education Day
 Estoril Education Day -Experimental design in Proteomics October 23rd, 2010 Peter James Note Taking All the Powerpoint slides from the Talks are available for download from: http://www.immun.lth.se/education/
Introduction to Microarray Technique, Data Analysis, Databases Maryam Abedi PhD student of Medical Genetics
 Introduction to Microarray Technique, Data Analysis, Databases Maryam Abedi PhD student of Medical Genetics abedi777@ymail.com Outlines Technology Basic concepts Data analysis Printed Microarrays In Situ-Synthesized
Some Principles for the Design and Analysis of Experiments using Gene Expression Arrays and Other High-Throughput Assay Methods
 Some Principles for the Design and Analysis of Experiments using Gene Expression Arrays and Other High-Throughput Assay Methods BST 226 Statistical Methods for Bioinformatics January 8, 2014 1 The -Omics
The essentials of microarray data analysis
 The essentials of microarray data analysis (from a complete novice) Thanks to Rafael Irizarry for the slides! Outline Experimental design Take logs! Pre-processing: affy chips and 2-color arrays Clustering
Some Principles for the Design and Analysis of Experiments using Gene Expression Arrays and Other High-Throughput Assay Methods
 Some Principles for the Design and Analysis of Experiments using Gene Expression Arrays and Other High-Throughput Assay Methods EPP 245/298 Statistical Analysis of Laboratory Data October 11, 2005 1 The
The use of statistics in microarray studies Prof. Ernst Wit
 The Use of Statistics in Microarray Studies University of Groningen e.c.wit@rug.nl http://www.math.rug.nl/~ernst 1 Outline Pooling experimental material Dual-channel microarray designs Loop designs vs.
Experimental Design for Gene Expression Microarray. Jing Yi 18 Nov, 2002
 Experimental Design for Gene Expression Microarray Jing Yi 18 Nov, 2002 Human Genome Project The HGP continued emphasis is on obtaining by 2003 a complete and highly accurate reference sequence(1 error
Analysis of Microarray Data
 Analysis of Microarray Data Lecture 1: Experimental Design and Data Normalization George Bell, Ph.D. Senior Bioinformatics Scientist Bioinformatics and Research Computing Whitehead Institute Outline Introduction
Identification of biological themes in microarray data from a mouse heart development time series using GeneSifter
 Identification of biological themes in microarray data from a mouse heart development time series using GeneSifter VizX Labs, LLC Seattle, WA 98119 Abstract Oligonucleotide microarrays were used to study
Preprocessing of Microarray data I: Normalization and Missing Values. For example, a list of possible sources in spotted arrays:
 Normalization: Preprocessing of Microarray data I: Normalization and Missing Values Comparability across two (experimental condition vs control) or more (many experimental conditions) sets of measurements.
Experimental Setup and Design. Kjell Petersen Computational Biology Unit
 Experimental Setup and Design Kjell Petersen Computational Biology Unit Biological generality Batch Replicates Biological generality Batch Replicates Overview Compare the right samples for your hypothesis
Analysis of Microarray Data
 Analysis of Microarray Data Lecture 1: Experimental Design and Data Normalization George Bell, Ph.D. Senior Bioinformatics Scientist Bioinformatics and Research Computing Whitehead Institute Outline Introduction
Bioinformatics for Biologists
 Bioinformatics for Biologists Functional Genomics: Microarray Data Analysis Fran Lewitter, Ph.D. Head, Biocomputing Whitehead Institute Outline Introduction Working with microarray data Normalization Analysis
CS-E5870 High-Throughput Bioinformatics Microarray data analysis
 CS-E5870 High-Throughput Bioinformatics Microarray data analysis Harri Lähdesmäki Department of Computer Science Aalto University September 20, 2016 Acknowledgement for J Salojärvi and E Czeizler for the
Bioinformatics for Biologists
 Bioinformatics for Biologists Microarray Data Analysis. Lecture 1. Fran Lewitter, Ph.D. Director Bioinformatics and Research Computing Whitehead Institute Outline Introduction Working with microarray data
Microarray analysis challenges.
 Microarray analysis challenges. While not quite as bad as my hobby of ice climbing you, need the right equipment! T. F. Smith Bioinformatics Boston Univ. Experimental Design Issues Reference and Controls
David M. Rocke Division of Biostatistics and Department of Biomedical Engineering University of California, Davis
 David M. Rocke Division of Biostatistics and Department of Biomedical Engineering University of California, Davis Outline RNA-Seq for differential expression analysis Statistical methods for RNA-Seq: Structure
Exam 1 from a Past Semester
 Exam from a Past Semester. Provide a brief answer to each of the following questions. a) What do perfect match and mismatch mean in the context of Affymetrix GeneChip technology? Be as specific as possible
Analysis of Microarray Data
 Analysis of Microarray Data Lecture 3: Visualization and Functional Analysis George Bell, Ph.D. Senior Bioinformatics Scientist Bioinformatics and Research Computing Whitehead Institute Outline Review
STATISTICAL CHALLENGES IN GENE DISCOVERY
 STATISTICAL CHALLENGES IN GENE DISCOVERY THROUGH MICROARRAY DATA ANALYSIS 1 Central Tuber Crops Research Institute,Kerala, India 2 Dept. of Statistics, St. Thomas College, Pala, Kerala, India email:sreejyothi
Analysis of Microarray Data
 Analysis of Microarray Data Lecture 3: Visualization and Functional Analysis George Bell, Ph.D. Bioinformatics Scientist Bioinformatics and Research Computing Whitehead Institute Outline Review Visualizing
Normalization. Getting the numbers comparable. DNA Microarray Bioinformatics - #27612
 Normalization Getting the numbers comparable The DNA Array Analysis Pipeline Question Experimental Design Array design Probe design Sample Preparation Hybridization Buy Chip/Array Image analysis Expression
Exploration and Analysis of DNA Microarray Data
 Exploration and Analysis of DNA Microarray Data Dhammika Amaratunga Senior Research Fellow in Nonclinical Biostatistics Johnson & Johnson Pharmaceutical Research & Development Javier Cabrera Associate
Microarray data analysis: from disarray to consolidation and consensus
 Microarray data analysis: from disarray to consolidation and consensus David B. Allison*, Xiangqin Cui*, Grier P. Page* and Mahyar Sabripour* Abstract In just a few years, microarrays have gone from obscurity
Gene expression: Microarray data analysis. Copyright notice. Outline: microarray data analysis. Schedule
 Gene expression: Microarray data analysis Copyright notice Many of the images in this powerpoint presentation are from Bioinformatics and Functional Genomics by Jonathan Pevsner (ISBN -47-4-8). Copyright
Microarray Data Analysis Workshop. Preprocessing and normalization A trailer show of the rest of the microarray world.
 Microarray Data Analysis Workshop MedVetNet Workshop, DTU 2008 Preprocessing and normalization A trailer show of the rest of the microarray world Carsten Friis Media glna tnra GlnA TnrA C2 glnr C3 C5 C6
Standard Data Analysis Report Agilent Gene Expression Service
 Standard Data Analysis Report Agilent Gene Expression Service Experiment: S534662 Date: 2011-01-01 Prepared for: Dr. Researcher Genomic Sciences Lab Prepared by S534662 Standard Data Analysis Report 2011-01-01
Gene Expression Data Analysis
 Gene Expression Data Analysis Bing Zhang Department of Biomedical Informatics Vanderbilt University bing.zhang@vanderbilt.edu BMIF 310, Fall 2009 Gene expression technologies (summary) Hybridization-based
Statistical Experimental Design in Proteomics
 Statistical Experimental Design in Proteomics Sreelatha Meleth PhD Biostatistics & Bioinformatics Unit of The Comprehensive Cancer Center UAB Introduction to Proteomics 2006 Workshop University of Alabama
Gene expression analysis. Biosciences 741: Genomics Fall, 2013 Week 5. Gene expression analysis
 Gene expression analysis Biosciences 741: Genomics Fall, 2013 Week 5 Gene expression analysis From EST clusters to spotted cdna microarrays Long vs. short oligonucleotide microarrays vs. RT-PCR Methods
Pre processing and quality control of microarray data
 Pre processing and quality control of microarray data Christine Stansberg, 20.04.10 Workflow microarray experiment 1 Problem driven experimental design Wet lab experiments RNA labelling 2 Data pre processing
Introduction to Bioinformatics and Gene Expression Technology
 Vocabulary Introduction to Bioinformatics and Gene Expression Technology Utah State University Spring 2014 STAT 5570: Statistical Bioinformatics Notes 1.1 Gene: Genetics: Genome: Genomics: hereditary DNA
Introduction to gene expression microarray data analysis
 Introduction to gene expression microarray data analysis Outline Brief introduction: Technology and data. Statistical challenges in data analysis. Preprocessing data normalization and transformation. Useful
Introduction to Bioinformatics. Fabian Hoti 6.10.
 Introduction to Bioinformatics Fabian Hoti 6.10. Analysis of Microarray Data Introduction Different types of microarrays Experiment Design Data Normalization Feature selection/extraction Clustering Introduction
Some Principles for the Design and Analysis of Experiments using Gene Expression Arrays and Other High-Throughput Assay Methods
 Some Principles for the Design and Analysis of Experiments using Gene Expression Arrays and Other High-Throughput Assay Methods SPH 247 Statistical Analysis of Laboratory Data April 21, 2015 1 The -Omics
Bootstrapping Cluster Analysis: Assessing the Reliability of Conclusions from Microarray Experiments
 Bootstrapping Cluster Analysis: Assessing the Reliability of Conclusions from Microarray Experiments M. Kathleen Kerr The Jackson Laboratory Bar Harbor, Maine 469 U.S.A. mkk@jax.org Gary A. Churchill 1
Experimental design of RNA-Seq Data
 Experimental design of RNA-Seq Data RNA-seq course: The Power of RNA-seq Thursday June 6 th 2013, Marco Bink Biometris Overview Acknowledgements Introduction Experimental designs Randomization, Replication,
Normalization of metabolomics data using multiple internal standards
 Normalization of metabolomics data using multiple internal standards Matej Orešič 1 1 VTT Technical Research Centre of Finland, Tietotie 2, FIN-02044 Espoo, Finland matej.oresic@vtt.fi Abstract. Success
Seven Keys to Successful Microarray Data Analysis
 Seven Keys to Successful Microarray Data Analysis Experiment Design Platform Selection Data Management System Access Differential Expression Biological Significance Data Publication Type of experiment
Bioinformatics. Microarrays: designing chips, clustering methods. Fran Lewitter, Ph.D. Head, Biocomputing Whitehead Institute
 Bioinformatics Microarrays: designing chips, clustering methods Fran Lewitter, Ph.D. Head, Biocomputing Whitehead Institute Course Syllabus Jan 7 Jan 14 Jan 21 Jan 28 Feb 4 Feb 11 Feb 18 Feb 25 Sequence
Microarray Gene Expression Analysis at CNIO
 Microarray Gene Expression Analysis at CNIO Orlando Domínguez Genomics Unit Biotechnology Program, CNIO 8 May 2013 Workflow, from samples to Gene Expression data Experimental design user/gu/ubio Samples
Combining ANOVA and PCA in the analysis of microarray data
 Combining ANOVA and PCA in the analysis of microarray data Lutgarde Buydens IMM, Analytical chemistry Radboud University Nijmegen, the Netherlands Scientific Staff: PhD students: External PhD: Post doc:
Preprocessing Methods for Two-Color Microarray Data
 Preprocessing Methods for Two-Color Microarray Data 1/15/2011 Copyright 2011 Dan Nettleton Preprocessing Steps Background correction Transformation Normalization Summarization 1 2 What is background correction?
Linear Models for Microarray Data Analysis: Hidden Similarities and Differences
 UW Biostatistics Working Paper Series 5-16-2003 Linear Models for Microarray Data Analysis: Hidden Similarities and Differences M. Kathleen Kerr University of Washington, katiek@u.washington.edu Suggested
Measuring and Understanding Gene Expression
 Measuring and Understanding Gene Expression Dr. Lars Eijssen Dept. Of Bioinformatics BiGCaT Sciences programme 2014 Why are genes interesting? TRANSCRIPTION Genome Genomics Transcriptome Transcriptomics
Microarray Informatics
 Microarray Informatics Donald Dunbar MSc Seminar 31 st January 2007 Aims To give a biologist s view of microarray experiments To explain the technologies involved To describe typical microarray experiments
S SG. Grier P Page, Ph.D. Associate Professor. ection. enetics. Department of Biostatistics School of Public Health. ON tatistical
 S SG ection ON tatistical enetics Grier P Page, Ph.D. Associate Professor Department of Biostatistics School of Public Health Quality Control of Microarray Studies From Affymetrix.com www.biology.ucsc.edu/
Microarray Technique. Some background. M. Nath
 Microarray Technique Some background M. Nath Outline Introduction Spotting Array Technique GeneChip Technique Data analysis Applications Conclusion Now Blind Guess? Functional Pathway Microarray Technique
STATISTICAL ANALYSIS OF 70-MER OLIGONUCLEOTIDE MICROARRAY DATA FROM POLYPLOID EXPERIMENTS USING REPEATED DYE-SWAPS
 STATISTICAL ANALYSIS OF 7-MER OLIGONUCLEOTIDE MICROARRAY DATA FROM POLYPLOID EXPERIMENTS USING REPEATED DYE-SWAPS Hongmei Jiang 1, Jianlin Wang, Lu Tian, Z. Jeffrey Chen, and R.W. Doerge 1 1 Department
Animal Research Ethics Committee. Guidelines for Submitting Protocols for ethical approval of research or teaching involving live animals
 Animal Research Ethics Committee Guidelines for Submitting Protocols for ethical approval of research or teaching involving live animals AREC Document No: 3 Revised Guidelines for Submitting Protocols
Inherent variation in the reactions, type of enzymes used. Depends on the type of labeling and procedures, as well as the age of the labels.
 332 Experimental design, analysis of variance and slide quality assessment in gene expression arrays Sorin Draghici*, Alexander Kuklin, Bruce Hoff & Soheil Shams Address BioDiscovery Inc 11150 West Olympic
advanced analysis of gene expression microarray data aidong zhang World Scientific State University of New York at Buffalo, USA
 advanced analysis of gene expression microarray data aidong zhang State University of New York at Buffalo, USA World Scientific NEW JERSEY LONDON SINGAPORE BEIJING SHANGHAI HONG KONG TAIPEI CHENNAI Contents
Exploration and Analysis of DNA Microarray Data
 Exploration and Analysis of DNA Microarray Data Dhammika Amaratunga Senior Research Fellow in Nonclinical Biostatistics Johnson & Johnson Pharmaceutical Research & Development Javier Cabrera Associate
Humboldt Universität zu Berlin. Grundlagen der Bioinformatik SS Microarrays. Lecture
 Humboldt Universität zu Berlin Microarrays Grundlagen der Bioinformatik SS 2017 Lecture 6 09.06.2017 Agenda 1.mRNA: Genomic background 2.Overview: Microarray 3.Data-analysis: Quality control & normalization
EECS730: Introduction to Bioinformatics
 EECS730: Introduction to Bioinformatics Lecture 14: Microarray Some slides were adapted from Dr. Luke Huan (University of Kansas), Dr. Shaojie Zhang (University of Central Florida), and Dr. Dong Xu and
New Statistical Algorithms for Monitoring Gene Expression on GeneChip Probe Arrays
 GENE EXPRESSION MONITORING TECHNICAL NOTE New Statistical Algorithms for Monitoring Gene Expression on GeneChip Probe Arrays Introduction Affymetrix has designed new algorithms for monitoring GeneChip
Syllabus for BIOS 101, SPRING 2013
 Page 1 Syllabus for BIOS 101, SPRING 2013 Name: BIOSTATISTICS 101 for Cancer Researchers Time: March 20 -- May 29 4-5pm in Wednesdays, [except 4/15 (Mon) and 5/7 (Tue)] Location: SRB Auditorium Background
Microarray Informatics
 Microarray Informatics Donald Dunbar MSc Seminar 4 th February 2009 Aims To give a biologistʼs view of microarray experiments To explain the technologies involved To describe typical microarray experiments
Review Statistical tests for differential expression in cdna microarray experiments Xiangqin Cui and Gary A Churchill
 Review Statistical tests for differential expression in cdna microarray experiments Xiangqin Cui and Gary A Churchill Address: The Jackson Laboratory, 600 Main Street, Bar Harbor, Maine 04609, USA. Correspondence:
Microarray pipeline & Pre-processing
 Microarray pipeline & Pre-processing Solveig Mjelstad Olafsrud J Express Analysis Course November 2010 Some slides adapted from Christine Stansberg thank you Christine! The microarray pipeline The goal
Introduction to Bioinformatics: Chapter 11: Measuring Expression of Genome Information
 HELSINKI UNIVERSITY OF TECHNOLOGY LABORATORY OF COMPUTER AND INFORMATION SCIENCE Introduction to Bioinformatics: Chapter 11: Measuring Expression of Genome Information Jarkko Salojärvi Lecture slides by
Analysis of a Proposed Universal Fingerprint Microarray
 Analysis of a Proposed Universal Fingerprint Microarray Michael Doran, Raffaella Settimi, Daniela Raicu, Jacob Furst School of CTI, DePaul University, Chicago, IL Mathew Schipma, Darrell Chandler Bio-detection
BIOINF/BENG/BIMM/CHEM/CSE 184: Computational Molecular Biology. Lecture 2: Microarray analysis
 BIOINF/BENG/BIMM/CHEM/CSE 184: Computational Molecular Biology Lecture 2: Microarray analysis Genome wide measurement of gene transcription using DNA microarray Bruce Alberts, et al., Molecular Biology
Differential expression analysis for sequencing count data. Simon Anders
 Differential expression analysis for sequencing count data Simon Anders Two applications of RNA-Seq Discovery find new transcripts find transcript boundaries find splice junctions Comparison Given samples
Using 2-way ANOVA to dissect the immune response to hookworm infection in mouse lung
 Using 2-way ANOVA to dissect the immune response to hookworm infection in mouse lung Using 2-way ANOVA to dissect the immune response to hookworm infection in mouse lung General microarry data analysis
Gene Regulation Solutions. Microarrays and Next-Generation Sequencing
 Gene Regulation Solutions Microarrays and Next-Generation Sequencing Gene Regulation Solutions The Microarrays Advantage Microarrays Lead the Industry in: Comprehensive Content SurePrint G3 Human Gene
FACTORS CONTRIBUTING TO VARIABILITY IN DNA MICROARRAY RESULTS: THE ABRF MICROARRAY RESEARCH GROUP 2002 STUDY
 FACTORS CONTRIBUTING TO VARIABILITY IN DNA MICROARRAY RESULTS: THE ABRF MICROARRAY RESEARCH GROUP 2002 STUDY K. L. Knudtson 1, C. Griffin 2, A. I. Brooks 3, D. A. Iacobas 4, K. Johnson 5, G. Khitrov 6,
Background Correction and Normalization. Lecture 3 Computational and Statistical Aspects of Microarray Analysis June 21, 2005 Bressanone, Italy
 Background Correction and Normalization Lecture 3 Computational and Statistical Aspects of Microarray Analysis June 21, 2005 Bressanone, Italy Feature Level Data Outline Affymetrix GeneChip arrays Two
Microarray. Key components Array Probes Detection system. Normalisation. Data-analysis - ratio generation
 Microarray Key components Array Probes Detection system Normalisation Data-analysis - ratio generation MICROARRAY Measures Gene Expression Global - Genome wide scale Why Measure Gene Expression? What information
Introduction to microarrays
 Bayesian modelling of gene expression data Alex Lewin Sylvia Richardson (IC Epidemiology) Tim Aitman (IC Microarray Centre) Philippe Broët (INSERM, Paris) In collaboration with Anne-Mette Hein, Natalia
This place covers: Methods or systems for genetic or protein-related data processing in computational molecular biology.
 G16B BIOINFORMATICS, i.e. INFORMATION AND COMMUNICATION TECHNOLOGY [ICT] SPECIALLY ADAPTED FOR GENETIC OR PROTEIN-RELATED DATA PROCESSING IN COMPUTATIONAL MOLECULAR BIOLOGY Methods or systems for genetic
A Discussion of Statistical Methods for Design and Analysis of Microarray Experiments for Plant Scientists
 The Plant Cell, Vol. 18, 2112 2121, September 2006, www.plantcell.org ª 2006 American Society of Plant Biologists SPECIAL SERIES ON LARGE-SCALE BIOLOGY A Discussion of Statistical Methods for Design and
QTL mapping in mice. Karl W Broman. Department of Biostatistics Johns Hopkins University Baltimore, Maryland, USA.
 QTL mapping in mice Karl W Broman Department of Biostatistics Johns Hopkins University Baltimore, Maryland, USA www.biostat.jhsph.edu/ kbroman Outline Experiments, data, and goals Models ANOVA at marker
Additional file 2. Figure 1: Receiver operating characteristic (ROC) curve using the top
 curve using the top") Additional file 2 Figure Legends: Figure 1: Receiver operating characteristic (ROC) curve using the top discriminatory features between HIV-infected (n=32) and HIV-uninfected (n=15) individuals. The top
Additional file 2 Figure Legends: Figure 1: Receiver operating characteristic (ROC) curve using the top discriminatory features between HIV-infected (n=32) and HIV-uninfected (n=15) individuals. The top
Statistical Design and the Analysis of Gene Expression Microarray Data 1
 Statistical Design and the Analysis of Gene Expression Microarray Data 1 M. Kathleen Kerr and Gary A. Churchill The Jackson Laboratory Bar Harbor, Maine 04609 USA Short title: Statistical Design and Analysis
Gene expression analysis: Introduction to microarrays
 Gene expression analysis: Introduction to microarrays Adam Ameur The Linnaeus Centre for Bioinformatics, Uppsala University February 15, 2006 Overview Introduction Part I: How a microarray experiment is
DNA Microarrays and Clustering of Gene Expression Data
 DNA Microarrays and Clustering of Gene Expression Data Martha L. Bulyk mlbulyk@receptor.med.harvard.edu Biophysics 205 Spring term 2008 Traditional Method: Northern Blot RNA population on filter (gel);
Significance testing for small microarray experiments
 CHAPTER 8 Significance testing for small microarray experiments Charles Kooperberg, Aaron Aragaki, Charles C. Carey, and Suzannah Rutherford 8.1 Introduction When a study has many degrees of freedom it
Lecture #1. Introduction to microarray technology
 Lecture #1 Introduction to microarray technology Outline General purpose Microarray assay concept Basic microarray experimental process cdna/two channel arrays Oligonucleotide arrays Exon arrays Comparing
Statistical Methods in Bioinformatics
 Statistical Methods in Bioinformatics CS 594/680 Arnold M. Saxton Department of Animal Science UT Institute of Agriculture Bioinformatics: Interaction of Biology/Genetics/Evolution/Genomics Computer Science/Algorithms/Database
UNIVERSITY OF WISCONSIN AND MEDICAL INFORMATICS
 UNIVERSITY OF WISCONSIN DEPARTMENT OF BIOSTATISTICS AND MEDICAL INFORMATICS Technical Report # 183 July 2004 To Pool or Not to Pool: A Question of Microarray Experimental Design C. Kendziorski 1, R.A.
Rafael A Irizarry, Department of Biostatistics JHU
 Getting Usable Data from Microarrays it s not as easy as you think Rafael A Irizarry, Department of Biostatistics JHU rafa@jhu.edu http://www.biostat.jhsph.edu/~ririzarr http://www.bioconductor.org Acknowledgements
Design and analysis of experiments with high throughput biological assay data
 Seminars in Cell & Developmental Biology 15 (2004) 703 713 Design and analysis of experiments with high throughput biological assay data David M. Rocke Division of Biostatistics, University of California,
Nima Hejazi. Division of Biostatistics University of California, Berkeley stat.berkeley.edu/~nhejazi. nimahejazi.org github/nhejazi
 Data-Adaptive Estimation and Inference in the Analysis of Differential Methylation for the annual retreat of the Center for Computational Biology, given 18 November 2017 Nima Hejazi Division of Biostatistics
Combining P values to improve classification of differential gene expression in the HTself software
 Combining P values to improve classification of differential gene expression in the HTself software D.A. Cortez 1, A.P. Tonon 2, P. Colepicolo 2 and R.Z.N. Vêncio 3 1 Departamento de Ciências da Computação,
Real-time RT PCR. for identification of differentially expressed genes. (with Schizophrenia application) Rolf Sundberg, Stockholm Univ.
 Rolf Sundberg, Stockholm Univ.") Real-time RT PCR for identification of differentially expressed genes. (with Schizophrenia application) Rolf Sundberg, Stockholm Univ. Göteborg, May 2006 Real-time PCR for mrna quantitation Review paper
Real-time RT PCR for identification of differentially expressed genes. (with Schizophrenia application) Rolf Sundberg, Stockholm Univ. Göteborg, May 2006 Real-time PCR for mrna quantitation Review paper
Experimental Design Day 2
 Experimental Design Day 2 Experiment Graphics Exploratory Data Analysis Final analytic approach Experiments with a Single Factor Example: Determine the effects of temperature on process yields Case I:
QTL mapping in mice. Karl W Broman. Department of Biostatistics Johns Hopkins University Baltimore, Maryland, USA.
 QTL mapping in mice Karl W Broman Department of Biostatistics Johns Hopkins University Baltimore, Maryland, USA www.biostat.jhsph.edu/ kbroman Outline Experiments, data, and goals Models ANOVA at marker
How to use ANOVA in Qlucore Omics Explorer
 How to use ANOVA in Qlucore Omics Explorer Content 1 Introduction... 3 2 Introduction to ANOVA... 3 2.1 Model A: Independent measures, single factor design... 3 2.2 Model B: Independent measures, factorial
6. GENE EXPRESSION ANALYSIS MICROARRAYS
 6. GENE EXPRESSION ANALYSIS MICROARRAYS BIOINFORMATICS COURSE MTAT.03.239 16.10.2013 GENE EXPRESSION ANALYSIS MICROARRAYS Slides adapted from Konstantin Tretyakov s 2011/2012 and Priit Adlers 2010/2011
A Protein Secondary Structure Prediction Method Based on BP Neural Network Ru-xi YIN, Li-zhen LIU*, Wei SONG, Xin-lei ZHAO and Chao DU
 2017 2nd International Conference on Artificial Intelligence: Techniques and Applications (AITA 2017 ISBN: 978-1-60595-491-2 A Protein Secondary Structure Prediction Method Based on BP Neural Network Ru-xi
Introduction to microarrays. Overview The analysis process Limitations Extensions (NGS)
") Introduction to microarrays Overview The analysis process Limitations Extensions (NGS) Outline An overview (a review) of microarrays Experiments with microarrays The data analysis process Microarray limitations
Introduction to microarrays Overview The analysis process Limitations Extensions (NGS) Outline An overview (a review) of microarrays Experiments with microarrays The data analysis process Microarray limitations
Multivariate Methods to detecting co-related trends in data
 Multivariate Methods to detecting co-related trends in data Canonical correlation analysis Partial least squares Co-inertia analysis Classical CCA and PLS require n>p. Can apply Penalized CCA and sparse
Whole Transcriptome Analysis of Illumina RNA- Seq Data. Ryan Peters Field Application Specialist
 Whole Transcriptome Analysis of Illumina RNA- Seq Data Ryan Peters Field Application Specialist Partek GS in your NGS Pipeline Your Start-to-Finish Solution for Analysis of Next Generation Sequencing Data