Supplementary Figures
|
|
|
- Bennett Walters
- 6 years ago
- Views:
Transcription
1 Supplementary Figures 1
2 Supplementary Figure 1. Analyses of present-day population differentiation. (A, B) Enrichment of strongly differentiated genic alleles for all present-day population comparisons using all European and East Asian populations versus (A) YRI or (B) LWK. The bootstrap 95% confidence interval is shown in yellow, and the level of significance of the bias in genic enrichment when comparing the two tails is shown on top (* < 0.05, ** < 0.01, and *** < 0.001, and NS for non-significant). The number of genic SNPs in each tail is also shown. 2
3 Supplementary Figure 2. Analyses of present-day population differentiation using F ST. F ST 1, a measure of population differentiation, was calculated for all SNPs variable in the comparison between (A) CHB and YRI or (B) GBR and YRI. The genic enrichment was calculated as in Figure 1. The number of sites in the far tail of the F ST distribution (>0.8) is shown on top, and the bootstrap 95% confidence interval is shown in yellow. 3
4 4
5 Supplementary Figure 3. Analyses of present-day population differentiation using weighted block jackknife. (A, B) Enrichment of strongly differentiated genic alleles for all present-day population comparisons using all European and East Asian populations versus (A) YRI or (B) LWK. The 95% confidence interval is shown in yellow based on a weighted block jackknife with 200kb genomic blocks. The level of significance of the bias in genic enrichment when comparing the two tails is shown on top (* < 0.05, ** < 0.01, and *** < 0.001, and NS for non-significant). The number of genic SNPs in each tail is also shown. 5
6 Supplementary Figure 4. Expectations under background selection alone. Expectation of genic enrichment in the absence of adaptive forces but with growing strengths of background selection (measured by lower B scores), based on coalescent simulations in the absence of positive selection for (A) East Asian and (B) European demography. See Methods about the use of 0.8 and 0.9 as B scores. 6
7 Supplementary Figure 5. Genic enrichment in other East Asian populations. Results of the enrichment analysis for the DAnc (YRI, P 2, Ust - Ishim) analysis with (A) JPT or (B) CHS as P 2. The bootstrap 95% confidence interval is shown in yellow, and the level of significance of the bias in genic enrichment when comparing the two tails is shown on top (* < 0.05, ** < 0.01, and *** < 0.001, and NS for non-significant). The number of genic alleles in the tails is also shown. 7
8 Supplementary Figure 6. Genic enrichment in East Asian populations using weighted block jackknife. Results of the enrichment analysis for the DAnc (YRI, P 2, Ust -Ishim) analysis with CHB, CHS or JPT as P 2. The 95% confidence interval is shown in yellow based on a weighted block jackknife with 200kb genomic blocks. The level of significance of the bias in genic enrichment when comparing the two tails is shown on top (* < 0.05, ** < 0.01, and *** < 0.001, and NS for non-significant). The number of genic alleles in the tails is also shown. 8
9 Supplementary Figure 7. Demographic parameters used for the simulations. The demographic parameters used for the simulations of present-day human populations are based on Gravel et al. 2 ; parameters that we varied in different sets of simulations are marked in red (see Methods). (A) The demographic model used for simulations that includes the Ust -Ishim population and sampling of the Ust -Ishim genome. The Ust -Ishim population is introduced in the Gravel 2 model following the model proposed by Fu et al. 3. (B) The demographic model used for simulations that include the Ust -Ishim and ancient European populations, and the sampling of Ust -Ishim, a farmer (Stuttgart) and a hunter-gatherer (Loschbour). The ancient European populations were introduced in the Gravel 4 model following the model proposed by Lazaridis et al. 5. Farmer and Basal Eurasian populations merge with proportions 56% / 44% 5. Farmer and Hunter-Gatherer populations merge with proportion 50% / 50%. These proportions likely vary across European populations, but the DAnc European pattern observed is consistent across European populations (GBR, FIN, TSI, CEU). g stands for generations (25yrs). 9
10 Supplementary Figure 8. Genic enrichment in other European populations. Results of the enrichment analysis for the DAnc (YRI, P 2, Ust - Ishim) analysis with (A) FIN, (B) TSI, or (C) CEU as P 2. The bootstrap 95% confidence interval is shown in yellow, and the level of significance of the bias in genic enrichment when comparing the two tails is shown on top (* < 0.05, ** < 0.01, and *** < 0.001, and NS for non-significant). The number of genic alleles in the tails is also shown. 10
11 Supplementary Figure 9. Genic enrichment in European populations using weighted block jackknife. Results of the enrichment analysis for the DAnc (YRI, P 2, Ust -Ishim) analysis with GBR, FIN, CEU or TSI as P 2. The 95% confidence interval is shown in yellow based on a weighted block jackknife with 200kb genomic blocks. The level of significance of the bias in genic enrichment when comparing the two tails is shown on top (* < 0.05, ** < 0.01, and *** < 0.001, and NS for non-significant). The number of genic alleles in the tails is also shown. The enrichment in genic alleles in significantly stronger in the European tail for all populations except TSI, which has been inferred to have low levels of hunter-gatherer ancestry 6,7. Our results show that this ancestral component is relevant to this analysis (discussed in detail in the Highly differentiated alleles in ancient Europeans section of the main text). 11
12 Supplementary Figure 10. Genic enrichment in European populations versus YRI or LWK using only sites with higher derived allele frequency in the European population. Results of the enrichment analysis for DAnc (P 1, P 2, Ust -Ishim) analysis with (A-D) YRI and (E-H) LWK as P 1, and (A,E) GBR, (B,F), FIN, (C,G) TSI, or (D,H) CEU as P 2. The bootstrap 95% confidence interval is shown in yellow, and the level of significance of the bias in genic enrichment when comparing the two tails is shown on top (* < 0.05, ** < 0.01, and *** < 0.001, and NS for non-significant). The number of genic alleles in the tails is also shown. 12
13 Supplementary Figure 11. Genic enrichment in European populations versus LWK (Luhya, East Africa). Results of the enrichment analysis for DAnc (LWK, P 2, Ust -Ishim) analysis with (A, E) GBR, (B, F), FIN, (C, G) TSI, or (D, H) CEU as P 2. In yellow (A-D) shows the bootstrap 95% confidence interval and (E-H) the 95% confidence interval based on a weighted block jackknife with 200kb genomic blocks. The level of significance of the bias in genic enrichment when comparing the two tails is shown on top (* < 0.05, ** < 0.01, and *** < 0.001, and NS for non-significant). The number of genic alleles in the tails is also shown. 13
14 Supplementary Figure 12. Effects of variation in Ust -Ishim Ne for nonadaptive simulations. Enrichment analyses with background selection (measured by B scores) and without background selection (B = 1) under our (A, C) East Asian or (B, D) European demographic model with (A, C) Ust - Ishim Ne=186, or (B, D) Ust -Ishim Ne=
15 Supplementary Figure 13. Expectations under background selection alone for more complex European demography. Expectation of genic enrichment using DAnc in the absence of adaptive forces but with growing strengths of background selection (measured by lower B scores), based on coalescent simulations without positive selection for European demography (including basal Eurasian, hunter-gatherer and farmer populations, see Figure 2B, Supplementary Fig. 7 and Methods). See Methods about the use of 0.8 and 0.9 as B scores. 15
16 16
17 Supplementary Figure 14. DAnc analysis using low coverage Ust -Ishim (1.6X). Genic enrichment in alleles in different bins of the DAnc statistic (P 1, P 2, Ust -Ishim). (A) P 1 is YRI and P 2 all European populations, (B) P 1 is YRI and P 2 all East Asian populations, (C) P 1 is LWK and P 2 all European populations, and (D) P 1 is LWK and P 2 all East Asian populations. The bootstrap 95% confidence interval is shown in yellow, and the level of significance of the bias in genic enrichment when comparing the two tails is shown on top (* < 0.05, ** < 0.01, and *** < 0.001, and NS for non-significant). The number of genic sites in each tail is on top of the tails. See methods for details on the low-coverage Ust -Ishim genotypes. 17
 or Stuttgart (STG) among those in the tails of the DAnc (YRI, P 2, Ust -Ishim) distribution using (A) FIN, (B) TSI, and (C) CEU as P 2.")
18 Supplementary Figure 15. Presence in ancient European genomes of the high-frequency European allele in alleles in the DAnc European and African tail. Proportion of European alleles present in Loschbour (LB) or Stuttgart (STG) among those in the tails of the DAnc (YRI, P 2, Ust -Ishim) distribution using (A) FIN, (B) TSI, and (C) CEU as P 2. The bootstrap 95% confidence interval is shown and asterisks indicate significant differences between LB and STG (* < 0.05, ** < 0.01, and *** < 0.001). GBR is presented in Figure 4A. 18

19 Supplementary Figure 16. Presence in ancient European genomes of the high-frequency European allele in alleles in the DAnc European and African tail (using only sites where the derived allele reached high frequency in Europe). Proportion of European alleles present in Loschbour (LB) or Stuttgart (STG) among those in the tails of the DAnc (YRI, P 2, Ust - Ishim) distribution using (A) GBR, (B) FIN, (C) TSI, and (D) CEU as P 2. The bootstrap 95% confidence interval is shown and asterisks indicate significant differences between LB and STG (* < 0.05, ** < 0.01, and *** < 0.001). 19
20 Supplementary Figure 17. Presence in ancient European genomes of the high-frequency European allele in alleles in the DAnc European and African tail (using only transversions). Proportion of European alleles present in Loschbour (LB) or Stuttgart (STG) among those in the tails of the DAnc (YRI, P 2, Ust -Ishim) distribution using (A) GBR, (B) FIN, (C) TSI, and (D) CEU as P 2. The bootstrap 95% confidence interval is shown and asterisks indicate significant differences between LB and STG (* < 0.05, ** < 0.01, and *** < 0.001). 20
21 Supplementary Figure 18. Presence in ancient European genomes of the high-frequency European allele in alleles in the DAnc European and African tail (using only sites that are homozygous in the ancient European genomes). Proportion of European alleles present in Loschbour (LB) or Stuttgart (STG) among those in the tails of the DAnc (YRI, P 2, Ust - Ishim) distribution using (A) GBR, (B) FIN, (C) TSI, and (D) CEU as P 2. The bootstrap 95% confidence interval is shown and asterisks indicate significant differences between LB and STG (* < 0.05, ** < 0.01, and *** < 0.001). 21
22 22
23 Supplementary Figure 19. Principal component analysis of present-day human populations and ancient genomes (Ust - Ishim, Loschbour, Stuttgart). PCA of all alleles in the African and European tail of the DAnc (YRI, P 2, Ust -Ishim) distribution for (A) GBR, (B) FIN, (C) TSI, and (D) CEU as P 2. The present-day populations are color-coded and the ancient Ust -Ishim, Loschbour, and Stuttgart samples are projected into the present-day human dataset. The PCA is based on the pairwise allele sharing distances 8 among the present-day humans and a principal components analysis (PCA) on the resulting pairwise distance matrix, with projected genotyping calls from the ancient samples onto the PCA using SMARTPCA 9. 23
24 Supplementary Figure 20. Inference of Ne in Loschbour. For each putative Ne of Loschbour (steps of 50) we ran 100,000 simulations under our (otherwise) demographic model. The red curve shows the mean heterozygosity (H), the yellow area the 95% confidence interval of H, and the dashed lines the minimum and maximum H values from these simulations for Loschbour. The dotted horizontal line indicates the observed H (mlrho) in the real data 5 and the vertical line the intercept with the simulated H. 24
25 Supplementary Figure 21. Inference of Ne in Stuttgart using different Ne in the basal Eurasian population (Ne equals 186, 1860, or 18600). For each putative Ne of Stuttgart (steps of 50) we ran 100,000 simulations under our (otherwise) demographic model. The blue curve shows the mean heterozygosity (H), the light blue area the 95% confidence interval of H, and the dashed lines the minimum and maximum H values from these simulations for Stuttgart. The dotted horizontal line indicates the observed ratio of transversions (H STG / H LB = 1.19) in the real data and the vertical line its intercept with the simulated H STG / H LB ratio. 25
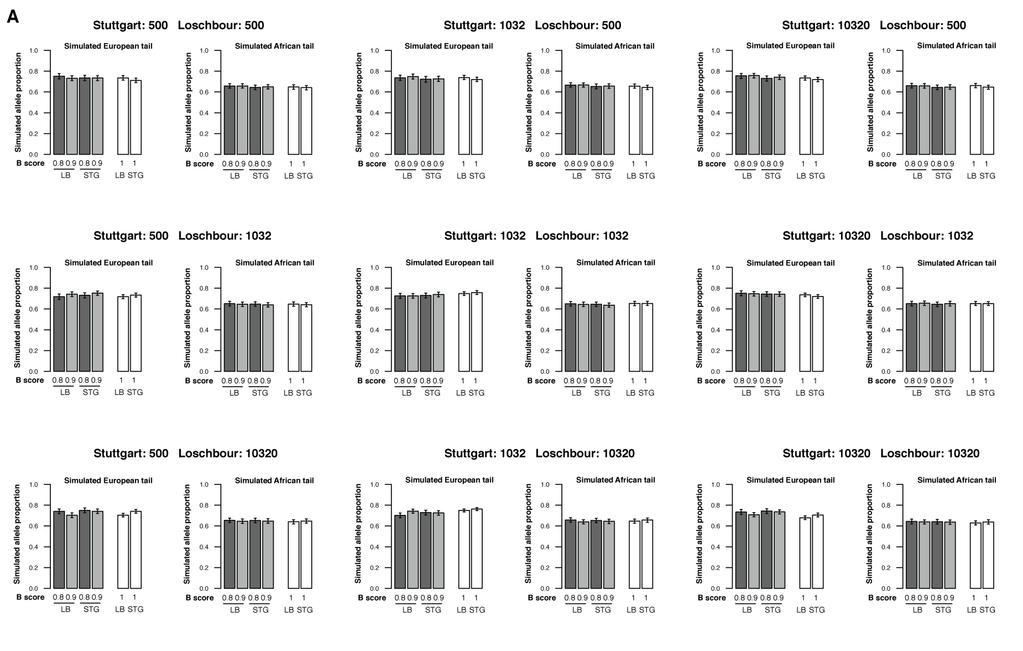
 and Stuttgart (STG) for alleles in the (A, C) European and the (B, D) African tail of the")
26 Supplementary Figure 22. Expectation of the proportion of the highfrequency European alleles in Loschbour (LB) and Stuttgart (STG) for alleles in the (A, C) European and the (B, D) African tail of the DAnc analysis, when the Ne of the basal Eurasian population is (A, B) 186 or (C, D) 18,600. The bootstrap 95% confidence interval shown is obtained. 26
27 27
 500 and (B) 1860. For each, we ran simulations with a range of Ne for Loschbour and Stuttgart (500, 1032, 10320 respectively).")
28 Supplementary Figure 23. Expectation of the proportion of the high-frequency European alleles under more extreme Ne values in ancient European populations. The Ne of the Basal Eurasians is set to (A) 500 and (B) For each, we ran simulations with a range of Ne for Loschbour and Stuttgart (500, 1032, respectively). The bootstrap 95% confidence interval is shown. One single simulation set is significant, but an enrichment of only 5.4% (much lower than the average 9.7% in real data). 28
29 Supplementary Figure 24. Principal component analysis of present-day human populations and ancient genomes (Ust -Ishim, Loschbour, Stuttgart, NE1). The present-day populations are color-coded and the ancient Ust -Ishim, Loschbour, Stuttgart, and NE1 genomes are projected into the present-day human dataset. PCA s are shown for all genic and non-genic SNPs as well as the genic and non-genic DAnc European tails. The variance explained by PC1 and PC2 is indicated in the axis labels. The PCA is based on the pairwise allele sharing distances 8 among the present-day humans and a principal components analysis (PCA) on the resulting pairwise distance matrix, with projected genotyping calls from the ancient samples onto the PCA using SMARTPCA 9. 29
 or NE1 among those in the tails of the DAnc (YRI, P 2, Ust -Ishim) distribution using (A) GBR, (B) FIN, (C) TSI, and (D) CEU as P 2.")
30 Supplementary Figure 25. Presence in ancient European genomes of the high-frequency European allele in alleles in the DAnc European and African tail. Proportion of European alleles present in Loschbour (LB) or NE1 among those in the tails of the DAnc (YRI, P 2, Ust -Ishim) distribution using (A) GBR, (B) FIN, (C) TSI, and (D) CEU as P 2. The bootstrap 95% confidence interval is shown and asterisks indicate significant differences between LB and NE1 (* < 0.05, ** < 0.01, and *** < 0.001). 30
31 Supplementary Figure 26. Genome-wide distribution of B scores based on McVicker et al. 31
32 Supplementary Figure 27. Results of the enrichment analysis for DAnc(YRI, CHB, UI) and DAnc(YRI, GBR, UI) using the original genic and non-genic annotation. The non-genic category was downsampled to match the number of variants in the genic category (8,169,486 variants). The bootstrapped 95% confidence interval is shown in yellow, and the level of significance of the bias in genic enrichment when comparing the two tails is shown on top (* < 0.05, ** < 0.01, and *** < 0.001, and NS for non-significant). The number of genic sites in each tail is on top of the tails. 32
33 Supplementary Figure 28. Results of the enrichment analysis for DAnc(YRI, CHB, UI) and DAnc(YRI, GBR, UI) using as annotation synonymous and nonsynonymous variants. The bootstrapped 95% confidence interval is shown in yellow, and the level of significance of the bias in genic enrichment when comparing the two tails is shown on top (* < 0.05, ** < 0.01, and *** < 0.001, and NS for non-significant). The number of genic sites in each tail is on top of the tails. 33
34 Supplementary Figure 29. Results of the enrichment analysis for DAnc(YRI, CHB, UI) and DAnc(YRI, GBR, UI) using as annotation conserved (phastcons > 0.9) and non-conserved (phastcons < 0.1) variants. The non-conserved category was downsampled to match the number of variants in the conserved category (516,448 variants). The bootstrapped 95% confidence interval is shown in yellow, and the level of significance of the bias in conserved enrichment when comparing the two tails is shown on top (* < 0.05, ** < 0.01, and *** < 0.001, and NS for non-significant). The number of conserved sites in each tail is on top of the tails. 34
35 Supplementary Figure 30. Results of the enrichment analysis for DAnc(YRI, CHB, UI) and DAnc(YRI, GBR, UI) using as annotation putatively regulatory sites (regulomedb category 1) and putatively non-regulatory sites (regulomedb category 7). The non-regulatory category was downsampled to match the number of variants in the regulatory category (28,452). The bootstrapped 95% confidence interval is shown in yellow, and the level of significance of the bias in regulatory enrichment when comparing the two tails is shown on top (* < 0.05, ** < 0.01, and *** < 0.001, and NS for nonsignificant). The number of regulatory sites in each tail is on top of the tails. Enrichment is shown per bin only when at least four variants are present in both annotations, CI is calculated regardless. 35
36 Supplementary Figure 31. Results of the enrichment analysis for (A & C) DAnc(YRI, CHB, UI) and (B & D) DAnc(YRI, GBR, UI) using as annotation putatively regulatory sites (regulomedb category 1) and putatively nonregulatory sites (regulomedb category 7). The analysis was run separately for variants that are also in the (A & B) genic category and (C & D) in the nongenic category of the genic/non-genic annotation. All analyses were downsampled to match the number of variants in the regulatory-genic category (21,957 variants). The bootstrapped 95% confidence interval is shown in yellow, and the level of significance of the bias in regulatory-genic enrichment when comparing the two tails is shown on top (* < 0.05, ** < 0.01, and *** < 0.001, and NS for non-significant). The number of regulatory-genic sites in each tail is on top of the tails. Enrichment is shown per bin only when at least four variants are present in both annotations, CI is calculated regardless. 36
37 Supplementary Tables 1 P1 P2 P3 P4 D value Z score BABA 1 ABBA 2 # SNPs 3 NE1 Stuttgart Loschbour YRI NE1 Stuttgart CEU YRI NE1 Stuttgart FIN YRI NE1 Stuttgart GBR YRI NE1 Stuttgart TSI YRI Supplementary Table 1. D statistics for ancient European genomes and present-day European populations. Linked sites were removed using plink (--indep-pairwise ). A Z score >1.96 or <1.96 indicates significance of the D value on the 95% level. 1 Describes allele sharing of P1 with P3. 2 Describes allele sharing of P2 with P3. 3 Total number of SNPs used. 37
38 Set # SNPs reduced background complete background European tail Stuttgart specific 37 - helicase_activity (0.046) pyrophosphatase_activity (0.048) hydrolase_activity,_acting_on_acid_anhydrides,_in_phosphoruscontaining_anhydrides (0.048) Loschbour specific 55 melanosome_membrane (0.003) melanosome_membrane (0.004) Supplementary Table 2. Enrichment of gene ontology categories. Genes intersecting with alleles in the European DAnc (YRI, P 2, Ust -Ishim) tails (P 2 : GBR, FIN, TSI, or CEU) and that are found exclusively in one of the two ancient Europeans (exclusively in Stuttgart or in Loschbour). Results are shown for the reduced background (random 100,000 alleles) and the complete background (all alleles), with P-values in parenthesis. 38
39 Supplementary Notes Supplementary Note 1. DAnc analysis using annotation based on protein-changing, putative regulatory role, or conservation. Different annotations of the genome-wide data were used in the DAnc analysis. To capture potential different aspects of phenotypic relevant variation we used the following annotations: - Nonsynonymous / Synonymous - conserved / non-conserved (phastcons > 0.9 / phastcons < 0.1) - regulatory / non-regulatory (ENCODE: regulomedb category 1 / regulomedb category 7); RegulomeDB 12 incorporates ENCODE and other sources of regulatory information on variants. It classifies variants into seven categories based on the amount of evidence for a regulatory role. Variants in category 1 show multiple evidences for regulatory effects, while variants in category 7 show none. We performed the DAnc analysis for each annotation using YRI as P 1 and GBR (European) or CHB (East Asian) as P 2,. although we note that the low number of variants makes many of these analyses quite noisy. The regulomedb and phastcons analyses have very different number of variants in their two categories (conserved 516,448 vs. non-conserved 15,422,612; regulatory 28,452 vs. non-regulatory 3,925,604). To avoid an effecting of these differences the DAnc analysis we downsampled, in each annotation, the category with the larger number of variants to match the category with the lowest number of variants (516,448 for the conservation annotation and 28,452 variants for the regulatory annotation). The downsampling has no impact on our original DAnc analysis (Supplementary Fig. 27). There is no enrichment in the DAnc tails for the protein-changing annotation (Supplementary Fig. 28, likely due to low number of variants) or for the conservation annotation (Supplementary Fig. 29). Only the regulomedb DAnc analysis (Supplementary Fig. 30) shows significant enrichment of putatively functional alleles (regulatory variants) over putatively non-functional ones (non-regulatory variants) in the DAnc tails. The enrichment is significant in all tails, even though it lacks sufficient non-functional alleles in both tails of the DAnc(YRI, GBR, UI) analysis. Nevertheless, when we combine both annotations (genic/non-genic with regulomedb category 1/7) it becomes clear that the enrichment in alleles in the regulatory category is largely due to alleles in the genic annotation (Supplementary Fig. 31), suggesting a regulatory role for the strongly differentiated alleles in the DAnc tails. 39
40 Supplementary Note 2. Analyzing a second European Farmer NE1. Gamba et al. 13 recently presented the high-coverage genome (22X) of a ~7,000 years old Hungarian Farmer (NE1). This sample was treated differently than Ust -Ishim, Loschbour and Stuttgart (e.g. it was not UDG treated and it likely contains more ancient DNA damage) and no estimate of autosomal contamination is available. Direct comparisons with the other genomes must thus be cautious, but NE1 allows us to explore again the signatures observed in the Stuttgart farmer. Dr. Gamba kindly shared the filtered BAM file of NE1, which we used to call genotypes following the methods section in 13. In genome-wide PCA analysis the Stuttgart and NE1 farmers fall together (Supplementary Fig. 24). Also, D statistics show that the two farmers are equally close to present-day European populations (Supplementary Table 3), indicating a similar contribution from their populations to modern Europeans. Nevertheless when the three ancient samples are considered Loschbour is closer to NE1 than to Stuttgart (Supplementary Table 3), although the 1.93 Z-score is not significant under a significance threshold of 95% (+-1.96). This is consistent with some level of gene flow between the Loschbour and NE1 populations. When we investigate the genic European DAnc tail NE1 tends to contain, like Stuttgart, fewer alleles from the European tail than Loschbour. But the difference between NE1 and Loschbour is weak and not significant. (Supplementary Fig. 25). In fact, a PCA using only SNPs in the European DAnc tail shows Loschbour being closer to NE1 than to Stuttgart (Supplementary Fig. 24). Together these analyses suggest that although at the genome level the two farmers are very similar, NE1 already contained, perhaps by gene flow from hunter-gatherers, some of the highly differentiated European alleles that are absent in the Stuttgart genome. 40
41 Supplementary References 1. Weir, B. S. & Cockerham, C. C. Estimating F-Statistics for the Analysis of Population Structure. Evolution 38, 1358 (1984). 2. Gravel, S., Henn, B. M., Gutenkunst, R. N., Indap, A. R., et al. Demographic history and rare allele sharing among human populations. Proceedings of the National Academy of Sciences 108, (2011). 3. Fu, Q., Li, H., Moorjani, P., Jay, F., et al. Genome sequence of a 45,000- year-old modern human from western Siberia. Nature 514, (2014). 4. Gravel, S., Henn, B. M., Gutenkunst, R. N., Indap, A. R., et al. Demographic history and rare allele sharing among human populations. Proceedings of the National Academy of Sciences 108, (2011). 5. Lazaridis, I., Patterson, N., Mittnik, A., Renaud, G., et al. Ancient human genomes suggest three ancestral populations for present-day Europeans. Nature 513, 409 (2014). 6. Haak, W., Lazaridis, I., Patterson, N., Rohland, N., et al. Massive migration from the steppe was a source for Indo-European languages in Europe. Nature 522, (2015). 7. Mathieson, I., Lazaridis, I., Rohland, N., Mallick, S., et al. Genome-wide patterns of selection in 230 ancient Eurasians. Nature (2015). 8. Cavalli-Sforza, L. L. Genetic and Cultural Diversity in Europe. Journal of Anthropological Research 53, (1997). 9. Patterson, N., Price, A. L. & Reich, D. Population structure and eigenanalysis. (2006). 10. McVicker, G., Gordon, D., Davis, C. & Green, P. Widespread Genomic Signatures of Natural Selection in Hominid Evolution. PLoS Genet 5, e (2009). 11. Meyer, M., Kircher, M., Gansauge, M. -T., Li, H., et al. A high-coverage genome sequence from an archaic Denisovan individual. Science 338, (2012). 12. Boyle, A. P., Hong, E. L., Hariharan, M., Cheng, Y., et al. Annotation of functional variation in personal genomes using RegulomeDB. Genome Research 22, (2012). 13. Gamba, C., Jones, E. R., Teasdale, M. D., McLaughlin, R. L., et al. Genome flux and stasis in a five millennium transect of European prehistory. Nature Communications 5, (2014). 41
REPORT. Complex History of Admixture between Modern Humans and Neandertals. Benjamin Vernot 1, * and Joshua M. Akey 1, *
 REPORT Complex History of Admixture between Modern Humans and Neandertals Benjamin Vernot 1, * and Joshua M. Akey 1, * Recent analyses have found that a substantial amount of the Neandertal genome persists
Supporting Information
 Supporting Information Eriksson and Manica 10.1073/pnas.1200567109 SI Text Analyses of Candidate Regions for Gene Flow from Neanderthals. The original publication of the draft Neanderthal genome (1) included
Population description. 103 CHB Han Chinese in Beijing, China East Asian EAS. 104 JPT Japanese in Tokyo, Japan East Asian EAS
 1 Supplementary Table 1 Description of the 1000 Genomes Project Phase 3 representing 2504 individuals from 26 different global populations that are assigned to five super-populations Number of individuals
Population differentiation analysis of 54,734 European Americans reveals independent evolution of ADH1B gene in Europe and East Asia
 Population differentiation analysis of 54,734 European Americans reveals independent evolution of ADH1B gene in Europe and East Asia Kevin Galinsky Harvard T. H. Chan School of Public Health American Society
Supplementary Methods 2. Supplementary Table 1: Bottleneck modeling estimates 5
 Supplementary Information Accelerated genetic drift on chromosome X during the human dispersal out of Africa Keinan A, Mullikin JC, Patterson N, and Reich D Supplementary Methods 2 Supplementary Table
Supplementary Note: Detecting population structure in rare variant data
 Supplementary Note: Detecting population structure in rare variant data Inferring ancestry from genetic data is a common problem in both population and medical genetic studies, and many methods exist to
Nature Genetics: doi: /ng Supplementary Figure 1. Neighbor-joining tree of the 183 wild, cultivated, and weedy rice accessions.
 Supplementary Figure 1 Neighbor-joining tree of the 183 wild, cultivated, and weedy rice accessions. Relationships of cultivated and wild rice correspond to previously observed relationships 40. Wild rice
Detecting ancient admixture using DNA sequence data
 Detecting ancient admixture using DNA sequence data October 10, 2008 Jeff Wall Institute for Human Genetics UCSF Background Origin of genus Homo 2 2.5 Mya Out of Africa (part I)?? 1.6 1.8 Mya Further spread
ARTICLE Contrasting X-Linked and Autosomal Diversity across 14 Human Populations
 ARTICLE Contrasting X-Linked and Autosomal Diversity across 14 Human Populations Leonardo Arbiza, 1,2 Srikanth Gottipati, 1,2 Adam Siepel, 1 and Alon Keinan 1, * Contrasting the genetic diversity of the
Genotype quality control with plinkqc Hannah Meyer
 Genotype quality control with plinkqc Hannah Meyer 219-3-1 Contents Introduction 1 Per-individual quality control....................................... 2 Per-marker quality control.........................................
Haplotypes, linkage disequilibrium, and the HapMap
 Haplotypes, linkage disequilibrium, and the HapMap Jeffrey Barrett Boulder, 2009 LD & HapMap Boulder, 2009 1 / 29 Outline 1 Haplotypes 2 Linkage disequilibrium 3 HapMap 4 Tag SNPs LD & HapMap Boulder,
Nature Biotechnology: doi: /nbt Supplementary Figure 1. Number and length distributions of the inferred fosmids.
 Supplementary Figure 1 Number and length distributions of the inferred fosmids. Fosmid were inferred by mapping each pool s sequence reads to hg19. We retained only those reads that mapped to within a
Human Population Differentiation is Strongly Correlated With Local Recombination Rate
 Human Population Differentiation is Strongly Correlated With Local Recombination Rate The Harvard community has made this article openly available. Please share how this access benefits you. Your story
Nature Genetics: doi: /ng.3254
 Supplementary Figure 1 Comparing the inferred histories of the stairway plot and the PSMC method using simulated samples based on five models. (a) PSMC sim-1 model. (b) PSMC sim-2 model. (c) PSMC sim-3
Robust Prediction of Expression Differences among Human Individuals Using Only Genotype Information
 Robust Prediction of Expression Differences among Human Individuals Using Only Genotype Information Ohad Manor 1,2, Eran Segal 1,2 * 1 Department of Computer Science and Applied Mathematics, Weizmann Institute
Human Populations: History and Structure
 Human Populations: History and Structure In the paper Novembre J, Johnson, Bryc K, Kutalik Z, Boyko AR, Auton A, Indap A, King KS, Bergmann A, Nelson MB, Stephens M, Bustamante CD. 2008. Genes mirror geography
SUPPLEMENTARY INFORMATION
 doi:10.1038/nature17405 Supplementary Information 1 Determining a suitable lower size-cutoff for sequence alignments to the nuclear genome Analyses of nuclear DNA sequences from archaic genomes have until
Analysing Alu inserts detected from high-throughput sequencing data
 Analysing Alu inserts detected from high-throughput sequencing data Harun Mustafa Mentor: Matei David Supervisor: Michael Brudno July 3, 2013 Before we begin... Even though I'll only present the minimal
Personal and population genomics of human regulatory variation
 Personal and population genomics of human regulatory variation Benjamin Vernot,, and Joshua M. Akey Department of Genome Sciences, University of Washington, Seattle, Washington 98195, USA Ting WANG 1 Brief
Fossils From Vindija Cave, Croatia (38 44 kya) Admixture between Archaic and Modern Humans
 Admixture between Archaic and Modern Humans") Fossils From Vindija Cave, Croatia (38 44 kya) Admixture between Archaic and Modern Humans Alan R Rogers February 12, 2018 1 / 63 2 / 63 Hominin tooth from Denisova Cave, Altai Mtns, southern Siberia (41
Fossils From Vindija Cave, Croatia (38 44 kya) Admixture between Archaic and Modern Humans Alan R Rogers February 12, 2018 1 / 63 2 / 63 Hominin tooth from Denisova Cave, Altai Mtns, southern Siberia (41
Further confirmation for unknown archaic ancestry in Andaman and South Asia.
 Further confirmation for unknown archaic ancestry in Andaman and South Asia. Mayukh Mondal 1, Ferran Casals 2, Partha P. Majumder 3, Jaume Bertranpetit 1 1 Institut de Biologia Evolutiva (UPF-CSIC), Universitat
Introduction to Add Health GWAS Data Part I. Christy Avery Department of Epidemiology University of North Carolina at Chapel Hill
 Introduction to Add Health GWAS Data Part I Christy Avery Department of Epidemiology University of North Carolina at Chapel Hill Outline Introduction to genome-wide association studies (GWAS) Research
Linkage Disequilibrium. Adele Crane & Angela Taravella
 Linkage Disequilibrium Adele Crane & Angela Taravella Overview Introduction to linkage disequilibrium (LD) Measuring LD Genetic & demographic factors shaping LD Model predictions and expected LD decay
S G. Design and Analysis of Genetic Association Studies. ection. tatistical. enetics
 S G ection ON tatistical enetics Design and Analysis of Genetic Association Studies Hemant K Tiwari, Ph.D. Professor & Head Section on Statistical Genetics Department of Biostatistics School of Public
De novo human genome assemblies reveal spectrum of alternative haplotypes in diverse
 SUPPLEMENTARY INFORMATION De novo human genome assemblies reveal spectrum of alternative haplotypes in diverse populations Wong et al. The Supplementary Information contains 4 Supplementary Figures, 3
Human Population Differentiation Is Strongly Correlated with Local Recombination Rate
 Human Population Differentiation Is Strongly Correlated with Local Recombination Rate Alon Keinan 1,2,3 *, David Reich 1,2 1 Department of Genetics, Harvard Medical School, Boston, Massachusetts, United
Supplementary information ATLAS
 Supplementary information ATLAS Vivian Link, Athanasios Kousathanas, Krishna Veeramah, Christian Sell, Amelie Scheu and Daniel Wegmann Section 1: Complete list of functionalities Sequence data processing
The Whole Genome TagSNP Selection and Transferability Among HapMap Populations. Reedik Magi, Lauris Kaplinski, and Maido Remm
 The Whole Genome TagSNP Selection and Transferability Among HapMap Populations Reedik Magi, Lauris Kaplinski, and Maido Remm Pacific Symposium on Biocomputing 11:535-543(2006) THE WHOLE GENOME TAGSNP SELECTION
Supplementary Figure 1. Study design of a multi-stage GWAS of gout.
 Supplementary Figure 1. Study design of a multi-stage GWAS of gout. Supplementary Figure 2. Plot of the first two principal components from the analysis of the genome-wide study (after QC) combined with
Association Mapping in Plants PLSC 731 Plant Molecular Genetics Phil McClean April, 2010
 Association Mapping in Plants PLSC 731 Plant Molecular Genetics Phil McClean April, 2010 Traditional QTL approach Uses standard bi-parental mapping populations o F2 or RI These have a limited number of
Themes. Homo erectus. Jin and Su, Nature Reviews Genetics (2000)
") HC70A & SAS70A Winter 2009 Genetic Engineering in Medicine, Agriculture, and Law Tracking Human Ancestry Professor John Novembre Themes Global patterns of human genetic diversity Tracing our ancient ancestry
HC70A & SAS70A Winter 2009 Genetic Engineering in Medicine, Agriculture, and Law Tracking Human Ancestry Professor John Novembre Themes Global patterns of human genetic diversity Tracing our ancient ancestry
Petar Pajic 1 *, Yen Lung Lin 1 *, Duo Xu 1, Omer Gokcumen 1 Department of Biological Sciences, University at Buffalo, Buffalo, NY.
 The psoriasis associated deletion of late cornified envelope genes LCE3B and LCE3C has been maintained under balancing selection since Human Denisovan divergence Petar Pajic 1 *, Yen Lung Lin 1 *, Duo
Resources at HapMap.Org
 Resources at HapMap.Org HapMap Phase II Dataset Release #21a, January 2007 (NCBI build 35) 3.8 M genotyped SNPs => 1 SNP/700 bp # polymorphic SNPs/kb in consensus dataset International HapMap Consortium
Macmillan Publishers Limited. All rights reserved
 LETTER doi:10.1038/nature12961 The genomic landscape of Neanderthal ancestry in present-day humans Sriram Sankararaman 1,2, Swapan Mallick 1,2, Michael Dannemann 3, Kay Prüfer 3, Janet Kelso 3, Svante
An early modern human from Romania with a recent Neanderthal ancestor
 An early modern human from Romania with a recent Neanderthal ancestor The Harvard community has made this article openly available. Please share how this access benefits you. Your story matters Citation
Browsing Genes and Genomes with Ensembl
 Browsing Genes and Genomes with Ensembl Victoria Newman Ensembl Outreach Officer EMBL-EBI Objectives What is Ensembl? What type of data can you get in Ensembl? How to navigate the Ensembl browser website.
Nature Genetics: doi: /ng.3143
 Supplementary Figure 1 Quantile-quantile plot of the association P values obtained in the discovery sample collection. The two clear outlying SNPs indicated for follow-up assessment are rs6841458 and rs7765379.
Derrek Paul Hibar
 Derrek Paul Hibar derrek.hibar@ini.usc.edu Obtain the ADNI Genetic Data Quality Control Procedures Missingness Testing for relatedness Minor allele frequency (MAF) Hardy-Weinberg Equilibrium (HWE) Testing
Linkage Disequilibrium
 Linkage Disequilibrium Why do we care about linkage disequilibrium? Determines the extent to which association mapping can be used in a species o Long distance LD Mapping at the tens of kilobase level
PERSPECTIVES. A gene-centric approach to genome-wide association studies
 PERSPECTIVES O P I N I O N A gene-centric approach to genome-wide association studies Eric Jorgenson and John S. Witte Abstract Genic variants are more likely to alter gene function and affect disease
Supplementary Figures
 Supplementary Figures A B Supplementary Figure 1. Examples of discrepancies in predicted and validated breakpoint coordinates. A) Most frequently, predicted breakpoints were shifted relative to those derived
Supplementary Material online Population genomics in Bacteria: A case study of Staphylococcus aureus
 Supplementary Material online Population genomics in acteria: case study of Staphylococcus aureus Shohei Takuno, Tomoyuki Kado, Ryuichi P. Sugino, Luay Nakhleh & Hideki Innan Contents Estimating recombination
Nature Genetics: doi: /ng Supplementary Figure 1. H3K27ac HiChIP enriches enhancer promoter-associated chromatin contacts.
 Supplementary Figure 1 H3K27ac HiChIP enriches enhancer promoter-associated chromatin contacts. (a) Schematic of chromatin contacts captured in H3K27ac HiChIP. (b) Loop call overlap for cohesin HiChIP
H3A - Genome-Wide Association testing SOP
 H3A - Genome-Wide Association testing SOP Introduction File format Strand errors Sample quality control Marker quality control Batch effects Population stratification Association testing Replication Meta
UKPMC Funders Group Author Manuscript Nature. Author manuscript; available in PMC 2011 April 1.
 UKPMC Funders Group Author Manuscript Published in final edited form as: Nature. 2010 October 28; 467(7319): 1061 1073. doi:10.1038/nature09534. A map of human genome variation from population scale sequencing
Estimating the mutation load in human genomes
 Nature Reviews Genetics AOP, published online 12 May 2015; doi:10.1038/nrg3931 REVIEWS Estimating the mutation load in human genomes Brenna M. Henn 1, Laura R. Botigué 1, Carlos D. Bustamante 2, Andrew
No evidence that selection has been less effective at removing deleterious mutations in Europeans than in Africans
 ANALYSIS No evidence that selection has been less effective at removing deleterious mutations in Europeans than in Africans Ron Do 1,2, Daniel Balick 1,3, Heng Li 1,2, Ivan Adzhubei 3, Shamil Sunyaev 1,3
N e =20,000 N e =150,000
 Evolution: For Review Only Page 68 of 80 Standard T=100,000 r=0.3 cm/mb r=0.6 cm/mb p=0.1 p=0.3 N e =20,000 N e =150,000 Figure S1: Distribution of the length of ancestral segment according to our approximation
Outline. Detecting Selective Sweeps. Are we still evolving? Finding sweeping alleles
 Outline Detecting Selective Sweeps Alan R. Rogers November 15, 2017 Questions Have humans evolved rapidly or slowly during the past 40 kyr? What functional categories of gene have evolved most? Selection
S1 Text: Supplementary Methods
 S1 Text: Supplementary Methods Technical details for population size history inference PSMC runs on a reduced version of the genome, with consecutive sites grouped into bins of 100 and each bin marked
Genome variation - part 1
 Genome variation - part 1 Dr Jason Wong Prince of Wales Clinical School Introductory bioinformatics for human genomics workshop, UNSW Day 2 Friday 21 th January 2016 Aims of the session Introduce major
HETEROZYGOSITY, or the fraction of nucleotides within. A Novel Approach to Estimating Heterozygosity from Low-Coverage Genome Sequence INVESTIGATION
 INVESTIGATION A Novel Approach to Estimating Heterozygosity from Low-Coverage Genome Sequence Katarzyna Bryc,*,1 Nick atterson, and David Reich* *Department of Genetics, Harvard Medical School, Boston,
Comparison of the levels of diversity between coldspots (CS) and highly recombining regions (HRRs) for SNPs in the FCQ data set.
 and highly recombining regions (HRRs) for SNPs in the FCQ data set.") Supplementary Figure 1 Comparison of the levels of diversity between coldspots (CS) and highly recombining regions (HRRs) for SNPs in the FCQ data set. Odds ratios (ORs) are computed to compare SNP density
Supplementary Figure 1 Comparison of the levels of diversity between coldspots (CS) and highly recombining regions (HRRs) for SNPs in the FCQ data set. Odds ratios (ORs) are computed to compare SNP density
Estimating the mutation load in human genomes
 Estimating the mutation load in human genomes Brenna M. Henn 1, Laura R. Botigué 1, Carlos D. Bustamante 2, Andrew G. Clark 3 and Simon Gravel 4 Abstract Next-generation sequencing technology has facilitated
Population structure, heritability, and polygenic risk
 Population structure, heritability, and polygenic risk Alicia Martin Daly Lab October 18, 2016 armartin@broadinstitute.org @genetisaur Project goals Call local ancestry in large case/control PTSD cohort
CS 262 Lecture 14 Notes Human Genome Diversity, Coalescence and Haplotypes
 CS 262 Lecture 14 Notes Human Genome Diversity, Coalescence and Haplotypes Coalescence Scribe: Alex Wells 2/18/16 Whenever you observe two sequences that are similar, there is actually a single individual
Statistical Tools for Predicting Ancestry from Genetic Data
 Statistical Tools for Predicting Ancestry from Genetic Data Timothy Thornton Department of Biostatistics University of Washington March 1, 2015 1 / 33 Basic Genetic Terminology A gene is the most fundamental
Alkes Price Harvard School of Public Health January 24 & January 26, 2017
 EPI 511, Advanced Population and Medical Genetics Week 1: Intro + HapMap / 1000 Genomes Linkage Disequilibrium Alkes Price Harvard School of Public Health January 24 & January 26, 2017 EPI 511: Course
SUPPLEMENTARY INFORMATION
 Contents De novo assembly... 2 Assembly statistics for all 150 individuals... 2 HHV6b integration... 2 Comparison of assemblers... 4 Variant calling and genotyping... 4 Protein truncating variants (PTV)...
Result Tables The Result Table, which indicates chromosomal positions and annotated gene names, promoter regions and CpG islands, is the best way for
 Result Tables The Result Table, which indicates chromosomal positions and annotated gene names, promoter regions and CpG islands, is the best way for you to discover methylation changes at specific genomic
Source1 Source2 Target Std. Err. SNPs Samples Supplementary Table 1. Groups with significant evidence of East Asian admixture.
 1 2 3 4 5 6 7 8 Source1 Source2 Target f 3 Std. Err. Z SNPs Samples Mala CHB BEB (Bengali) -0.004691 0.000195-24.029 412330 86 Mala CHB Thakur -0.008146 0.000349-23.311 385907 10 Mala CHB Hazara -0.005504
Genotyping Technology How to Analyze Your Own Genome Fall 2013
 Genotyping Technology 02-223 How to nalyze Your Own Genome Fall 2013 HapMap Project Phase 1 Phase 2 Phase 3 Samples & POP panels Genotyping centers Unique QC+ SNPs 269 samples (4 populations) HapMap International
Distinguishing between Selective Sweeps from Standing Variation and from a De Novo Mutation
 Distinguishing between Selective Sweeps from Standing Variation and from a De Novo Mutation Benjamin M. Peter 1 *, Emilia Huerta-Sanchez 1,2, Rasmus Nielsen 1,2 1 Department of Integrative Biology, University
Drupal.behaviors.print = function(context) {window.print();window.close();}>
 {window.print();window.close();}>") Page 1 of 7 Drupal.behaviors.print = function(context) {window.print();window.close();}> All the Variation October 03, 2011 All the Variation By Ciara Curtin People are very different from one another
Page 1 of 7 Drupal.behaviors.print = function(context) {window.print();window.close();}> All the Variation October 03, 2011 All the Variation By Ciara Curtin People are very different from one another
The human noncoding genome defined by genetic diversity
 SUPPLEMENTARY INFORMATION Letters https://doi.org/10.1038/s41588-018-0062-7 In the format provided by the authors and unedited. The human noncoding genome defined by genetic diversity Julia di Iulio 1,5,
Introduction to Population Genetics. Spezielle Statistik in der Biomedizin WS 2014/15
 Introduction to Population Genetics Spezielle Statistik in der Biomedizin WS 2014/15 What is population genetics? Describes the genetic structure and variation of populations. Causes Maintenance Changes
Deleterious mutations
 Deleterious mutations Mutation is the basic evolutionary factor which generates new versions of sequences. Some versions (e.g. those concerning genes, lets call them here alleles) can be advantageous,
Population stratification. Background & PLINK practical
 Population stratification Background & PLINK practical Variation between, within populations Any two humans differ ~0.1% of their genome (1 in ~1000bp) ~8% of this variation is accounted for by the major
Bioinformatic Analysis of SNP Data for Genetic Association Studies EPI573
 Bioinformatic Analysis of SNP Data for Genetic Association Studies EPI573 Mark J. Rieder Department of Genome Sciences mrieder@u.washington washington.edu Epidemiology Studies Cohort Outcome Model to fit/explain
Novel Variant Discovery Tutorial
 Novel Variant Discovery Tutorial Release 8.4.0 Golden Helix, Inc. August 12, 2015 Contents Requirements 2 Download Annotation Data Sources...................................... 2 1. Overview...................................................
Single Nucleotide Variant Analysis. H3ABioNet May 14, 2014
 Single Nucleotide Variant Analysis H3ABioNet May 14, 2014 Outline What are SNPs and SNVs? How do we identify them? How do we call them? SAMTools GATK VCF File Format Let s call variants! Single Nucleotide
Prioritization: from vcf to finding the causative gene
 Prioritization: from vcf to finding the causative gene vcf file making sense A vcf file from an exome sequencing project may easily contain 40-50 thousand variants. In order to optimize the search for
Title: Genome-wide signals of positive selection in human evolution. Authors: David Enard*, Philipp W. Messer, and Dmitri A.
 Title: Genome-wide signals of positive selection in human evolution Authors: David Enard*, Philipp W. Messer, and Dmitri A. Petrov* Affiliations: Department of Biology, Stanford University, Stanford, CA
A genome wide association study of metabolic traits in human urine
 Supplementary material for A genome wide association study of metabolic traits in human urine Suhre et al. CONTENTS SUPPLEMENTARY FIGURES Supplementary Figure 1: Regional association plots surrounding
Supplementary Figure 1 a
 Supplementary Figure 1 a b GWAS second stage log 10 observed P 0 2 4 6 8 10 12 0 1 2 3 4 log 10 expected P rs3077 (P hetero =0.84) GWAS second stage (BBJ, Japan) First replication (BBJ, Japan) Second replication
DOI: /journal.pgen Publication date: Document Version Publisher's PDF, also known as Version of record
 university of copenhagen Natural selection affects multiple aspects of genetic variation at putatively peutral sites across the human genome Lohmueller, Kirk E; Albrechtsen, Anders; Li, Yingrui; Kim, Su
Simultaneous profiling of transcriptome and DNA methylome from a single cell
 Additional file 1: Supplementary materials Simultaneous profiling of transcriptome and DNA methylome from a single cell Youjin Hu 1, 2, Kevin Huang 1, 3, Qin An 1, Guizhen Du 1, Ganlu Hu 2, Jinfeng Xue
HISTORICAL LINGUISTICS AND MOLECULAR ANTHROPOLOGY
 Third Pavia International Summer School for Indo-European Linguistics, 7-12 September 2015 HISTORICAL LINGUISTICS AND MOLECULAR ANTHROPOLOGY Brigitte Pakendorf, Dynamique du Langage, CNRS & Université
Intro to population genetics
 Intro to population genetics Shamil Sunyaev Department of Biomedical Informatics Harvard Medical School Broad Institute of M.I.T. and Harvard Forces responsible for genetic change Mutation µ Selection
Genotype Prediction with SVMs
 Genotype Prediction with SVMs Nicholas Johnson December 12, 2008 1 Summary A tuned SVM appears competitive with the FastPhase HMM (Stephens and Scheet, 2006), which is the current state of the art in genotype
SUPPLEMENTARY INFORMATION
 doi:10.1038/nature09944 Supplementary Figure 1. Establishing DNA sequence similarity thresholds for phylum and genus levels Sequence similarity distributions of pairwise alignments of 40 universal single
Inconsistencies in Neanderthal Genomic DNA Sequences
 Inconsistencies in Neanderthal Genomic DNA Sequences Jeffrey D. Wall *, Sung K. Kim Institute for Human Genetics, University of California San Francisco, San Francisco, California, United States of America
Demographic history and rare allele sharing among human populations
 Demographic history and rare allele sharing among human populations Simon Gravel a, Brenna M. Henn a, Ryan N. Gutenkunst b, Amit R. Indap c, Gabor T. Marth c, Andrew G. Clark d, Fuli Yu e, Richard A. Gibbs
By the end of this lecture you should be able to explain: Some of the principles underlying the statistical analysis of QTLs
 (3) QTL and GWAS methods By the end of this lecture you should be able to explain: Some of the principles underlying the statistical analysis of QTLs Under what conditions particular methods are suitable
An Introduction to Population Genetics
 An Introduction to Population Genetics THEORY AND APPLICATIONS f 2 A (1 ) E 1 D [ ] = + 2M ES [ ] fa fa = 1 sf a Rasmus Nielsen Montgomery Slatkin Sinauer Associates, Inc. Publishers Sunderland, Massachusetts
UNIVERSITY OF YORK BA, BSc, and MSc Degree Examinations
 Examination Candidate Number: Desk Number: UNIVERSITY OF YORK BA, BSc, and MSc Degree Examinations 2017-8 Department : BIOLOGY Title of Exam: Human genetics Time Allowed: 2 hours Marking Scheme: Total
From Variants to Pathways: Agilent GeneSpring GX s Variant Analysis Workflow
 From Variants to Pathways: Agilent GeneSpring GX s Variant Analysis Workflow Technical Overview Import VCF Introduction Next-generation sequencing (NGS) studies have created unanticipated challenges with
Pervasive Hitchhiking at Coding and Regulatory Sites in Humans
 Pervasive Hitchhiking at Coding and Regulatory Sites in Humans James J. Cai 1, J. Michael Macpherson 1, Guy Sella 2", Dmitri A. Petrov 1" * 1 Department of Biology, Stanford University, Stanford, California,
Runs of Homozygosity Analysis Tutorial
 Runs of Homozygosity Analysis Tutorial Release 8.7.0 Golden Helix, Inc. March 22, 2017 Contents 1. Overview of the Project 2 2. Identify Runs of Homozygosity 6 Illustrative Example...............................................
Mapping long-range promoter contacts in human cells with high-resolution capture Hi-C
 CORRECTION NOTICE Nat. Genet. 47, 598 606 (2015) Mapping long-range promoter contacts in human cells with high-resolution capture Hi-C Borbala Mifsud, Filipe Tavares-Cadete, Alice N Young, Robert Sugar,
Population Genetics II. Bio
 Population Genetics II. Bio5488-2016 Don Conrad dconrad@genetics.wustl.edu Agenda Population Genetic Inference Mutation Selection Recombination The Coalescent Process ACTT T G C G ACGT ACGT ACTT ACTT AGTT
The landscape of Neandertal ancestry in present-day humans
 The landscape of Neandertal ancestry in present-day humans The Harvard community has made this article openly available. Please share how this access benefits you. Your story matters. Citation Published
I/O Suite, VCF (1000 Genome) and HapMap
 and HapMap") I/O Suite, VCF (1000 Genome) and HapMap Hin-Tak Leung April 13, 2013 Contents 1 Introduction 1 1.1 Ethnic Composition of 1000G vs HapMap........................ 2 2 1000 Genome vs HapMap YRI (Africans)
I/O Suite, VCF (1000 Genome) and HapMap Hin-Tak Leung April 13, 2013 Contents 1 Introduction 1 1.1 Ethnic Composition of 1000G vs HapMap........................ 2 2 1000 Genome vs HapMap YRI (Africans)
UK Biobank Axiom Array
 DATA SHEET Advancing human health studies with powerful genotyping technology Array highlights The Applied Biosystems UK Biobank Axiom Array is a powerful array for translational research. Designed using
Strand NGS Variant Caller
 STRAND LIFE SCIENCES WHITE PAPER Strand NGS Variant Caller A Benchmarking Study Rohit Gupta, Pallavi Gupta, Aishwarya Narayanan, Somak Aditya, Shanmukh Katragadda, Vamsi Veeramachaneni, and Ramesh Hariharan
Fast and accurate genotype imputation in genome-wide association studies through pre-phasing. Supplementary information
 Fast and accurate genotype imputation in genome-wide association studies through pre-phasing Supplementary information Bryan Howie 1,6, Christian Fuchsberger 2,6, Matthew Stephens 1,3, Jonathan Marchini
VEGAS2: Gene-based test software using 1000 Genomes reference sets. User Manual
 VEGAS2: Gene-based test software using 1000 Genomes reference sets. User Manual Version: 16:09:002 Date: 16 th September 2014 By Aniket Mishra, Stuart Macgregor Statistical Genetics Group QIMR Berghofer
Goal: To use GCTA to estimate h 2 SNP from whole genome sequence data & understand how MAF/LD patterns influence biases
 GCTA Practical 2 Goal: To use GCTA to estimate h 2 SNP from whole genome sequence data & understand how MAF/LD patterns influence biases GCTA practical: Real genotypes, simulated phenotypes Genotype Data
Supplementary Figures
 1 Supplementary Figures exm26442 2.40 2.20 2.00 1.80 Norm Intensity (B) 1.60 1.40 1.20 1 0.80 0.60 0.40 0.20 2 0-0.20 0 0.20 0.40 0.60 0.80 1 1.20 1.40 1.60 1.80 2.00 2.20 2.40 2.60 2.80 Norm Intensity