Genetically targeted all-optical electrophysiology with a transgenic Credependent
|
|
|
- Magdalen Carson
- 6 years ago
- Views:
Transcription
1 Genetically targeted all-optical electrophysiology with a transgenic Credependent Optopatch mouse Short title: Transgenic Optopatch mouse Shan Lou 1, Yoav Adam 1, Eli N. Weinstein 1,4, Erika Williams 2, Katherine Williams 1, Vicente Parot 1, Nikita Kavokine 1, Stephen Liberles 2, Linda Madisen 3, Hongkui Zeng 3, Adam E. Cohen 1,4,5,* 1 Department of Chemistry and Chemical Biology, Harvard University, Cambridge, MA Department of Cell Biology, Harvard Medical School, Boston, MA Allen Institute for Brain Science, Seattle, WA Department of Physics, Harvard University, Cambridge, MA Howard Hughes Medical Institute * cohen@chemistry.harvard.edu Supplementary Online Material Supplementary Figures S1 S5 Supplementary Discussion: Heating of brain tissue by 640 nm laser light 1
 Confocal image of a fixed brain slice from a SST-Cre +/- ; Floxopatch +/+ mouse.")
 Confocal images of GFP fluorescence in brain slices from animals with and without a Cre driver.")
2 Figure S1. Specificity and selectivity of Optopatch2 expression in Floxopatch mice. A) Confocal image of a fixed brain slice from a SST-Cre +/- ; Floxopatch +/+ mouse. The slice has been stained with primary antibodies rabbit-anti-gfp and rat-anti-sst, and with secondary antibodies goat-anti-rabbit Alexa 488 and Goat-anti-rat Alexa 647. B) Confocal images of GFP fluorescence in brain slices from animals with and without a Cre driver. The small fluorescent puncta in the Floxopatch +/+ images were equally present in the Floxopatch -/- images, suggesting that these came from endogenous autofluorescent particles, rather than from leaky expression. 2
 Comparison of a mouse with whole-body Optopatch expression (CAG-CreEr +/- ; Floxopatch +/- ) and its littermate control (CAG-CreEr +/- ; Floxopatch -/- ).")
 Comparison of the weights of mice with whole-body Optopatch expression and controls.")
3 Figure S2. Whole-body expression of Optopatch causes toxicity. (A) Comparison of a mouse with whole-body Optopatch expression (CAG-CreEr +/- ; Floxopatch +/- ) and its littermate control (CAG-CreEr +/- ; Floxopatch -/- ). Both were treated with tamoxifen from P15 to P20 and sacrificed on P21. The Optopatchexpressing mouse was smaller in size. Scale bar 1 cm. (B) Organs from the mice shown in (A). Organs from mice with whole-body Optopatch expression were smaller than control. Scale bar 5 mm. (C) Comparison of the weights of mice with whole-body Optopatch expression and controls. Optopatchexpressing mice were lighter (6.7 g, n = 3 Floxopatch +/-, 10.2 g, n = 2 Floxopatch -/- ). (D) Fluorescence images of CheRiff-eGFP, showing Optopatch expression in brain (top) and skin (bottom) of expressing mice and not in controls. Scale bar 5 mm. 3
 Comparison of tissue autofluorescence under blue excitation ( exc : 488 nm, em : 520 540 nm) or red excitation ( exc : 640 nm, em : 667 742 nm).")
 Comparison of signal to background ratio (SBR) between QuasAr2 and egfp in cells expressing Optopatch2 in acute brain slice.")
4 Figure S3. Optical properties of QuasAr2 imaging in acute brain slice. (A) Comparison of tissue autofluorescence under blue excitation ( exc : 488 nm, em : nm) or red excitation ( exc : 640 nm, em : nm). Identical illumination spots were established by an iris in the shared excitation path. (B) Comparison of signal to background ratio (SBR) between QuasAr2 and egfp in cells expressing Optopatch2 in acute brain slice. Inset: paired example of QuasAr2 fluorescence and CheRiff-eGFP fluorescence in CamKII-Cre +/- ; Floxopatch +/- neurons imaged via wide-field epifluorescence in acute brain slice. (C) Simultaneous patch clamp and fluorescence measurements in acute brain slice from a CamKII- Cre +/- ; Floxopatch +/- mouse. 4

 Enlarged view showing the local baseline value (pink), estimated via a sliding percentile filter.")
5 Figure S4. Spike finding in fluorescence recordings in acute brain slice. (A) Raw fluorescence trace from a single neuron with periodic optical stimulation. The decreasing baseline was dominated by photobleaching of the background autofluorescence, and not photobleaching of QuasAr2, as evidenced by the absence of photobleaching in the spike heights. (B) The baseline photobleaching was estimated via a sliding minimum filter and then corrected by division to yield a trace of F/F. (C) Enlarged view showing the local baseline value (pink), estimated via a sliding percentile filter. (D) Signal above baseline; dotted line indicates the dynamically set threshold and blue dots indicate action potential peaks. (E) Depth distribution of recorded cells. (F) Signal-to-noise ratio (SNR) of each cell as a function of depth. Sources with an SNR below 4 were discarded at the start of the analysis. 5
6 6
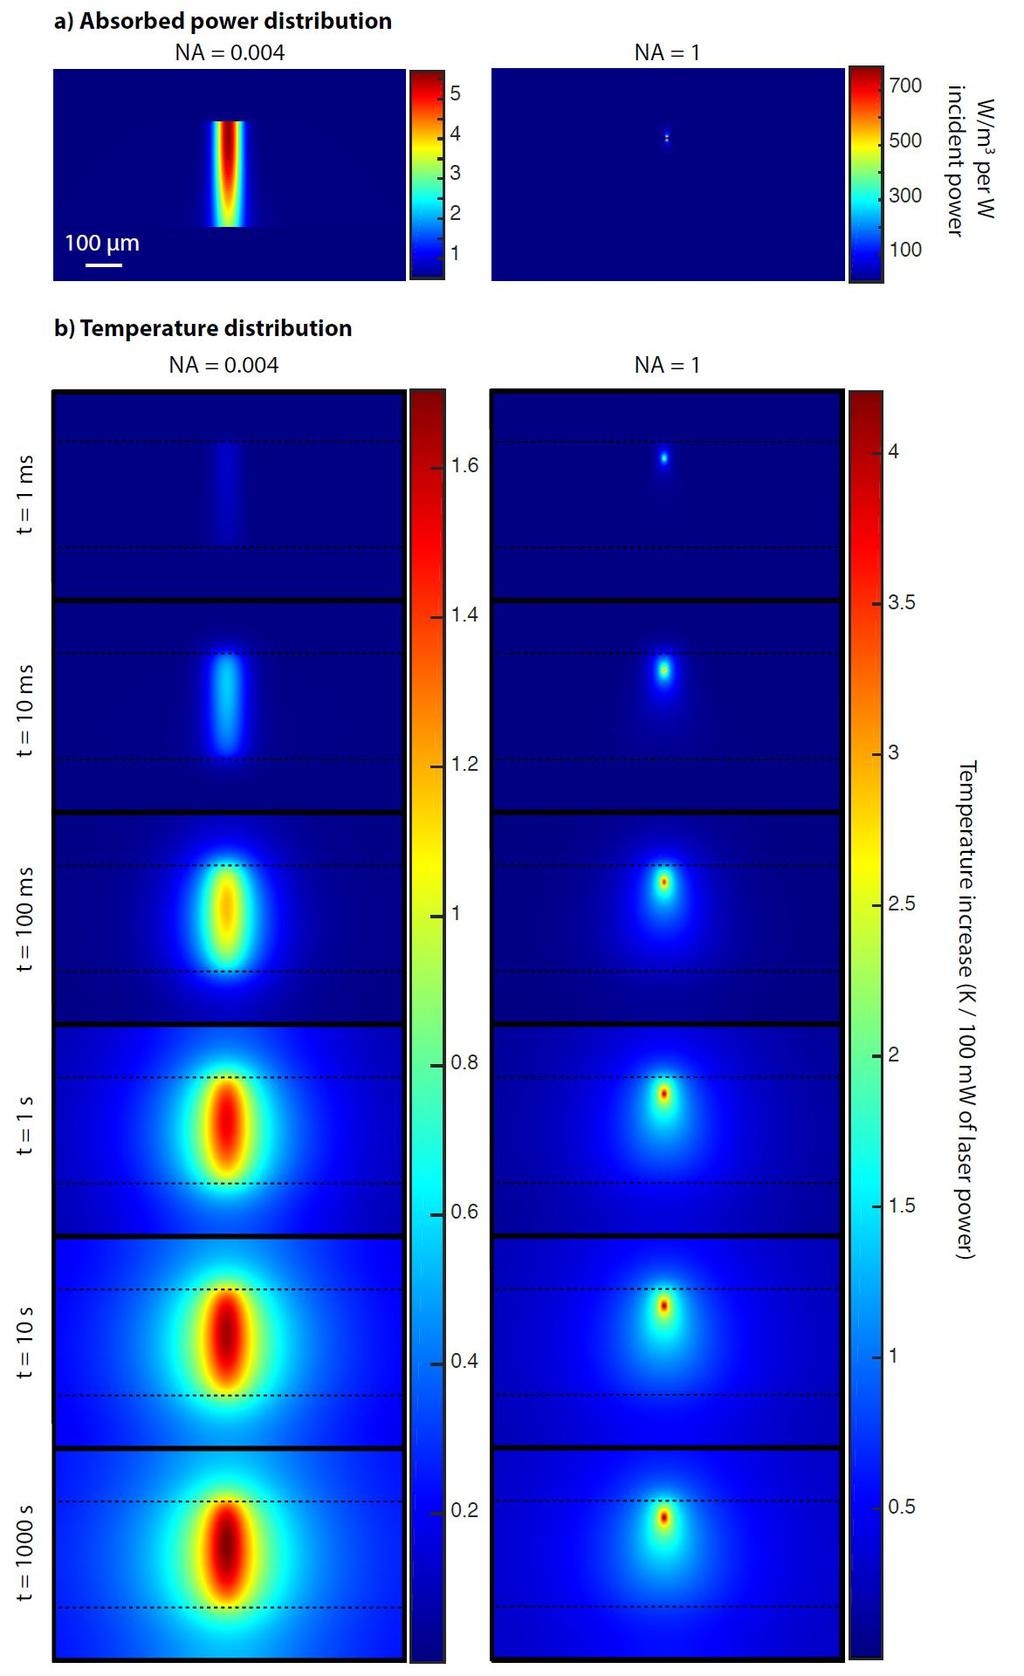
7 Figure S5. Monte Carlo simulations of laser-induced heating of brain tissue at 640 nm. We performed Monte Carlo simulations of light propagation through tissue, using the Henyey-Greenstein scattering function with an anisotropy of g = 0.9. Left: calculation for low NA illumination with a 50 m focal spot. Right: calculation for high NA (NA = 1) illumination. In both cases the focus was 50 m below the surface of the brain slice. We then simulated diffusion of heat using the optical power distribution as the source term. We ignored convective dissipation from blood flow or temperature-dependent changes in metabolic heat production. For a 50 m focus, we calculated a steady-state temperature coefficient of C/mW, and for a diffraction-limited focal spot we calculated 0.04 C/mW. These calculations are in broad agreement with the estimates based on literature simulations and data. To keep temperatures within 2 C of baseline, the laser power should be < 60 mw. Supplementary Discussion Heating of brain tissue by 640 nm laser light The degree of heating depends not just on the illumination intensity at the focus, but on the total laser power delivered to the sample (how big a region is being imaged), on the duration of the illumination, and on paths for heat removal (blood flow, imaging buffer). Recent reports have studied temperature rises in brain from light delivered via an optical fiber (Stujenske et al., 2015), or near infrared light used in two-photon microscopy (Podgorski and Ranganathan, 2016). Stujenske and coworkers predicted that for 532 nm light exiting a 62 m diameter fiber with an NA of 0.22, embedded in brain, the maximum temperature rise was 0.4 C/mW. Using the data of Jacques (Jacques, 2013), the absorption coefficient at 640 nm is estimated to be ~14-fold lower than at 532 nm. Considering the modest change in scattering length between these two wavelengths, and the fact that the absorption length is much greater than the scattering length, then it is reasonable to approximate the spatial distributions of the light as similar at 532 and 640 nm. The estimated temperature rise at 640 nm is simply the rise at 532 nm, scaled by the ratio of the absorption coefficients. This estimate predicts 0.03 C/mW. A power of 40 mw would induce a temperature rise of 1.2 C. Podgorski and Ranganathan studied the temperature rise under near IR illumination in brain tissue. For a 1 mm square scan pattern, they found steady-state temperature coefficients between and 0.02 C/mW at wavelengths from nm (less heating at the shorter wavelength). From their reported dependence of temperature rise on scan area, we infer that T ~ L -0.26, where L is the linear dimension of the scan. Scaling their 1 mm scan to a focus of 50 m diameter predicts a temperature coefficient of C/mW. The absorption coefficient of brain is nearly constant between 640 and 800 nm, so from this calculation we estimate a temperature coefficient at the lower end of this range, C/mW. This estimate is remarkably similar to the value of 0.03 C/mW estimated independently from the work of Stujenske and coworkers. References Jacques SL (2013) Optical properties of biological tissues: A review. Phys Med Biol 58:R37. Podgorski K, Ranganathan G (2016) Brain heating induced by near-infrared lasers during multiphoton microscopy. J Neurophysiol 116:
8 Stujenske JM, Spellman T, Gordon JA (2015) Modeling the spatiotemporal dynamics of light and heat propagation for in vivo optogenetics. Cell Reports 12:
Special Techniques 1. Mark Scott FILM Facility
 Special Techniques 1 Mark Scott FILM Facility SPECIAL TECHNIQUES Multi-photon microscopy Second Harmonic Generation FRAP FRET FLIM In-vivo imaging TWO-PHOTON MICROSCOPY Alternative to confocal and deconvolution
Simultaneous multi-color, multiphoton fluorophore excitation using dual-color fiber lasers
 Multiphoton Microscopy / Fiber Laser Simultaneous multi-color, multiphoton fluorophore excitation using dual-color fiber lasers Matthias Handloser, Tim Paasch-Colberg, Bernhard Wolfring TOPTICA Photonics
Dino-Lite knowledge & education. Fluorescence Microscopes
 Dino-Lite knowledge & education Fluorescence Microscopes Dino-Lite Fluorescence models Smallest fluorescence microscope in the world Revolution to biomedical and educational applications Flexible Easy
A Brief History of Light Microscopy And How It Transformed Biomedical Research
 A Brief History of Light Microscopy And How It Transformed Biomedical Research Suewei Lin Office: Interdisciplinary Research Building 8A08 Email: sueweilin@gate.sinica.edu.tw TEL: 2789-9315 Microscope
Multiplexed 3D FRET imaging in deep tissue of live embryos Ming Zhao, Xiaoyang Wan, Yu Li, Weibin Zhou and Leilei Peng
 Scientific Reports Multiplexed 3D FRET imaging in deep tissue of live embryos Ming Zhao, Xiaoyang Wan, Yu Li, Weibin Zhou and Leilei Peng 1 Supplementary figures and notes Supplementary Figure S1 Volumetric
Absorption of an electromagnetic wave
 In vivo optical imaging?? Absorption of an electromagnetic wave Tissue absorption spectrum Extinction = Absorption + Scattering Absorption of an electromagnetic wave Scattering of an electromagnetic wave
More on fluorescence
 More on fluorescence Last class Fluorescence Absorption emission Jablonski diagrams This class More on fluorescence Common fluorophores Jablonski diagrams to spectra Properties of fluorophores Excitation
Rice/TCU REU on Computational Neuroscience. Fundamentals of Molecular Imaging
 Rice/TCU REU on Computational Neuroscience Fundamentals of Molecular Imaging June 2, 2009 Neal Waxham 713-500-5621 m.n.waxham@uth.tmc.edu Objectives Introduction to resolution in light microscopy Brief
Introduction to Computational Fluorescence Microscopy!
 Introduction to Computational Fluorescence Microscopy! EE367/CS448I: Computational Imaging and Display! stanford.edu/class/ee367! Lecture 13! Gordon Wetzstein! Stanford University! Midterm! Tuesday, Feb
Skull optical clearing window for in vivo imaging of the mouse cortex at synaptic resolution
 SUPPLEMENTARY INFORMATION for Skull optical clearing window for in vivo imaging of the mouse cortex at synaptic resolution Yanjie Zhao 1,2, Tingting Yu 1,2, Chao Zhang 1,2, Zhao Li 1,2, Qingming Luo 1,2,
PALM/STORM, BALM, STED
 PALM/STORM, BALM, STED Last class 2-photon Intro to PALM/STORM Cyanine dyes/dronpa This class Finish localization super-res BALM STED Localization microscopy Intensity Bins = pixels xx 2 = ss2 + aa 2 /12
SUPPLEMENTARY FIGURES
 SYNERGISTIC STRATEGY FOR MULTICOLOR TWO-PHOTON MICROSCOPY: APPLICATION TO THE ANALYSIS OF GERMINAL CENTER REACTIONS IN VIVO ASYLKHAN RAKHYMZHAN, RUTH LEBEN, HANNA ZIMMERMANN, ROBERT GÜNTHER, PEGGY MEX,
SUPPLEMENTARY INFORMATION
 SUPPLEMENTARY INFORMATION Multiplexed Profiling Of Single Extracellular Vesicles Kyungheon Lee 1#, Kyle Fraser 1#, Bassel Ghaddar 1, Katy Yang 1, Eunha Kim 1, Leonora Balaj 2, E. Antonio Chiocca 3, Xandra
Post-expansion antibody delivery, after epitope-preserving homogenization.
 Supplementary Figure 1 Post-expansion antibody delivery, after epitope-preserving homogenization. (a, b) Wide-field fluorescence images of Thy1-YFP-expressing mouse brain hemisphere slice before expansion
Biophotonics?? Biophotonics. technology in biomedical engineering. Advantages of the lightwave
 Biophotonics - Imaging: X-ray, OCT, polarimetry, DOT, TIRF, photon migration, endoscopy, confocal microscopy, multiphoton microscopy, multispectral imaging - Biosensing: IR spectroscopy, fluorescence,
Two-Photon Microscopy for Deep Tissue Imaging of Living Specimens
 for Deep Tissue Imaging of Living Specimens Tilman Franke* and Sebastian Rhode TILL Photonics GmbH, an FEI company, Lochhamer Schlag 21, D-82166 Gräfelfing, Germany *tilman.franke@fei.com Introduction
Confocal Microscopy & Imaging Technology. Yan Wu
 Confocal Microscopy & Imaging Technology Yan Wu Dec. 05, 2014 Cells under the microscope What we use to see the details of the cell? Light and Electron Microscopy - Bright light / fluorescence microscopy
7/14/2015. Single-cell-level measurements of transcription heterogeneity of highly mobile identical genes. Enrico Gratton and Paolo Annibale
 7//5 Single-cell-level measurements of transcription heterogeneity of highly mobile identical genes Enrico Gratton and Paolo Annibale Laboratory for Florescence Dynamics University of California, Irvine
Nature Neuroscience: doi: /nn Supplementary Figure 1
 Supplementary Figure 1 PCR-genotyping of the three mouse models used in this study and controls for behavioral experiments after semi-chronic Pten inhibition. a-c. DNA from App/Psen1 (a), Pten tg (b) and
Supplementary Note 1: Estimation of the number of the spectroscopic units inside the single Pdots
 Supplementary Note 1: Estimation of the number of the spectroscopic units inside the single Pdots The number of the CP chains inside each PD1-L and PD2-L particle was estimated to be 28 and 444 chains/particle,respectively,
Optogenetics and Multiphoton Excitation. June 2014
 Optogenetics and Multiphoton Excitation June 2014 Optogenetics and Multiphoton Excitation (MPE) MPE is used in Optogenetics for the usual advantages related to nonlinear excitation: Deeper penetration
Confocal Microscopes. Evolution of Imaging
 Confocal Microscopes and Evolution of Imaging Judi Reilly Hans Richter Massachusetts Institute of Technology Environment, Health & Safety Office Radiation Protection What is Confocal? Pinhole diaphragm
BIO 315 Lab Exam I. Section #: Name:
 Section #: Name: Also provide this information on the computer grid sheet given to you. (Section # in special code box) BIO 315 Lab Exam I 1. In labeling the parts of a standard compound light microscope
Supplementary Information
 Supplementary Information Circulating Microparticles Alter Formation, Structure, and Properties of Fibrin Clots Laily D. Zubairova 1, Roza M. Nabiullina 1, Chandrasekaran Nagaswami 2, Yuriy F. Zuev 3,
HYPERSPECTRAL MICROSCOPE PLATFORM FOR HIGHLY MULTIPLEX BIOLOGICAL IMAGING. Marc Verhaegen
 HYPERSPECTRAL MICROSCOPE PLATFORM FOR HIGHLY MULTIPLEX BIOLOGICAL IMAGING Marc Verhaegen CMCS, MONTREAL, MAY 11 th, 2017 OVERVIEW Hyperspectral Imaging Multiplex Biological Imaging Multiplex Single Particle
Supplementary Figure 1. Screening for monoclonal antibodies against GluA1 by immunoblotting.
 Supplementary Figure 1 Screening for monoclonal antibodies against GluA1 by immunoblotting. Hippocampal extract was subjected to western blotting with the hybridoma supernatants of candidate monoclonal
Second Harmonic Generation Microscope Product Requirements Document Harmonigenic/ Dr Robert Hill Faculty Advisor: Dr. Wayne Knox
 Second Harmonic Generation Microscope Product Requirements Document Harmonigenic/ Dr Robert Hill Faculty Advisor: Dr. Wayne Knox James Emery (Scribe) Ava Hurlock (Document Handler) Jordan Rabinowitz (Project
Supporting Information
 Digital Microarrays: Single-Molecule Readout with Interferometric Detection of Plasmonic Nanorod Labels Derin Sevenler 1, George G. Daaboul 2, Fulya Ekiz Kanik 1, Neşe Lortlar Ünlü 3 and M. Selim Ünlü
BASICS OF FLOW CYTOMETRY
 BASICS OF FLOW CYTOMETRY AUTHOR: Ana Isabel Vieira APPROVAL: Henrique Veiga Fernandes Ana Sílvia Gonçalves SOP.UCF.002 03-09-2015 Pag. 1/9 Overview Flow: Fluid Cyto: Cell Metry: Measurement Flow cytometry
Design for Manufacturability (DFM) in the Life Sciences
 in the Life Sciences") T E C H N I C A L N O T E Design for Manufacturability (DFM) in the Life Sciences Fluorescence Spectroscopy Product Platform Realized with TracePro TM Suite of Opto-Mechanical Design Software Tools Authors:
T E C H N I C A L N O T E Design for Manufacturability (DFM) in the Life Sciences Fluorescence Spectroscopy Product Platform Realized with TracePro TM Suite of Opto-Mechanical Design Software Tools Authors:
Visualizing Cells Molecular Biology of the Cell - Chapter 9
 Visualizing Cells Molecular Biology of the Cell - Chapter 9 Resolution, Detection Magnification Interaction of Light with matter: Absorbtion, Refraction, Reflection, Fluorescence Light Microscopy Absorbtion
1st Faculty of Medicine, Charles University in Prague Center for Advanced Preclinical Imaging (CAPI)
") ADVANTAGES Optical Imaging OI Optical Imaging is based on the detection of weak light by a highly sensitive and high resolution CCD camera DISADVANTAGES High sensitivity Limited penetration depth Easy
ADVANTAGES Optical Imaging OI Optical Imaging is based on the detection of weak light by a highly sensitive and high resolution CCD camera DISADVANTAGES High sensitivity Limited penetration depth Easy
Fluorescence Microscopy. Terms and concepts to know: 10/11/2011. Visible spectrum (of light) and energy
 and energy") Fluorescence Microscopy Louisiana Tech University Ruston, Louisiana Microscopy Workshop Dr. Mark DeCoster Associate Professor Biomedical Engineering 1 Terms and concepts to know: Signal to Noise Excitation
Fluorescence Microscopy Louisiana Tech University Ruston, Louisiana Microscopy Workshop Dr. Mark DeCoster Associate Professor Biomedical Engineering 1 Terms and concepts to know: Signal to Noise Excitation
Multi-modal optical sensing and analyte specificity via single-walled carbon nanotubes
 Supplementary Figures, Table, and Methods for: Multi-modal optical sensing and analyte specificity via single-walled carbon nanotubes Daniel A. Heller 1, Hong Jin 1, Brittany M. Martinez 1,, Dhaval Patel
In vivo fast imaging and optogenetic manipulation using genetically-encoded fluorescent indicators and actuators. Serena Bovetti
 In vivo fast imaging and optogenetic manipulation using genetically-encoded fluorescent indicators and actuators Serena Bovetti Istituto Italiano di Tecnologia Genova, Italy Bogliasco, June 6-8 2016 Analyzing
Sample region with fluorescent labeled molecules
 FLUORESCENCE IMAGING I. Fluorescence-imaging with diffraction limited spots The resolution in optical microscopy has been hampered by the smallest spot possible (~ λ/2) that can be achieved by conventional
Nature Biotechnology: doi: /nbt Supplementary Figure 1. Mass spectrometry characterization of epoxide reactions.
 Supplementary Figure 1 Mass spectrometry characterization of epoxide reactions. (a) Degree of amine reactivity of bovine serum albumin (BSA) with epoxide molecules having different numbers of epoxide groups:
In situ semi-quantitative assessment of single cell viability by resonance
 Electronic Supplementary Material (ESI) for Chemical Communications. This journal is The Royal Society of Chemistry 2018 Electronic Supplementary Information (ESI) In situ semi-quantitative assessment
BIO 315 Lab Exam I. Section #: Name:
 Section #: Name: Also provide this information on the computer grid sheet given to you. (Section # in special code box) BIO 315 Lab Exam I 1. In labeling the parts of a standard compound light microscope
Basic principles of quantification using optical techniques
 Contents Basic principles of quantification using optical techniques Adrian Taruttis Helmholtz Zentrum München Chair for Biological Imaging Technische Universität München Light/ tissue interactions Planar
Nature Neuroscience: doi: /nn Supplementary Figure 1. Comprehensive opto-mechanical design of the dual-axis microscope.
 Supplementary Figure 1 Comprehensive opto-mechanical design of the dual-axis microscope. (a) The complete microscope is shown to scale. The laser beam is depicted in light red. (b) A close-up view of the
Cellular imaging using Nano- Materials. A Case-Study based approach Arun Murali, Srivats V
 Cellular imaging using Nano- Materials A Case-Study based approach Arun Murali, Srivats V Agenda Discuss a few papers Explain a couple of new imaging techniques and their benefits over conventional imaging
Imaging of endocrine organs
 Imaging of endocrine organs Helen Christian Department of Physiology, Anatomy & Genetics St Anne s College, University of Oxford Diabetesforum, Stockholm 2017 Islets of Langerhan Pituitary gland Renin
Fluorescence Background Problem in Raman Spectroscopy: Is 1064 nm Excitation
 Fluorescence Background Problem in Raman Spectroscopy: Is 1064 nm Excitation an Improvement of 785 nm? Shan Yang a and Ozan Akkusa, b, c a Department of Mechanical and Aerospace Engineering, Case Western
FLUORESCENCE. Matyas Molnar and Dirk Pacholsky
 FLUORESCENCE Matyas Molnar and Dirk Pacholsky 1 Information This lecture contains images and information from the following internet homepages http://micro.magnet.fsu.edu/primer/index.html http://www.microscopyu.com/
Methods of Characterizing Neural Networks
 Methods of Characterizing Neural Networks Ashley Nord University of Minnesota Minneapolis, MN 55414 Advisors: Katsushi Arisaka, Adrian Cheng University of California Los Angeles Los Angeles, CA 90024 September
Nature Neuroscience: doi: /nn Supplementary Figure 1
 Supplementary Figure 1 Nanoscale localization precision and relative quantification of CB 1 receptors by 3D-STORM imaging (a) Schematic representation of the experimental paradigm for combined confocal/storm
Spontaneous network activity visualized by ultrasensitive Ca 2+ indicators, yellow Cameleon-Nano
 nature methods Spontaneous network activity visualized by ultrasensitive Ca 2+ indicators, yellow Cameleon-Nano Kazuki Horikawa, Yoshiyuki Yamada, Tomoki Matsuda, Kentarou Kobayashi, Mitsuhiro Hashimoto,
Active delivery of single DNA molecules into a plasmonic nanopore for. label-free optical sensing
 Supporting Information: Active delivery of single DNA molecules into a plasmonic nanopore for label-free optical sensing Xin Shi 1,2, Daniel V Verschueren 1, and Cees Dekker 1* 1. Department of Bionanoscience,
Supporting information. Single-cell and subcellular pharmacokinetic imaging allows insight into drug action in vivo
 Supporting information Single-cell and subcellular pharmacokinetic imaging allows insight into drug action in vivo Greg Thurber 1, Katy Yang 1, Thomas Reiner 1, Rainer Kohler 1, Peter Sorger 2, Tim Mitchison
Microscopy from Carl Zeiss
 Microscopy from Carl Zeiss LSM 710 In Tune with Your Application Enjoy new freedom in selecting fluorescent dyes with In Tune, the new laser system for the LSM 710. Whatever the wavelength, you can match
Fluorescence Light Microscopy for Cell Biology
 Fluorescence Light Microscopy for Cell Biology Why use light microscopy? Traditional questions that light microscopy has addressed: Structure within a cell Locations of specific molecules within a cell
PRODUCT DATA SHEET. Carboxylated Fluorescent Gold Nanoparticles. Description. Characteristics
 PRODUCT DATA SHEET Carboxylated Fluorescent Gold Nanoparticles Description Cytodiagnostics carboxylated fluorescent gold nanoparticles is a unique product that combines our Cyto fluorescent dyes and gold
Super Resolution Microscopy - Breaking the Diffraction Limit Radiological Research Accelerator Facility
 Super Resolution Microscopy - Breaking the Diffraction Limit Radiological Research Accelerator Facility Sabrina Campelo, Dr. Andrew Harken Outline Motivation Fluorescence Microscopy -Multiphoton Imaging
Kazuki N. Sugahara, Tambet Teesalu, Priya Prakash Karmali, Venkata Ramana Kotamraju, Lilach
 Cancer Cell, Volume 16 Supplemental Data Tissue-Penetrating Delivery of Compounds and Nanoparticles into Tumors Kazuki N. Sugahara, Tambet Teesalu, Priya Prakash Karmali, Venkata Ramana Kotamraju, Lilach
A legacy of innovation and discovery
 A legacy of innovation and discovery CellInsight CX7 LZR High Content Analysis Platform Quantifiably brilliant data Since the introduction of Thermo Scientific ArrayScan High Content Analysis (HCA) Readers
Supplementary Figure S1. FESEM images of NOF-1 and NOF-2. Samples of
 a d b e c f Supplementary Figure S1. FESEM images of NOF-1 and NOF-2. Samples of NOF-1 (a, b, c) and NOF-2 (d, e, f) were obtained by repeatedly spin casting (2000 rpm) methanolic NOF suspensions on 22
SUPPLEMENTAL INFORMATION: 1. Supplemental methods 2. Supplemental figure legends 3. Supplemental figures
 Supplementary Material (ESI) for Lab on a Chip This journal is The Royal Society of Chemistry 2008 A microfluidics-based turning assay reveals complex growth cone responses to integrated gradients of substrate-bound
Confocal Microscopy of Electronic Devices. James Saczuk. Consumer Optical Electronics EE594 02/22/2000
 Confocal Microscopy of Electronic Devices James Saczuk Consumer Optical Electronics EE594 02/22/2000 Introduction! Review of confocal principles! Why is CM used to examine electronics?! Several methods
NEWTON 7.0 BIOLUMINESCENCE & FLUORESCENCE IMAGING IN VIVO - IN VITRO IMAGING
 NEWTON 7.0 BIOLUMINESCENCE & FLUORESCENCE IMAGING IN VIVO - IN VITRO IMAGING The NEWTON s protocol driven image acquisition is as quick as it is intuitive: adjust your exposure, save, print or quantify.
D e c N o. 2 8
 D e c. 2 0 0 7 N o. 2 8 CONFOCAL APPLICATION LETTER resolution FRET Acceptor Photobleaching LAS AF Application Wizard FRET with Leica TCS SP5 LAS AF Version 1.7.0 Introduction Fluorescence Resonance Energy
Superresolution Pattern Recognition Reveals the Architectural Map of the
 Supplementary Information Superresolution Pattern Recognition Reveals the Architectural Map of the Ciliary Transition Zone T. Tony Yang a, Jimmy Su b, Won-Jing Wang c, Branch Craige d, George B. Witman
Supplementary Table 1. Components of an FCS setup (1PE and 2PE)
") Supplementary Table 1. Components of an FCS setup (1PE and 2PE) Component and function Laser source Excitation of fluorophores Microscope with xy-translation stage mounted on vibration isolated optical
Supplementary Table 1. Components of an FCS setup (1PE and 2PE) Component and function Laser source Excitation of fluorophores Microscope with xy-translation stage mounted on vibration isolated optical
Supporting Information for. Electrical control of Förster energy transfer.
 1 Supporting Information for Electrical control of Förster energy transfer. Klaus Becker 1, John M. Lupton 1*, Josef Müller 1, Andrey. L. Rogach 1, Dmitri V. Talapin, Horst Weller & Jochen Feldmann 1 1
Multiphoton Microscopy: Seeing deeper and clearer
 Multiphoton Microscopy: Seeing deeper and clearer Since the invention of simple microscope by Leuwenhoek and Hooke in the 17th century, different types of light microscopy techniques (such as phase contrast,
T H E J O U R N A L O F C E L L B I O L O G Y
 T H E J O U R N A L O F C E L L B I O L O G Y Supplemental material Monteiro et al., http://www.jcb.org/cgi/content/full/jcb.201306162/dc1 Figure S1. 3D deconvolution microscopy analysis of WASH and exocyst
Imaging the immune system with a Two photon (2P) microscope
 microscope") Imaging the immune system with a Two photon (2P) microscope QuickTime et un décompresseur Cinepak sont requis pour visionner cette image. Main advantages of 2P microscopy : 1/ Deep penetration into tissue
Imaging the immune system with a Two photon (2P) microscope QuickTime et un décompresseur Cinepak sont requis pour visionner cette image. Main advantages of 2P microscopy : 1/ Deep penetration into tissue
Bi177 - Lecture 13 Microscopy Outside the Box. Fluorescence Nanoscopy TIRF 4-pi STED STORM/PALM
 Bi177 - Lecture 13 Microscopy Outside the Box Fluorescence Nanoscopy TIRF 4-pi STED STORM/PALM The diffraction limit: Abbe s law The Problem Diffraction limit 100x larger than molecular scale! Green Fluorescent
Laser- and Light-Induced Autofluorescence Spectroscopy of Human Skin in Dependence on Excitation Wavelengths
 Vol. 112 (2007) ACTA PHYSICA POLONICA A No. 5 Proceedings of the International School and Conference on Optics and Optical Materials, ISCOM07, Belgrade, Serbia, September 3 7, 2007 Laser- and Light-Induced
SUPPLEMENTARY INFORMATION
 Measuring subwavelength spatial coherence with plasmonic interferometry Drew Morrill, Dongfang Li, and Domenico Pacifici School of Engineering, Brown University, Providence, RI 02912, United States List
SUPPLEMENTARY INFORMATION
 Biosynthesis of Luminescent Quantum Dots in an Earthworm S.R. Stürzenbaum, a# M. Hoeckner, a# A. Panneerselvam, b J. Levitt, b J.-S. Bouillard, b S. Taniguchi, b L.-A. Dailey, d R. Ahmad Khanbeigi, d E.
Supplementary Figure 1. Thin layer chromatography of R18 salts with different counterions. The mobility of the R18 salts with TPB counterions is much
 Supplementary Figure 1. Thin layer chromatography of R18 salts with different counterions. The mobility of the R18 salts with TPB counterions is much higher with perchlorate, showing their much higher
Cell analysis and bioimaging technology illustrated
 Cell analysis and bioimaging technology illustrated The Cell Analysis Center Scientific Bulletin Part 1 Sysmex has been studying and exploring principles of automated haematology analysers, making full
Fs- Using Ultrafast Lasers to Add New Functionality to Glass
 An IMI Video Reproduction of Invited Lectures from the 17th University Glass Conference Fs- Using Ultrafast Lasers to Add New Functionality to Glass Denise M. Krol University of California, Davis 17th
 Page 1 of 9 Fundamentals and Applications in Multiphoton Excitation Microscopy Two-photon excitation microscopy (also referred to as non-linear, multiphoton, or two-photon laser scanning microscopy) is
Fast, three-dimensional super-resolution imaging of live cells
 Nature Methods Fast, three-dimensional super-resolution imaging of live cells Sara A Jones, Sang-Hee Shim, Jiang He & Xiaowei Zhuang Supplementary Figure 1 Supplementary Figure 2 Supplementary Figure 3
Supplementary Fig. 5
 Supplementary Fig. 5 Supplemental Figures legends Supplementary Figure 1 (A) Additional dot plots from CyTOF analysis from untreated group. (B) Gating strategy for assessment of CD11c + NK cells frequency
CENTER FOR BRAIN EXPERIMENT
 CENTER FOR BRAIN EXPERIMENT Section of Brain Structure Associate Professor: ARII, Tatsuo, PhD 1967 Graduated from Tohoku University, Faculty of Science. Completed the doctoral course in Engineering, Nagoya
SUPPORTING INFORMATION
 Electronic Supplementary Material (ESI) for Dalton Transactions. This journal is The Royal Society of Chemistry 2015 Terbium-Based Time-Gated Förster Resonance Energy Transfer Imaging for Evaluating Protein-Protein
[A complex community of T cells, B cells, NK, DC monocytes,neutrophils, etc.] Lymphocyte Communication Does not Obey at least one Aristotelian Ideal:
![[A complex community of T cells, B cells, NK, DC monocytes,neutrophils, etc.] Lymphocyte Communication Does not Obey at least one Aristotelian Ideal:](/thumbs/93/114465749.jpg "[A complex community of T cells, B cells, NK, DC monocytes,neutrophils, etc.] Lymphocyte Communication Does not Obey at least one Aristotelian Ideal:") [A complex community of T cells, B cells, NK, DC monocytes,neutrophils, etc.] Lymphocyte Communication Does not Obey at least one Aristotelian Ideal: Broadcast An entire city should be of a sufficiently
[A complex community of T cells, B cells, NK, DC monocytes,neutrophils, etc.] Lymphocyte Communication Does not Obey at least one Aristotelian Ideal: Broadcast An entire city should be of a sufficiently
Shining the light into the brain
 Shining the light into the brain To cite this version:. Shining the light into the brain. Master. France. 2011. HAL Id: sfo-00658672 https://hal-sfo.ccsd.cnrs.fr/sfo-00658672 Submitted on
Silica/Porphyrin Hybrid Nanotubes for In Vivo Cell Tracking
 Electronic Supplementary Information Silica/Porphyrin Hybrid Nanotubes for In Vivo Cell Tracking by Near-Infrared Fluorescence Imaging Koichiro Hayashi,* Michihiro Nakamura and Kazunori Ishimura Department
Photoacoustic imaging of vascular networks in transgenic mice
 Photoacoustic imaging of vascular networks in transgenic mice J.G. Laufer 1, J.O. Cleary 1,2, E.Z. Zhang 1, M.F. Lythgoe 2, P.C. Beard 1 1. Department of Medical Physics and Bioengineering, University
High Throughput Whole Organ Imaging Based on Multifocal Multiphoton Microscope
 High Throughput Whole Organ Imaging Based on Multifocal Multiphoton Microscope LBRC researchers: Peter So, Jae Won Cha, Elijah Yew, Vijay Singh External technology collaborators: Prof. Hanry Yu (University
Visualisation, Sizing and Counting of Fluorescent and Fluorescently-Labelled Nanoparticles
 Visualisation, Sizing and Counting of Fluorescent and Fluorescently-Labelled Nanoparticles Introduction Fluorescent molecules have long been used to specifically label particular structures and features
Quantitative Imaging of Tumor Associated Macrophages and Their Response to Therapy Using 64Cu-Labeled Macrin
 Supporting Information for Quantitative Imaging of Tumor Associated Macrophages and Their Response to Therapy Using 64Cu-Labeled Macrin Hye-Yeong Kim 1,2+, Ran Li 1+, Thomas S.C. Ng 1, Gabriel Courties
Resolution of Microscopes Visible light is nm Dry lens(0.5na), green(530nm light)=0.65µm=650nm for oil lens (1.4NA) UV light (300nm) = 0.13µm f
, green(530nm light)=0.65µm=650nm for oil lens (1.4NA) UV light (300nm) = 0.13µm f") Microscopes and Microscopy MCB 380 Good information sources: Alberts-Molecular Biology of the Cell http://micro.magnet.fsu.edu/primer/ http://www.microscopyu.com/ Approaches to Problems in Cell Biology
Microscopes and Microscopy MCB 380 Good information sources: Alberts-Molecular Biology of the Cell http://micro.magnet.fsu.edu/primer/ http://www.microscopyu.com/ Approaches to Problems in Cell Biology
Photon Upconversion Sensitized Nanoprobes for
 Electronic Supplementary Material (ESI) for Nanoscale. This journal is The Royal Society of Chemistry 2014 Supporting Information Photon Upconversion Sensitized Nanoprobes for Sensing and Imaging of ph
Widefield Microscopy Bleed-Through
 In widefield microscopy the excitation wavelengths which illuminate the sample, and the emission wavelengths which reach the CCD camera are selected throughout a filter cube. A filter cube consists of
NEWTON 7.0 BIOLUMINESCENCE & FLUORESCENCE IMAGING IN VIVO - IN VITRO IMAGING
 NEWTON 7.0 BIOLUMINESCENCE & FLUORESCENCE IMAGING IN VIVO - IN VITRO IMAGING SMART IMAGING SYSTEM The NEWTON 7.0 system combines high sensitivity with advanced animal-handling features and userfriendly
Methods Western blot analysis of plg Quantification of plasminogen accumulation by ELISA Immunohistochemical analysis
 Methods Western blot analysis of plg Wild-type mice first received a standardized burn wound and then were intravenously administered 2 mg of human plg (Omnio AB, Umeå, Sweden). 24 hours after wounding
Detecting Gene Expression In-Vivo Using Differential Laser. Absorption. Senior Thesis - Physics, May By Hermonta M Godwin
 Detecting Gene Expression In-Vivo Using Differential Laser Absorption Senior Thesis - Physics, May 2002 By Hermonta M Godwin Advisor: Professor William E. Cooke College of William and Mary Abstract: The
Biophotonics I W. Petrich
 Biophotonics I W. Petrich Slides of lecture #6 November 20 th, 2017 http://www.kip.uni-heidelberg.de/biophotonik/teaching Lecture Biophotonics I will be credited with 2 CP subject to successfully passing
Contact Details. Dr Alexander Galkin. Office: MBC Room 186. Tel: (028) Frequency and wavelength.
 Frequency and wavelength.") Contact Details The electromagnetic spectrum Biological Spectroscopy Dr Alexander Galkin Email: a.galkin@qub.ac.uk Dr Alexander Galkin MSc Biomolecular Function - BBC8045 Office: MBC Room 186 Tel: (028)
Contact Details The electromagnetic spectrum Biological Spectroscopy Dr Alexander Galkin Email: a.galkin@qub.ac.uk Dr Alexander Galkin MSc Biomolecular Function - BBC8045 Office: MBC Room 186 Tel: (028)
Imaging of Cells using fluorescents dyes. By: Josué A. Benjamín Rivera September 27, 2018
 Imaging of Cells using fluorescents dyes By: Josué A. Benjamín Rivera September 27, 2018 1 History Sir William Henry Perkin BRITISH CHEMIST In 1856, at the age of 18, William Henry Perkin set out with
SUPPLEMENTARY FIGURES
 SUPPLEMENTARY FIGURES Supplementary Figure S1. Generation of a synaptobrevin2-mrfp knock-in mouse. (a) Targeting strategy of Syb2-mRFP knock-in mouse leaving the synaptobrevin2 gene locus intact except
Super Resolution Imaging Solution Provider. Imaging Future
 Super Resolution Imaging Solution Provider Imaging Future Imaging Solution More Than Equipment NanoBioImaging(NBI) is the Industrial Partner of HKUST Super Resolution Imaging Center (SRIC). NBI aims to
Supplementary Figure 1. Serial deletion mutants of BLITz.
 Supplementary Figure 1 Serial deletion mutants of BLITz. (a) Design of TEVseq insertion into J -helix. C-terminal end of J -helix was serially deleted and replaced by TEVseq. TEV cleavage site is labeled
TRIPLE (Insulin, Glucagon and EGFP) Immunofluorescence Staining Protocol in Pancreas Woogyun Choi 1, Randal J. Kaufman 2 and Sung Hoon Back 3*
 Immunofluorescence Staining Protocol in Pancreas Woogyun Choi 1, Randal J. Kaufman 2 and Sung Hoon Back 3*") TRIPLE (Insulin, Glucagon and EGFP) Immunofluorescence Staining Protocol in Pancreas Woogyun Choi 1, Randal J. Kaufman 2 and Sung Hoon Back 3* 1 School of Biological Sciences, University of Ulsan, Ulsan,
TRIPLE (Insulin, Glucagon and EGFP) Immunofluorescence Staining Protocol in Pancreas Woogyun Choi 1, Randal J. Kaufman 2 and Sung Hoon Back 3* 1 School of Biological Sciences, University of Ulsan, Ulsan,
Propidium Iodide. Catalog Number: Structure: Molecular Formula: C 27H 34I 2N 4. Molecular Weight: CAS #
 Catalog Number: 195458 Propidium Iodide Structure: Molecular Formula: C 27H 34I 2N 4 Molecular Weight: 668.45 CAS # 25535-16-4 Physical Description: Dark red crystals Description: Reagent used for the