Advances in Nutrigenomics research: Novel and future analytical. approaches to investigate the biological activity of natural
|
|
|
- Kelly Oliver
- 6 years ago
- Views:
Transcription
1 Advances in Nutrigenomics research: Novel and future analytical approaches to investigate the biological activity of natural compounds and food functions V. García-Cañas, C. Simó, C. León, A. Cifuentes* Institute of Industrial Fermentations (CSIC), Juan de la Cierva 3, Madrid, Spain Keywords: Nutrigenomics, Transcriptomics, Proteomics, Metabolomics, Systems Biology. *Corresponding author: 1
2 ABSTRACT In recent years, nutrition research has moved from classical epidemiology and physiology to molecular biology and genetics. Following this trend, Nutrigenomics has emerged as a novel and multidisciplinary research field in nutritional science that aims to elucidate how diet can influence human health. It is already well-known that bioactive food compounds can interact with genes affecting transcription factors, protein expression and metabolite production. The study of these complex interactions requires the development of advanced analytical approaches combined with bioinformatics. Thus, to carry out these studies Transcriptomics, Proteomics and Metabolomics approaches are employed together with an adequate integration of the information that they provide. In this article, an overview of the current methodologies and a thorough revision of the advances in analytical technologies and their possibilities for future developments and applications in the field of Nutrigenomics is provided. 2
3 1. Introduction to Nutrigenomics. 2. Advances in Transcriptomics. 2.1 Gene expression microarray technology Sequencing-based technologies Bioinformatics and Gene Ontology database. 3. Advances in Proteomics. 3.1 Bottom-up approach, 3.2 Top-down approach. 3.3 Other proteomic approaches 4. Advances in Metabolomics Analytical techniques in Metabolomics Data analysis in Metabolomics. 5. Systems Biology. 6. Future needs and developments in Nutrigenomics. 3
4 1. Introduction to Nutrigenomics. Diet is a key environmental factor affecting health and the incidence of many chronic diseases [1]. Nutrition research has traditionally explored the importance of this relation by classical approaches based on human intervention studies and the use of biomarkers. The effects of nutrient deficiencies, imbalance of macronutrients or toxic concentrations of certain food compounds on health have been main topics in Nutrition research [2, 3]. On the other hand, other bioactive food constituents such as certain polyphenols, vitamins, carotenoids and terpenoids have significant beneficial effects for health promotion and disease prevention by reducing the process of sustained inflammation that accompanies chronic disease [4, 5]. Most foods are composed of diverse constituents, many of which have specific biological activity. Owing to the lack of effective analytical approaches that take into account multiple aspects of the biological effects of food compounds, little is known about their molecular functions and the biological processes involved. In addition to this, bioactive food compounds also interact with each other, making even more difficult any effort to identify their biological activity [6]. Nowadays, it is recognized that understanding the effect of diet on health requires the study of the mechanisms of nutrients and other bioactive food constituents at the molecular level. This is supported by the increasingly growing number of studies in humans, animals and cell cultures demonstrating that nutrients and other bioactive compounds in food can regulate gene expression in diverse ways [7]. More specifically, nutrients and other bioactive food constituents have been referred to as signals that are detected by cellular sensor systems and affect the expression of the genome at several levels (mrna and proteins) and subsequently, the production of metabolites [8, 9]. These aspects have motivated current trends in Nutrition research to study how diet affects the balance between health and disease by altering the expression of an individual's genetic makeup (Nutrigenomics) or how the genetic variability among individuals can influence their predisposition to suffer specific illness related to diet as e.g., obesity (Nutrigenetics). As a consequence, Nutritional Genomics (Nutrigenomics and Nutrigenetics) has emerged as a new field that focuses on the study of the interaction between nutrition and human genome [10, 11]. The topic of this review, Nutrigenomics, 4
5 focuses on the study of the impact of specific nutrients and diets on health through the expression of genetic information by the integration of omics technologies such as Transcriptomics, Proteomics and Metabolomics [12, 13]. One of the main interests in Nutrigenomics research relates to health and prevention of chronic diseases (such as e.g., cardiovascular diseases, metabolic syndromes, cancer, etc) through diet. These disorders are complex and multifactorial in their origin, involving genetic factors but also a number of behavioural and environmental factors such as exposure to certain food components [14]. Also, it has been underlined the importance of the biological homeostasis maintenance for disease prevention. The loss of homeostasis and altered biochemical composition of cells and tissues can be primary cause in disease [15]. In line with this, there is a necessity for understanding the molecular mechanisms that describe homeostasis at biochemical, cellular and organ levels, associated with a healthy status and how diet affects this homeostatic control [16]. As a result, there is a need for molecular biomarkers that allow early detection of the onset of disease or, ideally, the pre-disease state [3]. These early effect biomarkers should accurately reflect subtle changes in homeostasis and the efforts of the body to maintain it [16]. However, the discovery of such biomarkers is not easy since diet-gene interactions are complex. Unlike the comparative simplicity of the single-gene disorders, chronic diseases are likely the result of multiple genes and multiple variants of each gene interacting with multiple environmental factors, each combination making a relatively small contribution to overall homeostasis, function and health. Thus, to determine health status and reflecting the functional response to a bioactive food component [8], complete biomarker profiles of gene expression, protein expression and metabolite production will be more useful than single markers. To do this, the availability of advanced analytical techniques will be essential for the investigation of complete biomarker profiles of gene expression, protein expression and metabolite production. 5
6 The mentioned profiles can be considered as 'dietary signatures' that Nutrigenomics will use to understand the cellular functions of nutrients and other active food components and how they affect homeostasis in specific tissues within the whole organism. To attain this, Nutrigenomics makes use of an integrated analytical approach including the latest developments in high-throughput omics techniques for the comprehensive study of different aspects of this biological complexity. This integrated analytical approach puts together Transcriptomics, Proteomics and Metabolomics, and might also be ideal for elucidating the effects of novel functional foods and nutraceuticals on global expression of genetic information and cell function without making assumptions about what to look for in terms of risk, and providing new means for discovering biomarkers for efficacy testing of bioactive functional food ingredients [1]. The development of Genomics, Transcriptomics, Proteomics and Metabolomics [17] has created extraordinary opportunities for increasing our understanding about (i) the biochemical, molecular and cellular mechanisms that underlies the beneficial or adverse effects of certain bioactive food components; (ii) the identity of genes that are involved in the previous stage to the onset of the disease, and therefore, possible molecular biomarkers; and (iii); the effect of bioactive food constituents on crucial molecular pathways [8, 18]. In the following sections, the main characteristics of these omics techniques and their use in Nutrigenomics are reviewed. 2. Advances in Transcriptomics. In the expression process of genomic information, several steps may be regulated by nutrients and other bioactive compounds in food. Consequently, the analysis of changes in mrna expression by nutrients and bioactive food constituents is often the first step to study the flow of molecular information from the genome to the proteome and metabolome and one of the main goals in Nutrigenomics research [8]. For years, the expression of individual genes has been determined by quantification of mrna with Northern blotting. This classical technique has gradually been replaced by more sensitive techniques such as real-time PCR. Both techniques, however, can only analyse gene 6
7 expression for a limited number of candidate genes at a time. This is an important limitation for their application in Nutrigenomics research since the analysis of a reduced number of genes may not provide insights about the causative relationship between the bioactive food constituent and its biological effect [19]. On the opposite, the analysis of global gene expression may offer better opportunities to identify the effect of bioactive food constituents on metabolic pathways and homeostatic control and how this regulation is potentially altered in the development of certain chronic diseases [13]. In the past decade, two conceptually different analytical approaches have emerged to allow quantitative and comprehensive analysis of changes in mrna expression levels of hundreds or thousands of genes. One approach is based on microarray technology, and the other group of techniques is based on DNA sequencing [20]. 2.1 Gene expression microarray technology. During the last years, owing to the extensive optimization and standardization, gene expression microarray has become a leading analytical technology in Nutrigenomics research for the investigation of the interactions between nutrients and other bioactive food compounds and genes [15, 19, 21]. Typically, DNA microarrays are collections of oligonucleotides or probes, representing thousands of genes, attached to a substrate, usually a glass slide, at predefined locations within a grid pattern. This technique is based on specific nucleic acids hybridization and it can be used to measure the relative quantities of specific mrnas in two or more samples for thousands of genes simultaneously. Regardless the platform used for the analysis, the typical experimental procedure is based on the same analytical steps: RNA is extracted from a source of interest (tissue, cells, or other materials), labelled with a detectable marker (typically, fluorescent dye) and allowed to hybridize to the microarrays with individual DNA sequences hybridizing to their complementary gene-specific probes on the 7
8 microarray. Once hybridization is complete, samples are washed and imaged using a confocal laser scanner (Figure 1). Theoretically, the fluorescent signal of derivatized-nucleic acids bound to any probe is a function of their concentration. The relative fluorescence intensity for each gene is extracted and transformed to a numeric value [22]. Gene expression microarrays are powerful, but variability arising throughout the measurement process can obscure the biological signals of interest. In order to fully exploit the possibilities of DNA microarrays, a careful study of the experimental design is required [23]. Data acquisition and preprocesing are important post-technical steps in microarray experiments. The latter involves data normalization, which consists of adjusting the individual hybridization intensities in order to remove variation derived from unequal quantities of starting RNA, differences in labelling or detection efficiencies between the fluorescent dyes used, and systematic biases in the measured expression levels. The most common approaches adopted for normalization are total intensity normalization, Locally Weighted Scatterplot Smoothing (LOWESS) and the use of housekeeping genes [24, 25]. Differences in precision, sensitivity, or specificity between different microarray platforms, makes comparisons between experimental platforms unreliable. Moreover, the annotations across different platforms are not represented by exactly the same gene sequence regions. In order to alleviate in part cross-comparison problems among distinct microarray platforms, the Microarray Gene Expression Data (MGED) organization [26] has established Minimum Information About a Microarray Experiment (MIAME) guidelines for microarray data annotation and reporting. These guidelines, aimed to improve the data sharing between platforms, have been adopted by a number of scientific journals. Furthermore, in an effort to make MIAME-compliant data publicly available, the ArrayExpress microarray database [27] has been created as a repository for Transcriptomics experimental data. In addition, this database accepts processed data files generated with the very recent RNA-Seq technologies that will be discussed later. Also, ArrayExpress Atlas [28] is a recent tool developed to allow the user to query for conditions-specific gene expression across multiple data sets within the increasingly growing ArrayExpress database [29]. 8
9 The analysis of the vast amount of microarray data for extracting biologically meaningful information is perhaps the most challenging and daunting tasks [30]. The fundamental goal of microarray expression profiling is to identify genes that are differentially expressed in the condition of interest [31]. Data analysis process can be divided into three main parts: Identification of significantly regulated genes, identification of global patterns of gene expression, and determination of the biological meaning of both individual genes and group genes. First, filtering criteria, including fold change and statistical significance determined by comparison statistics is necessary in order to identify candidate genes that are differentially expressed. After filtering data, the differentially expressed genes are then classified into discrete groups or clusters, based on expression pattern. This step allows the identification of groups of co-regulated genes. To achieve this, sophisticated bioinformatics tools such as unsupervised clustering, principal component analysis and self-organizing maps are the most widely used [32, 33]. Most of microarray studies published to date corroborate the gene expression data by an alternative sensitive technique. In general, there is a good correlation between microarray results and other more traditional methods, indicating the ability of the technology to produce reliable results [33]. The validation is generally performed by analysing a selection of differentially expressed genes of interest in the samples using real-time, quantitative reverse transcriptase polymerase chain reaction (RT-PCR) [35-38], although other methods such as Northern blotting [39], quantitative radioactive in situ hybridization and verification at the level of the protein, through routine western blotting [40], immunohistochemical or immunocytochemical assays has been also used [31, 41]. In RT-PCR analysis, mrna is converted into cdna and subsequently amplified in a PCR by specific primers in the presence of a fluorescent dye or internal probes. The expression level of the target gene is computed relative to the expression level of one or more reference genes, often housekeeping genes. Selecting proper housekeeping genes is one of the most critical aspects of the analysis, since they need to be constantly expressed between all samples and conditions in the experiment. In a recent study, the application of a 96-well plate PCR-array analysis for validation of microarray data suggested that most 9
10 differences between the results obtained by two different technologies were attributed to saturation problems in the microarray, strict quality criteria for array-pcr data analysis, and possible differences in isoforms detected by the two technologies [21]. Early applications of microarray to Nutrigenomics were related to the effects of caloric restriction on aging [42-45]. Soon, the technology was extended to study other interesting aspects in Nutrigenomics including the effects of dietary protein in the gene expression of cells [46, 47], the mechanisms dietary long chain polyunsaturated fatty acids in molecular function cancer and normal cells [48, 49] and the effects on transcriptome of a high- or low-carbohydrate intake [50, 51]. The molecular mechanisms of certain bioactive food constituents have also been investigated by microarray technology. A summary of some representative applications of microarray in Nutrigenomics field is given in Table Sequencing-based technologies. In contrast to microarray technology, sequencing-based techniques consist of counting tags of DNA fragments to provide digital representation of gene expression levels using sequencing. These techniques include Serial Analysis of Gene Expression (SAGE) [57] and some of its variants, including LongSAGE [58], Cap Analysis of Gene Expression (CAGE) [59], Gene Identification Signature (GIS) [60]. In SAGE-based methods, the abundance of a particular mrna species is estimated from the count of tags derived from one of its ends. First, restriction enzymes are used to obtain short tags of bp, usually derived from one end of an mrna, which are then concatenated, cloned and sequenced to determine the expression profiles of their corresponding mrnas. Despite the more statistical robustness and less stringent standardization and replication requirements than those used for microarrays, the size of the sample tags should be increased in order to improve the precision and accuracy for detecting rare mrnas [61]. Unfortunately, most of these methods are based on expensive Sanger sequencing method and, therefore, sequenced SAGE library rarely exhibits saturating tag counts that would indicate complete representation of the cellular transcriptome [62]. An additional limitation of these techniques is that owing to short length, many 10
11 SAGE tags are shared by the transcripts from different genes, which can complicate gene identification [63]. Moreover, the many PCR amplifications, cloning and bacterial cell propagations that these techniques involve may result in a quantitative bias for different tags [64]. Massively Parallel Signature Sequencing (MPSS) is a more sophisticated clone-and-count technique that also generates small tags of each mrna species; however, it uses a different strategy that does not involve propagation in bacteria neither Sanger sequencing [62]. Nevertheless, the MPSS technology has been restricted to only a few specialized laboratories [64]. In the past few years, the development of next-generation sequencing methods, also referred to as either massive parallel or ultra-deep sequencing, is changing the way in which gene expression is studied [20, 65]. These novel technologies have had an enormous impact on research in a short time period, and it is likely to increase further in the future. Although they have not been applied in Nutrigenomics yet, their potential is underlined by their adoption in studies of transcriptomes during physiological changes, and for the comparative analysis between different disease states or conditions [66]. Next-generation sequencing technologies apply distinct concepts and procedures aimed to increase sequencing throughput in a cost-effective and rapid manner. Last advances in emulsion PCR and noncloning based methods for DNA amplification, together with improved imaging instruments have facilitated the development of sequencers capable of reading up to tens of million of bases per run in a massively parallel fashion [67-69]. The read lengths typically achievable by these technology range from 30 to 300 bp, depending on the sequencing platform used. These short reads will represent a challenge for either mapping them to reference genome or de novo assembling without genomic reference [69]. The new features of next-generation sequencers have stimulated the development of new techniques that have expanded their applications, for example, to comprehensively map and quantify transcriptomes, which with Sanger sequencing would not have been economically or logistically 11
12 practical before [70, 71]. Similarly to the concept adopted in SAGE and MPSS, the principle behind these novel techniques for Transcriptomics, which have been termed RNA-Seq methods, is based on a global sequence census approach. Generally, a complex RNA sample is converted to a library of cdna with adaptors attached to one or both ends. cdna molecules, with or without amplification (depending on the sequencing platform), are subjected to massively parallel sequencing in short reads without bacterial cloning as a pre-requisite. Following sequencing, powerful bioinformatics tools are needed in order to align the resulting short reads ( bp), depending on the sequencing platform and method used, to a reference genome or reference transcripts. That is, with reference genomes available, short reads are sufficient to map their locations rather than sequencing the entire large genome. Once mapped, the sequence hits are counted to determine their density and distribution and then, quantify the gene expression [72]. RNA-Seq is still a technology under active development that is being evaluated in multiple laboratories for RNA profiling [73-77] and other applications such as discovery of small RNAs, mapping RNA splice isoforms and discovery of small RNAs [78-80] Bioinformatics and Gene Ontology database. As mentioned, high-throughput technologies in transcriptomics usually generate large lists of differentially expressed genes as final output. However, the biological interpretation of such results is very challenging. Over the last years, the use of biological knowledge accumulated in public databases by means of bioinformatics, allows to systematically analyse large gene lists in an attempt to assemble a summary of the most enriched and significant biological aspects [81]. The principle behind enrichment analysis is that if a certain biological process is occurring in a given study, the cofunctioning genes involved should have a higher (enriched) potential to be selected as a relevant group by high-throughput screening technologies. This approach increases the probability for researchers to identify the correct biological processes most pertinent to the biological mechanism under study [82]. Thus, a variety of high-throughput enrichment tools (e.g. DAVID, Onto-Express, FatiGO, GOminer, EASE, ProfCom, etc.) have been developed since 2002 in order to assist microarray end user to understand the biological mechanisms behind the large set of regulated genes. These bioinformatics 12
13 resources systematically map the list of interesting (differentially expressed) genes to the associated biological annotation terms and then statistically examine the enrichment of gene members for each of the terms by comparing them to a control (or reference). A recent work by Leong et al. shows the potential of exploiting bioinformatics tools for extracting valuable biological information from microarray experiments. In their work, the use of Affymetrix microarray platform and stringent data analysis provided interesting insights into a homeostatic mechanism, based on arginine-sensitive regulation that coordinates aspects related to nutrient availability in hepatic cells [38]. Enrichment analysis would not be possible without appropriately structured databases such as Gene Ontology [83]. More specifically, Gene Ontology provide a systematic and controlled language, or ontology, for the consistent description of attributes of genes and gene products, in three key biological domains that are shared by all organisms: molecular function, biological process and cellular component. Thus, standard biological phrases, referred to as terms, which are applied to genes and proteins are then, linked or associated with other Gene Ontology terms by trained curators at genome databases [84]. A recent study of the effects of soy isoflavones, based on gene expression microarray data, has revealed potential mechanisms of action for genistein by the combined use of GoMiner as the enrichment tool, Gene Ontology database and information from Dragon Estrogen Responsive Genes Database [24]. In addition to the aforementioned Gene Ontology database, recent enrichment tools also integrate information extracted from other databases as for instance, the Kyoto Encyclopedia of Genes and Genomes (KEGG) pathways (metabolites) in order to improve the comprehensiveness of this type of studies [82]. 3. Advances in Proteomics. The proteome is the set of expressed proteins at a given time under defined conditions, it is dynamic and varies according to the cell type and functional state. In the case of a Nutrigenomic study, the proteome provides a picture of the impact of specific bioactive nutrients and diets in a certain organism, tissue or cell in a particular moment. Thus, the importance of Proteomics as a tool to 13
14 understand the effect of the diet on health has already been recognised by several authors [18, 85-90], however, up to now the application of Proteomics in Nutrigenomics is still rather limited, being the number of review papers higher than research papers [91]. One of the main differences when working with proteins is that there is not an amplification methodology for proteins comparable to PCR. Physical and chemical diversity of proteins are also higher than nucleic acids. They differ among individuals, cell types, and within the same cell depending on cell activity and state. In addition, there are hundreds of different types of posttranslational modifications (PTMs), which evidently will influence chemical properties and functions of proteins. PTMs are key to the control and modulation of many processes inside the cell. The selected analytical strategy for the detection of PTMs will depend on the type of modification: acetylation, phosphorylation, ubiquitination, sumoylation, glycosylation, etc. It is already known that dietary components can also modify the translation of RNA to proteins and the post-translational procedures [92]. Thus, it has been observed that dietary components such as diallyl disulfide, acompound found in processed garlic, has been shown to post-translationally modify proteins [92]. In other cases post-translational regulation of proteins by dietary components can involve the modification of their thiol groups [93]. Another important drawback in the proteome study is the huge dynamic concentration range of proteins in biological fluids or tissues. Namely, a dynamic range has been estimated in serum for protein concentration [94]. This situation causes many detection difficulties due to a large number of proteins are below the level of sensitivity of the most advanced instruments. For this reason, in Proteomics fractionation and subsequent concentration of the proteome is often needed [95, 96]. In a first instance, in order to reduce the complexity of the sample, fractionation of the proteome can be done by differential centrifugation into different populations of organelles [97] and also attending solubility properties into different cellular compartments. The chemical tagging strategies, involving the modification of functional groups of amino acid residues, including PTM in proteins (and peptides) is the methodology of choice when a specific population of the proteome is under study [98]. 14
15 Another strategy for proteome fractionation that is gaining more and more significance is the sequential or simultaneous immuno-affinity depletion of the most-abundant proteins [99]. It has become the alternative in certain application, however, the main drawback regarding this approach is that co-depletion of a certain fraction of the proteome with the abundant proteins can occur. Chromatographic [100] and electrophoretic [101] strategies have also been applied to the prefractionation of the proteome. In general, the main problem of the mentioned strategies is that after fractionation or depletion, the remaining proteins (in case of depletion) or the proteins in the fractions of interest remain dilute, being still in not enough concentration for subsequent analysis. Most recently, it has been described the use of a library of combinatorial ligands, acting by reducing the signal of high-abundance proteins while increasing the level of the low-abundance ones to bring their signal within the detection limit of the present-day analytical instruments [102]. Because of the complexity of proteome the use and development of high-resolving separation techniques as well as highly accurate mass spectrometers is nowadays critical in Proteomics [103, 104]. Currently, more than a single electrophoretic or chromatographic step is used to separate the thousands of proteins found in a biological sample. This separation step is followed by analysis of the isolated proteins (or peptides) by mass spectrometry (MS) via the so-called soft ionization techniques, such as electrospray ionization (ESI) and matrix-assisted laser desorption/ionization (MALDI), combined with the everyday more powerful, easy to use and affordable mass spectrometers. Although Proteomics has been scarcely applied to study the effect of nutrients on health, two fundamental analytical strategies can be employed: the bottom-up and the top-down approach. Both methodologies differ on the separation requirements and the type of MS instrumentation. 3.1 Bottom-up approach. The bottom-up approach is the most widely used in Proteomics since it can apply conventional or modern methodologies. In a conventional approach, large-scale analyses of proteomes is accomplished 15
16 by the combination of two-dimensional gel electrophoresis (2DE) followed by MS analysis [105]. 2DE is the methodology that currently provides the highest protein species resolution capacity with low-instrumentation cost. However, 2DE is laborious, time-consuming and presents low sensitivity, depending strongly on staining and visualization techniques. 2DE has also some limitations to separate highly hydrophobic biomolecules or proteins with extreme isoelectric point or molecular weight values. Moreover, one of the major sources of error in 2DE is gel-to-gel variation. In this sense, the introduction of difference gel electrophoresis (DIGE), in which gel variation is eliminated by loading different samples in the same gel [106], has brought about an important improvement. DIGE methodology is based on the use of novel ultra high sensitive fluorescent dyes (typically, Cy3, Cy5 and Cy2) to label up to three different protein samples that will be separated in the same 2DE run. After image analysis of the 2DE gels, the protein spots of interest are subsequently submitted to an ingel digestion step with a protease enzyme. MS and databases of protein sequences are then use in different ways for protein identification, following: (i) the peptide mass fingerprint (PMF) approach using MS data, in which the molecular masses of the peptides from the protein digest are compared with those simulated of already sequenced proteins, or (ii) by tandem MS in a sequence tag search in which a few peptidic sequences obtained from MS/MS analysis (using collisional activation or some other energy deposition process) can be used to search in protein databases. The main limitation of the bottom-up approach is that information obtained is related to a fraction of the protein, loosing information about PTM. There are limited studies on the effect of specific natural compounds, nutrients or diets on the proteome, being most of them based in the bottom-up approach, more precisely in classical 2DE-MS, although also LC-MS/MS has been applied with this purpose. These studies are summarized in Table 2. Shotgun Proteomics is an advanced bottom-up approach in which a complex protein mixture is digested with endoproteinases of known specifity [119], providing a comprehensive, rapid and automatic identification of complex protein mixtures. In spite of the higher sample complexity due to 16
17 the huge number of peptidic species obtained from the protein mixture hydrolysate, peptides are in general better separated and analyzed by MS than proteins. An essential part of shotgun Proteomics is the use of powerful and highly resolving separation methods prior to MS analysis, allowing the study of complicated biological samples while avoiding suppression ionization problems. Liquid chromatography (LC) [120] and capillary electrophoresis (CE) [121, 122] in their different modes are the main methodologies applicable to the separation of complex peptide mixtures due to their high resolving power and their potential for full automation and high sampling rates. Although physico-chemical diversity of peptides makes them well suited to be separated by different liquid-based separation modes, reversed phase (RP) and aqueous mobile phases are normally used for the chromatography of peptides. Special attention has been put in miniaturization of columns through the reduction of column diameters and sorbent particles, as in the case of ultra performance LC systems (an LC system using sub-2 μm packing columns combined with high operating pressures), as well as the use of instruments capable of delivering nanoliter/min flow rates such us nano-scale liquid chromatography (nlc). On the other hand, CE combined with MS has also come out as an effective strategy for proteomic studies, since CE is a robust system that provides fast and high resolution separations employing inexpensive capillaries [123]. Special attention is currently being paid to the use of CE in microchips since it provides much shorter separation times [124], lower sample and reagent consumption than nlc and CE. Due to the analytical characteristics of these micro-devices further high-throughput in shotgun Proteomics is expected in the near future. To carry out shotgun Proteomics most efforts have been focused on the development of on-line combination of various chromatography and/or electrokinetic separation methods, as well as in multidimensional protein identification technology (MudPIT), coupled with MS or tandem MS [125, 126] (Figure 2). The vast majority is based on the combination of ion exchange chromatography and reversed-phase (RP) chromatography. It has also been described the great potential of monolithic compared to particle-based columns due to monolithic can be used together with higher flows and gradients [127]. This is of special interest in a multidimensional chromatography setup where the 17
18 separation and identification of a vast number of analytes in a short time is mandatory mainly in the second dimension. Other novel couplings have been described, as for instance those based on hydrophilic interaction liquid chromatography (HILIC) [128]. The capabilities of multidimensional systems involving on-line combination of capillary isoelectric focusing (CIEF) with nano-rplc have also been demonstrated to be effective in the analysis of proteins and peptides [129] creating new and encouraging perspectives in the discovery of biomarkers in Nutrigenomics studies. ESI has been the interface of choice to ionize peptides eluted from LC or CE columns and to analyze them by MS: from the lower resolving power ion trap instruments able to generate MS n spectra, to the more advanced hybrid instrumentation such us quadrupole-time of flight (Q-TOF), TOF-TOF and the recently introduced hybrid linear ion trap (LTQ)-Orbitrap (Orbitrap TM ) [130]. Some proteomic studies have also focused on the use of MALDI interface for chromatographic separations and MS. The technical problems generated by the non-atomospheric working conditions required by MALDI interface could be compensated for a lower interference with sample matrix and chromatographic eluents and an improvement on proteome coverage [131]. 3.2 Top-down approach. A growing number of researchers are focusing on the use of top-down Proteomics, a relatively new approach compared to bottom-up, in which structure of proteins is studied through measurement of their intact mass followed by direct ion dissociation in the gas phase [132]. The main advantages over the bottom-up approach are that higher sequence coverage is obtained, it permits the study of PTM and it makes possible to discern between biomolecules with a high degree of sequence identity. Today, Fourier transform ion cyclotron resonance (FTICR) MS offers the highest mass resolution, resolving power, accuracy and sensitivity among present MS technologies [133]. Nevertheless, its high purchase, and maintenance costs, mostly derived from the expensive superconducting magnet and liquid helium supply required, precludes its general use. Thus, a variety of instruments have been 18
19 used for top-down Proteomics, such us MALDI-TOF/TOF, ESI-Q/TOF, ESI-IT and the novel Orbitrap TM, suitable for routine top-down Proteomics as recently reported [134]. In those cases in which the molecular mass of proteins exceeds the analytical power of the mass spectrometer, they can be subjected to a limited proteolysis to produce large polypeptides that are then analyzed employing top-down Proteomic approaches. This has been called the middle-down approach, maintaining the advantages of high sequence coverage and PTM information. A key to the top-down approach is the capacity to fragment intact proteins inside the mass spectrometer. Usually, low-energy multiple collision-induced dissociation (CID) is used, although ultraviolet photodissociation (UVPD) [135], infrared multiphoton dissociation (IRMPD) [136], and blackbody infrared radiative dissociation (BIRD) [137] can be found in literature. Alternative dissociation techniques such us electron capture dissociation (ECDβ) represents one of the most recent and significant advances in tandem MS [138]. This alternative technique is based on the fragmentation of multiple charged protein cations due to interaction with low-energy electrons. A newer dissociation method similar to ECD is electron transfer dissociation (ETD), which also uses charge reduction by electron transfer [139]. Both charge reduction dissociation techniques, ECD and ETD initially used in FTICR-MS and now extended to (LTQ)-Orbitrap instruments provide more extensive sequence fragments over the entire protein backbone preserving the PTM after cleavage, resulting in easier identification of the modification sites. Top-down Proteomics approaches are usually limited to simple protein mixtures since very complex spectra are usually generated by multiple charged proteins. In general, a protein isolate from a previous fractionation or purification step is directly infused to the high-resolution MS. In this regard, due to the capabilities of CE for complex protein separation, CE coupling with high-resolution MS is one of the most promising methodology in top-down studies [140]. However, improved ECD and ETC speed will be needed for future high-throughput CE-MS (and also LC-MS) applications in top-down Proteomics. 19
20 3.3. Other proteomic approaches New Proteomic approaches are under development, with a growing increase of works focused on the detection of protein biomarkers. One of the approaches that is gaining popularity is based on the array technology. Protein microarrays can be composed by recombinant protein molecules or antibodies immobilized in a high-density format on the surface of a substrate material. There are two major classes of protein micro- (or nano-) arrays: analytical and functional protein microarrays, being the antibody-based microarray the most common platform in proteomic studies [141]. This miniaturized arrays can be fabricated with an almost infinite number of antibodies (in the particular case of antibody microarrays) carrying the desired specificities and being capable of simultaneously profiling numerous low-abundant protein analytes in complex proteomes, while consuming only a few microliters of sample. The microarray patterns generated can then be transformed into proteomic maps, or detailed molecular fingerprints, revealing the composition of the proteome. After import data files from the microarray scanning sources and normalization and quantification of protein microarrays, a statistical analysis has to be carried out. Surface enhanced laser desorption ionization time-of-flight mass spectrometry (SELDI-TOF MS), an emerging tool for protein profiling and biomarker discovery applicable to minute amounts of starting material [142] can also be used as a complementary, rapid and high-throughput proteomic approach to identify differentially expressed peptides and proteins and, therefore, can help to save time and research effort in studies about the effect of bioactive food components on the proteome. This technology enables to speed up the process significantly with the capacity to run and analyze several hundreds samples in parallel per day. Different SELDI chip types have different surfaces, depending on the type of proteins to be analyzed, range from chromatographic chemistries, to surfaces with a specific biomolecular affinity (e.g. antibodies, receptors, enzymes and ligands) that bind one specific protein or group of proteins. The efficacy of the SELDI-TOF technology has been proved in the analysis of plasma samples (previously fractionated by anion-exchange chromatography) by quickly 20
21 identifying the proteins whose expression changed in response to vitamin A status from retinolsufficient and retinol-deficient rats [143] (Figure 3). 4. Advances in Metabolomics. As defined by Trujillo et al [144], the metabolome can be described as the full set of endogenous or exogenous low molecular weight metabolic entities of approximately < 1000 Da (metabolites), and the small pathway motifs that are present in a biological system (cell, tissue, organ, organism or species). The most common metabolites are amino acids, lipids, vitamins, small peptides or carbohydrates. Metabolites are the real endpoints of gene expression and of any physiological regulatory processes. Therefore, according to some authors [12], any change in metabolite concentration may describe better the biochemical state of a biological system than proteomic or transcriptomic variations. The objective of Metabolomics within the frame of Nutrigenomics is to investigate the metabolic alterations produced by the effect of nutrients or bioactive food constituents in the different metabolic pathways. Its importance not only lays on the information obtained about the molecular events involved in nutrition and how the body adapts through metabolic pathways to different nutrient fluxes, but also on the identification of certain metabolites such as cholesterol or glucose as biomarkers for health or disease status [145]. There are three basic approaches used in Metabolomic research; target analysis, metabolic profiling and metabolic fingerprinting. Target analysis aims the quantitative measurement of selected analytes, such as a specific biomarker or reaction product. Metabolic profiling is a non targeted strategy that focuses on the study of a group of related metabolites or a specific metabolic pathway. It is one of the basic approaches to phenotyping as the study of metabolic profiles of a cell gives a more accurate description of a phenotype [146]. Meanwhile, metabolic fingerprinting does not aim to identify all metabolites, but to compare patterns of metabolites that change in response to the cellular environment [147]. 21
22 Metabolomics has diverse applications such as biomarker discovery, determination of the metabolic effects of environmental changes in the body or early disease detection [148]. The most relevant application of Metabolomics in Nutrigenomics is the possible health benefits provided by the ingest of functional compounds. In this regard, the effects of phytochemicals in human health are the most studied. Some examples are the potential benefits of flavones in heart diseases, of stannols in cholesterol metabolism, and soy-based estrogen analogues in cancer [149]. Because of the extensive consumption of polyphenols in the diet, and its association with health benefits, the biological activity of these compounds is an important topic of investigation in Nutrigenomics [150]. Application of Metabolomics in Nutrigenomics (or Nutritional Metabolomics) is, however, even more complex than in other areas of research. Humans feed on other organisms, each with its own metabolome, so the number of different metabolomes that conform our diet is significant enough to make Nutrigenomics a very complex discipline [151]. Therefore, there are several challenges that Metabolomics has to face in human nutrition. In general, metabolism is dynamic and depends on the different cellular environments and physiological situation, so it is hard to understand the effects separately and to link directly metabolites to genes and proteins [152]. In Nutritional Metabolomics the complex interactions between gut microflora and host metabolism as well as other extrinsic factors such as food habits, diet and other lifestyle parameters give rise to high metabolic variability [ ]. One of the advantages of Nutritional Metabolomics is that there are several accessible body fluids that contain possible biomarkers in human body. To date, most Metabolomics studies in mammals have used urine as the vehicle for investigation and, in the field of Nutrigenomics blood and urine are the most likely candidates for sample choice [157] Analytical techniques in Metabolomics. 22
23 Unlike Transcriptomics or Proteomics, which intend to determine a single chemical class of compounds (mrna or proteins), Metabolomics has to deal with very different compounds of very diverse chemical and physical properties. Moreover, the relative concentration of metabolites in the biofluids vary from millimolar level (or higher) to picomolar, making it easy to exceed the linear range of the analytical technique employed. As no single technique can be expected to meet all these requirements, many Metabolomics approaches can employ several analytical techniques [12, 151]. Metabolomics is an emerging technology, so new analytical techniques and methods are continuously being developed and will continue in the near future in order to achieve its goals. So far, Metabolomics is proving to be very useful for the analysis of metabolic patterns and changes in the metabolism derived from different situations in the cellular environment. This is certainly interesting in the nutrition field as can determine variations in different metabolic pathways due to the consumption of different compounds in the diet. In order to gain a detailed knowledge on human metabolism by means of Metabolomic tools, the ideal steps should be first to elucidate the nature and concentration of the searched metabolites and second to share the information in accessible databases [88] (Figure 4). The two most common analytical techniques used so far in Metabolomics are nuclear magnetic resonance (NMR) and MS. Thus, as a general result it can be stated that the influence of diet in metabolism has been clearly established using these techniques. For example, the effect of diet on urea cycle and purine metabolic pathways was demonstrated using both 1 H-NMR and ion trap MS [158]. Another study involving the use of both 1 H-NMR spectroscopy and high performance liquid chromatography (HPLC) coupled to a Q-TOF MS reported that acute changes in human urinary metabolomic profiles occur after the consumption of dietary phytochemicals [159] Mass spectrometry (MS) approaches. 23
24 MS can be used as a stand alone technique or most commonly combined with a preliminary chromatographic separation technique, either gas chromatography (GC), high performance chromatography (HPLC) with MS (HPLC-MS) or CE-MS [151]. Direct injection is performed for Metabolomics with high or ultra high resolution mass analyzers as TOF-MS (mass accuracy < 10 ppm) or FTICR-MS which provides a mass accuracy < 1 ppm and detection limits lower than attomole or femtomole levels. These characteristics make them ideal tools for metabolomic studies as was shown by Rosello-Mora et al [160] which stated that different strains of Salinibacter ruber could be differentiated by some characteristic metabolites. Hybrid analyzers, as for example Q-TOF, have the advantages of mass accuracy given by a TOF analyzer combined with the possibility to fragment the ions and thus, provide information about the structure of the detected metabolites [161]. These kind of analyzers should lead the metabolomic studies in the near future. As for Proteomics, the most usual ionization techniques are the ones that use atmospheric pressure ionization, especially ESI interfaces, as it can work with a wide range of polarities [162]. Mass accuracy and resolution provided by MS instruments are usually not enough to undoubtedly separate and identify all metabolites in a sample by direct infusion. A complete methodology for metabolite elucidation is provided by Chen et al. [163] in the metabolomic identification of biomarkers of individuals at risk of diabetes. To overcome these limitations MS analyzers are usually coupled to separation techniques for metabolomic studies. Thus, GC-MS are so far the most common couplings for metabolomic studies. A GC-MS method for the analysis of flavonoids, a sub class of polyphenols, in urine and plasma has been developed [164]. In this method, liquid-liquid extraction, derivatization and analysis by GC-TOF-MS have been optimized, providing limits of detection below 0.1 μg/ml for most phenolic acids. This method identified 11 phenolic acids in urine samples whose concentration increased after tea consumption. Apart of GC, other separation techniques have also been successfully coupled to MS instruments to carry out Nutritional Metabolomics. Thus, Yin et al. [165] have recently developed a reliable metabolic profiling method for human serum analysis using a C-18 column coupled to a Q-TOF-MS 24
25 analyzer. The aim of this LC-Q-TOF-MS strategy was to identify potential biomarkers and the metabolic pathways altered by an herbal preparation used to treat some diseases such as cardiovascular problems or cancer. The most recent introduction into the field of separation techniques with enormous potential in Metabolomics research is the ultra performance liquid chromatography coupled to MS (UPLC TM -MS) technology. UPLC TM -MS has been used in the determination of metabolic profiles in human urine [166]. The small particle size and the high pressure allow to reduce analysis time approximately ten times respect to conventional LC while increasing efficiency and maintaining resolution Nuclear magnetic resonance (NMR) approaches. NMR is a high reproducibility technique that has demonstrated its great potential in Metabolomics studies [167]. Using this analytical technique, Wang et al. have studied the relationship between the consumption of chamomile tea and some human biological responses. Statistical differences in three different excreted metabolites between high-resolution 1 H-NMR analyses of urine samples taken before and after chamomile tea consumption were found [168]. In another study, the metabolic profiling approach using high resolution 1 H-NMR spectroscopy has been applied to study metabolite changes in human feces by the intake of grape juice and ethanol-free wine extracts [169] (see Figure 5). This study showed changes in the levels of isobutyrate when the mixture of juice and wine was taken but could not find any difference in the metabolic profile due to the intake of juice. This could be explained through the modulation of microbial gut metabolism produced by the polyphenols present in wine. Metabolic profiling after dietary intervention with soy isoflavones has also been determined by 1 H-NMR differences in lipoprotein, amino acids and carbohydrate levels in plasma from five healthy pre-menopauseal women, thus suggesting a metabolic alteration due to soy consumption. [170]. In another 1 H-NMR study on the effect of soy isoflavones, an improvement in renal function and an increase in the urinary excretion of the osmolyte trimethylamine-n oxide has 25
26 been proven [171]. A summary of main Metabolomic applications in Nutrigenomics field are listed in Table 3. Coupling of NMR with separation techniques is less extended than in MS, but can also give interesting results in Metabolomics. Offline coupling with solid-phase extraction (SPE) or on-line coupling with HPLC are the most extended in metabolomic research. For example HPLC-NMR has been used for the identification of hippuric acid, 3-(3-hydroxyphenyl) propionic acid, and 3-hydroxycinnamic acid in rat urine using reverse phase gradient HPLC coupled with 1 H-NMR [172]. The lack of sensitivity of NMR, in the range of μg, has been one of the main problems of this analytical technique. However, the recent introduction of new instrumentation, like 1 H-detection triple resonance cold probes, or different approaches such as dynamic nuclear polarization, have provided an improvement in detection sensitivity that will increase even further the number of applications of NMR in metabolomic studies [173] Data analysis in Metabolomics. Due to the huge amount of data obtained in metabolomic studies, it has been necessary to develop strategies to convert the complex raw data obtained into useful information. Metabolomic data reduction is normally accomplished using principal component analysis (PCA) or other related techniques. PCA is a tool for exploratory data analysis that determines correlation differences among sample sets, which can be caused by either a biological difference or a methodological bias. It is usually used as a first step to have information about the quality of the data. After data reduction a multivariate analysis is usually performed. The most common is partial least square discriminant analysis (PLS-DA). The aim of PLS-DA is to discriminate the complete peak list and reduce it with the most relevant ones [151]. 26
27 Once an unknown compound is determined, the following challenge is to identify it and determine its biological significance [148]. For this matter, there are different large-scale databases available on the web. One of the most accessed databases available online is KEGG [174]. In particular for Nutritional Metabolomics the most interesting biochemical databases are the ones operated by the European Nutrigenomics Organization [175] that allows to upload and edit scientific information, and the Human Metabolome Database [176, 177], which provides information on more then 2180 metabolites from human. For all these reasons, Metabolomics has been considered in the NIH roadmap as an interesting tool for the overall initiative to carry out possible solutions to human metabolic diseases [88]. 5. Systems Biology. Nutrigenomics has to face important difficulties derived, among others, from food complexity, the large number of different nutrients and bioactive food compounds, their very different concentrations and the numerous targets with different affinities and specificities that they may have. As described above, Transcriptomics, Proteomics and Metabolomics represents powerful analytical platforms developed for the analysis of genes, proteins and metabolites. However, omics platforms need to be integrated in order to obtain optimal means to understand the influences of bioactive food components on the investigated system (e.g., cell, tissue, organ) giving rise to the growing of a new area of biology called Systems Biology. Modern Systems Biology is the analysis of the relationships among the elements in a system in response to genetic or environmental perturbations, with the goal of understanding the system or the emergent properties on the system [ ]. Thus, Systems Biology approaches may encompass molecules, cells, organs, individuals, or even ecosystems and it is regarded as an integrative approach of all information at the different levels of genomic expression (mrna, protein, metabolite). However, in Nutrigenomic studies biologic responses to a bioactive food component may be subtle and, therefore, careful attention will need to be given to the methodologies used to identify these responses. Unlike any reductionist approach that would take these techniques individually, Systems Biology exploits global data sets to derive useful information 27
28 [181]. Each large data set contains sufficient noise to preclude the identification of multiple minor but relevant changes that could be unnoticed without adequate statistical tools since the researcher is focused on the changes that are really significant within the whole data set. Systems Biology, however, by confining the information can provide a filter for distracting noise generated in each individual platform and minimize the data to be interpreted by focusing on only those endpoints common between the various experimental platforms [178, 182]. To achieve this, appropriate statistical models have to be used in order to filter through the large data sets and highlight only those important changes. Although Systems Biology has been scarcely applied in Nutrigenomic studies, their potential is underlined by their adoption by other disciplines. For instance, a Systems Biology approach has been applied to improve our knowledge about carbohydrate metabolism in yeast [178]. In a recent work, Kohanski et al. used the context likelihood of relatedness (CLR) algorithm (gene network analysis) in combination with gene expression microarrays and Gene Ontology-based enrichment analysis to construct and filter gene connectivity maps of bacteria under antibiotic treatment [183]. The gene networks were further enriched with data derived from antibiotic growth high-throughput screening to provide insight into the pathway whereby the antibiotic under study triggers its bactericide action. An adequate Systems Biology approach in Nutrigenomics should provide a holistic view of the molecular mechanisms underlying the beneficial or adverse effects of certain bioactive food components. Also, it should help in the discovery of key genes and proteins that function to regulate metabolic pathways and whose expression is affected by specific bioactive food compounds. This will aid in rapidly identifying new biomarkers for nutritional status and disease progression, and designing a novel concept for dietary prevention and intervention of disease [16]. 6. Future needs and developments in Nutrigenomics. Despite the use of DNA microarrays is a powerful analytical approach, there are technical limitations that have to be addressed for optimal implementation. Some of these problems are associated with the 28
29 high background noise that specially hinders the detection of low signals (i.e., low signal-to-noise ratios). Novel approaches focused on the use of electrochemical transducers in combination with either enzymatic, redox-active indicators, or nanoparticle labels, as well as with label-free hybridization strategies are being investigated as cheaper and sensitive alternatives to current optical detection systems [184, 185]. A second problem is related to the efficiency and specificity of the hybridization reaction that is subject to variability and cross-hybridization and thus, it affects the ability of the technique to accurately detect differences in gene expression levels [41]. In this regard, some interesting alternatives to typical linear probes have been proposed such as molecular beacon probes and peptide nucleic acids [185]. These probes offer high specificity and appear as good candidates for mismatch discrimination. Still, problems derived from element-to-element differences within a microarray and microarray-to-microarray differences need also to be solved [23, 186]. For that, the MicroArray Quality Control (MAQC) Consortium establishes quality control criteria to ensure data quality, to identify critical factors affecting data quality, and to optimize and standardize microarray procedures [187]. Although microarrays is currently the technique of choice for profiling RNA populations under different conditions, some advantages of RNA-Seq over existing technologies make this technique valuable for comprehensive transcriptome studies. First, unlike hybridization-based approaches, which rely on continuous signals, RNA-Seq consists of absolute numbers of reads that provide accurate estimates of the relative abundance of given transcripts and it is exempt from cross-hybridization problems [72, 188]. In addition, dynamic range of expression level in RNA-Seq depends of the sequencing depth total number of all the sequences reads or base pairs represented in the experiment) and it has been reported to be larger (up to five orders of magnitude) than the one provided by microarray scanners (few-hundredfold) [189]. Contrary to microarray, RNA-Seq has very low background signal because DNA sequences can be unambiguously mapped to unique regions of the genome, allowing detection of very low expressed mrna, provided that sequencing depth is sufficient [190]. Another important advantage of RNA-Seq relative to gene expression microarray is their ability to identify, without prior knowledge, spliced transcript isoforms [191] and sequence 29
30 variations such as single nucleotide polymorphisms (SNPs) in the transcribed regions [66]. Despite of these advantages, RNA-Seq currently faces several challenges including those concerning library construction issues, bioinformatics and complete coverage at reasonable costs. RNA-Seq does not require cloning, however, the library construction involves some manipulation stages and procedures that could originate some bias [66]. Also, one of the main limitations of RNA-Seq stems from the short length of the sequence reads provided. For large and complex transcriptomes, mapping the short reads to the reference transcriptome can be complicated, especially if an important fraction of sequence reads match multiple locations in the genome. In such case, longer reads and paired-end read sequencing, based on sequencing both ends of each interrogated DNA fragment, have been proposed to help to alleviate the problem [72]. Sequencing depth is another important aspect that affects sequence coverage (percentage of transcripts surveyed), determines the number of expressed genes and rare spliced isoforms detected and is directly proportional to the sequencing costs [192]. Next-generation methods in Transcriptomics will undoubtedly continue to technically improve in several ways within the next years. New improvements will probably include the establishment of routine data analysis methods and increases in the numbers and lengths of sequence reads as well [193, 194]. Fortunately, the cost is likely to keep falling, allowing next-generation sequencing methods demonstrate full potential for the study of transcriptomes and provide new applications and extensive use of these technologies in Nutrigenomics research. In Proteomics, 2DE, LC, CE and MS have become the most used methodologies. There is an evident need of development of improved or alternative technologies to become into a reality the routine analysis for proteome research. In this sense it has been proved the robustness of MudPIT for the analysis of complex mixtures of peptides; however improvements in the resolution of peptides are desirable to provide increased protein coverage. On the other hand, although much less employed than the methodologies used today in Proteomics, it is expected that relatively new protein microarray technology will play an important role in Proteomics in the near future due to the possibility to simultaneously analyze a large number of different proteins, providing unique opportunities to 30
31 establish interrelationship between dietary components and the development and/or progression of diseases. Apart of the everyday more sophisticated sample treatments and separation techniques, MS is essential for the systematic investigation in Proteomics. Rapid advances in MS instrumentation, both in terms of hardware and software, are improving current technologies and have catalyzed the development of new proteomic approaches. In this sense, conventional mass spectrometers are giving way to the more sophisticated and compact mass spectrometers, most of them hybrid instruments in a combination of two or more analyzers. As can be seen in the low number of proteomic applications in Nutrigenomic studies, it is expected that new innovations in proteomic technology will help proteomic profiling to become standard practice in the Nutrigenomic field. In addition, a great advance in Metabolomics is expected related to the Nutrigenomics field with the incorporation of new interfaces such as desorption electrospray ionization (DESI) [195], SELDI [196], nanostructure-initiator mass spectrometry (NIMS) or with system miniaturization (nanoesi) [197]. These interfaces have the advantage that they need nearly no sample preparation. On the other hand, capillary electrokinetic techniques and their coupling to mass spectrometry (CE and CE-MS) are ideal tools for Metabolomics, due to the wide variety of applications, great efficiency and resolution, and low sample consumption. Although CE and CE-MS have not been widely used, they have already been identified as a very promising tool for metabolomic studies [161, 198, 199]. Thus, CE has been recently used to evaluate the response to vitamin E and D of diabetic rats metabolite urine profile with two different CE approaches (one based in micellar electrokinetic capillary chromatography (MEKC) and another using capillary zone electrophoresis (CZE)). With these new analytical methods it could be proved that the metabolic profile of diabetic rats fed with a mixture of these antioxidants trend to be similar to that from non diabetic control rats [200]. Comprehensive multidimensional techniques, such as GCxGC or LCxLC, are also a revolutionary improvement in separation techniques that will be implemented in Nutritional Metabolomics studies in the near future. They not only provide enhanced resolution and a huge increase in the peak number but also an increase in selectivity and sensitivity in comparison with conventional separation techniques. 31
32 As an example, comprehensive GCxGC coupled to TOF-MS has demonstrated to be a promising tool for metabolic profiling [201], and it has been successfully used for the detection of biomarkers in obese mouse tissue [202]. The challenge in Systems Biology approach is not on the technological level, as great improvements, as discussed here, are being made in the omics technologies. Instead, it will be the bioinformatics side (data processing, clustering, dynamics, integration of the various omics levels, etc.) that will have to progress for systems biology to mature and expand into Nutrigenomics. ACKNOWLEDGEMENTS This work was supported by Projects AGL C03-01 and CONSOLIDER INGENIO 2010 CSD FUN-C-FOOD (Ministerio de Educación y Ciencia). V.G-C. would like to thank CSIC for an I3P postdoctoral grant. CL wants to thank the Comunidad Autonoma de Madrid for a grant. 32
33 REFERENCES [1] R. Elliot, T.J. Ong, Br. J. Med. 324 (2002) [2] B. van Ommen, Nutrition 20 (2004) 4-8. [3] L. Afman, M. Müller, J. Am. Diet. Assoc. 106 (2006) [4] D. Evans, J.B. Hirsch, S. Dushenkov, J. Sci. Food Agric. 86 (2006) [5] N. Chalabi, D.J. Bernard-Gallon, M.P. Vasson, Y.J Bignon, Personalized Med. 5 (2008) [6] T. Mizoguchi, I. Takehara, T. Masuzawa, T. Saito, Y. Naoki, J. Med. Food 11 (2008) [7] M.N. Mead, Environm. Health Persp. 115 (2007) [8] M. Müller, S. Kersten, Nat. Rev. Gen. 4 (2003) [9] Y. Liu, S.L. Sturley, Nutrition 20 (2004) [10] J. Kaput, J.M. Ordovas, L. Ferguson, B. van Ommen, R.L. Rodríguez, L. Allen, B.N. Ames, K. Dawson, B. German, R. Krauss, W. Malyj, M.C. Archer, S. Barnes, A. Bartholome, R. Bir, P. van Bladeren, K.J. Bradford, K.H. Brown, R. Caetano, D. Castle, R. Chadwick, S. Clarke, K. Clément, C.A. Cooney, D. Corella, I.B. Manica da Cruz, H. Daniel, T. Duster, S.O. Ebbesson, R. Elliott, S. Fairweather-Tait, J. Felton, M. Fenech, J.W. Finley, N. Fogg-Johnson, R. Gill-Garrison, M.J. Gibney, P.J. Gillies, J.A. Gustafsson, J.L. Hartman Iv, L. He, J.K. Hwang, J.P. Jais, Y. Jang, H. Joost, C. Junien, M. Kanter, W.A. Kibbe, B. Koletzko, B.R. Korf, K. Kornman, D.W. Krempin, D. Langin, D.R. Lauren, J. Ho Lee, G..A Leveille, S.J. Lin, J. Mathers, M. Mayne, W. McNabb, J.A. Milner, P. Morgan, M. Muller, Y. Nikolsky, F. van der Ouderaa, T. Park, N. Pensel, F. Perez-Jimenez, K. Poutanen, M. Roberts, W.H. Saris, G. Schuster, A.N. Shelling, A.P. Simopoulos, S. Southon, E.S. Tai, B. Towne, P. Trayhurn, R. Uauy, W.J. Visek, C. Warden, R. Weiss, J. Wiencke, J. Winkler, G.L. Wolff, X. Zhao-Wilson, J.D. Zucker, Br. J. Nutrition 94 (2005) [11] H.M. Roche, J. Sci. Food Agr. 86 (2006) [12] G. Rimbach, C. Boesch-Saadatmandi, J. Frank, D. Fuchs, U. Enzel, H. Daniel, W.L. Hall, P.D. Weinberg, Food Chem. Toxicol. 46 (2008) [13] R. Hu, A.T. Kong, Nutrition 20 (2004) [14] J.M. Ordovás, J. Kaput, D. Corella, Mol. Nut. Food Res. 51 (2007) [15] P. Anderle, P. Farmer, A. Berger, M.A. Roberts, Nutrition 20 (2004)
34 [16] B. van Ommen, R. Stierum, Food Biotechnol. 13 (2002) [17] L.R. Ferguson, M. Philpott, P. Dryland, Cell. Mol. Life Sci. 63 (2007) [18] C.D. Davis, J. Milner, Mut. Res. 554 (2004) [19] K. Gohil, A.A. Chakraborty, Nutrition 20 (2004) [20] O. Morozova, M.A. Marra, Genomics 92 (2008) [21] S. Gaj, L. Eijssen, R.P. Mensink, C.T. Evelo, Genes Nutr. 3 (2008) [22] J.J. Storhoff, S,S. Marla, V.G., C.A. Mirkin in: U.R. Müller, D.V. Nicolau (Eds.), Microarray Tecnology and its applications. Springer-Verlag, Berlin, Heidelgerg, 2005, [23] B. Spielbauer, F. Stahl, Mol. Nut. Food Res. 49 (2005) [24] M.D. Niculescu, E.A. Pop, L.M. Fischer and S.H. Zeisel, J. Nutr. Biochem. 18 (2007) [25] P. Stafford, Y. Tak in: P. Safford (Ed.), Methods in microarray normalization, CRC Press, Boca Raton, FL, 2008, pp [26] [27] [28] [29] H. Parkinson, M. Kapushesky, N. Kolesnikov, G. Rustici, M. Shojatalab, N. Abeygunawardena, H. Berube, M. Dylag, I. Emam, A. Farne, E. Holloway, M. Lukk, J. Malone, R. Mani, E. Pilicheva, T.F. Rayner, f. Rezwan, A. Sharma, E. Williams, X.Z. Bradley, T. Adamusiak, M. Brandizi, T. Burdett, R. Coulson, M. Krestyaninova, P. Kurnosov, E. Maguire, S.G. Neogi, P. Rocca-Serra, S.A. Sansone, N. Sklyar, m. Zhao, U. Sarkans, A. Brazma, Nucleic Acids Res. 37 (2009) D868-D872. [30] G. Burton, R.E. McGehee, Nutrition 20 (2004) [31] Dos Santos in: S.Q. Ye (Ed.), Bioinformatics. A practical approach, Chapman & Hall/CRC, Boca Raton, FL, 2008, pp [32] S. Klaus, J. Keijer, Nutrition 20 (2004) [33] F.A. Middleton, E.J. Ramos, Y.Xu. H. Diab, X. Zhao, U.N. Das, M. Menguid, Nutrition 20 (2004) [34] R.D. Canales, Y. Luo, J.C. Willey, B. Austermiller, C.C. Barbacioru, C. Boysen, K. Hunkapiller, 34
35 R.V. Jensen, C.R. Knight, K.Y. Lee, Y. Ma, B. Maqsodi, A. Papallo, E.H. Peters, K. Poulter, P.L. Ruppel, R.R. Samaha, L. Shi, W. Yang, L. Zhang, F.M. Goodsaid, Nat. Biotechnol. 24 (2006) [35] R. Vittal, Z.E. Selvanayagam, Y. Sun, J. Hong, F. Liu, K.V. Chin, C.S. Yang, Mol. Cancer. Ther. 3 (2004) [36] V. Noé, S. Peñuelas, R. M. Lamuela-Raventós, J. Permanyer, C.J. Ciudad, M. Izquierdo-Pulido, J. Nutrition 134 (2004) [37] T. Tsuda, Y. Ueno, T. Yoshikawa, H. Kojo, T. Osawa, Biochem. Pharmacol. 71 (2006) [38] H.X. Leong, C. Simkevich, A. Lesieur-Brooks, B.W. Lau, C. Fugere, E. Sabo Nutr. Metab. 3 (2006) 37. [39] R.K. Thimmulappa, K.H. Mai, S. Srisuma, T.W. Kensler, M. Yamamoto, S. Biswal, Cancer Res. 62 (2002) [40] P. McLoughlin, M. Roengvoraphoj, C. Gissel, J. Hescheler, U. Certa, A. Sachinidis, Genes Cells 9 (2004) [41] K. Mills, in: G. Rimbach, J. Fuchs, L. Packer (Eds.), Nutrigenomics, CRC Press, Boca Raton, FL, 2005, pp [42] C.K. Lee, R.G. Klopp, R. Weindruch, R.A. Prolla Science 285 (1999) [43] T. Kayo, D.B. Allison, R. Weindruch, T.A. Prolla, Proc. Natl. Acad. Sci. USA (2001) [44] R. Weindruch, T. Kayto, C. Lee, T.A. Prolla, J. Nutr. 131 (2001) 918S-923S. [45] S.X. Cao, J.M. Dhabbi, P.L. Spindler. Proc. Natl. Acad. Sci. USA 98 (2001) [46] H. Kato, T. Kimura, J. Nutrition 133 (2003) 2073S-2077S. [47] Y. Endo, Z.W. Fu, K. Abe, S. Arai, H. Kato J. Nutr. 132 (2002) [48] A. Berger, D.M. Mutch, J.B. German, M.A. Roberts, Lipids in Health and Disease 1 (2002) 2. [49] B.A. Narayanan, N.K. Narayanan, B. Simi, and B.S. Reddy, Cancer Res. 62 (2003) [50] M.J. van Erk, W.A. Blom, V. Van Ommen, H. F. Hendriks, Am. J. Clin. Nutr. 84 (2006)
36 [51] L.M. Sparks, H. Xie, R.A. Koza, R. Mynatt, G.A. Bray and S.R. Smith, Metabolism 55 (2006) [52] Y. Naito, K. Uchiyama, K. Mizushima, M. Kuroda, S. Akagiri, T. Takagi, O. Handa, S. Kokura, N. Yoshida, H. Ichikawa, J. Takahashi, T. Yoshikawa, Int. J. Mol. Med. 18 (2006) [53] S.I. Wang, H. Mukhar, Cancer Lett. 182 (2002) [54] L.G. Puskás, Z.B. Nagya, Z. Giricz, A. Onody, C. Csonkab, K. Ktajkac, L. Hackler, A. Zvara, P. Ferdinandy, FEBS Lett. 562 (2004) [55] D. Parra, A.B. Crujeiras, F.I. Milagro, E. Goyenechea, E. Larrarte, J. Margareto, J.A. Martínez, OMICS 12 (2008) [56] L. Murtaza, G. Marra, R. Schlapbach, A. Patrignani, M. Kunzli, U. Wagner, Biotechnol. Appl. Biochem. 45 (2006) [57] Velculescu, Zhang, Bofelstein, Science 270 (1995) [58] S. Saha, A. B. Sparks, C. Rago, V. Akmaev, C. J. Wang, B. Vogelstein, D.W. Kinzler, V. E. Velculescu, Nat. Biotechnol. 19 (2002) [59] T. Shiraki, S. Katayama, D. Waki, T. Kasukawa, H. Kawaji, R. Kodzius, A. Watahiki, M. Nakamura, T. Arakawa, S. Fukuda, D. Sasaki, Proc. Natl. Acad. Sci U.S.A. 100 (2003) [60] P. Ng, C.L. Wei, W.K. Sung, K.P. Chiu, L. Lipovich, C.C. Ang, S. Gupta, A. Shahab, A. Ridwan, C. Hong, Nat. Methods 2 (2005) [61] S.M. Wang, Trends Genet. 23 (2006) [62] S. Brenner, M. Johnson, J. Bridgham, G. Golda, D. H Lloyd, D. Johnson, S. Luo, S. McCurdy, M. Foy, M. Ewan, R. Roth, D. George, S. Eletr, G. Albrecht, E. Vermaas, S.R. Williams, K. Moon, T. Burcham, M. Pallas, R.B. DuBridge, J. Kirchner, K. Fearon, J. Mao, K. Corcoran, Nat. Biotechnol. 18. [63] R. Tuteja in: S.Q. Ye (Ed.), Bioinformatics. A practical approach, Chapman & Hall/CRC, Boca Raton, FL, 2008, pp [64] K. L. Nielsen, A. L Hogh, J. Emmergen, Nucl. Acids Res. 34 (2006) e133. [65] E. R. Mardis, Annu. Rev. Genomics Hum. Genet 9 (2008) [66] Z. Wang, M. Gerstein, M. Snyder, Nat. Rev. 10 (2009)
37 [67] M. Margulies, M. Egholm, W.E. Altman, S. Attiya, J.S. Bader, L.A. Bemden, J. Berka, M.S. Braverman, Y.J. Chen, Z. Chen, S.B. Dewell, L. Du, J.M. Fierro, X.V. Gomes, B.C. Godwin, W. He, S. Helgesen, C.H. Ho, G.P. Irzyk, S.C. Jando, M.L. Alenquer, T.P. Jarvie, K.B. Jirage, J.B. Kim, J.R. Knight, J.R. Lanza, J.H. Leamon, S.M. Lefkowitz, M. Lei, J. Li, K.L. Lohman, H. Lu, V.B. Makhijani, K.E. McDade, M.P. McKenna, E.W. Myers, E. Nickerson, J.R. Nobile, R. Plant, B.P. Puc, M.T. Ronan, G.T. Roth, G.J. Sarkis, J.F. Simons, J.W. Simpson, M. Srinivasan, K.R. Tartaro, A. Tomasz, K.A. Vogt, G.A. Volkmer, S.H. Wang, Y. Wang, M.P. Weiner, P. Yu, R.F. Begley, J.M. Rothberg, Nature 437 (2005) [68] S.T. Bennett, C. Barnes, A. Cox, L. Davies, C. Brown, Pharmacogenomics 6 (2005) [69] J. Schendure, G.J. Porreca, N.B. Reppas, X. Lin, J.P. McCutcheon, A.M. Rosenbaum, M.D. Wang, K. Zhang, R.D. Mitra, G.M. Church, Science 309 (2005) [70] S. Marguerat, B. T. Wilhelm, J. Bahler, Biochem. Soc. Trans. 36 (2008) [71] C.A. Hutchison, Nucl. Acids Res. 35 (2007) [72] B. Wold, R.M. Myers, Nat. Methods 5 (2008) [73] J.B. Kim, G.J. Porreca, L. Song, S.C. Greenway, J.M. Gorham, G.M. Church, C.E. Seidman, J.G. Seidman, Science 316 (2007) [74] V.E. Velculescu, K.W. Kinzler, Nat. Biotechnol. 25(2007) [75] T.T. Torres, M. Metta, B. Ottenwalder, C. Schlotterer, Genome Res. 18 (2008) [76] M.N. Bainbridge, R.L. Warren, M. Hirst, T. Romanuik, T. Zeng, A. Go, A. Delaney, M. Griffith, M. Hickenbotham, V. Magrini, BMC Genomics 7 (2006) 246. [77] A.L. Toth, K. Varala, T.C. Newman, F.E. Miguez, S.K. Hutchison, D.A. Willoughby, J.F. Simons, M. Egholm, J.H. Hunt, M.E. Hudson, G.E. Robinson, Science 318 (2007) [78] C. Lu, K. Kulkarni, F.F. Souret, R. MuthuValliappan, S.S. Tej, R.S. Poethig, I.R. Henderson, S.E. Jacobsen, W. Wang, P.J. Green, B.C. Meyers, Genome Res. 16 (2006) [79] J.G. Ruby, C. Jan, C. Player, M.J. Axtell, W. Lee, C. Nusbaum, H. Ge, D.P. Bartel, Cell 127 (2006) [80] A. Stark, N. Bushati, C.H. Jan, P. Kheradpour, E. Hodges, J. Brennecke, D.P. Bartel, S.M. Cohen, M. Kellis, Genes Dev. 22 (2008)
38 [81] A.S. Waagmeester, T. Kelder, C.T.A. Evelo, Genes Nutr. 3 (2008) [82] D.W. Huang, B.T. Sherman, R.A. Lempicki, Nucleic Acids Res. 37 (2009) [83] The Gene Ontology Consortium, Nucleic Acids Res. 36 (2008) D440-D444. [84] The Gene Ontology Consortium, Nat. Gen. 25 (2000) [85] J.J. Moresco, M-Q. Dong, J.R. Yates III, Am. J. Clin. Nutr. 88 (2008) [86] J. Ovesná, O. Slabý, O. Toussaint, M. Kodicek, P. Marsík, V. Pouchová, T. Vanek, Brit. J. Nutr. 99 (2008) ES127-ES134. [87] F.J. Schweigert, Ann. Nutr. Metab. 51 (2007) [88] J. Astle, J.T. Ferguson, J.B. German, G.G. Harrigan, N.L. Kelleher, T. Kodadek, B.A. Parks, M.J. Roth, K.W. Singletary, C.D. Wenger, G.B. Mahady, J. Nutr. 137 (2007) [89] D. Fuchs, I. Winkelmann, I.T. Johnson, E. Mariman, U. Wenzel, H. Daniel. Brit. J. Nutr. 94 (2005) [90] H. Kim, G.P. Page, S. Barnes, Nutrition 20 (2004) [91] B. de Roos, H.J. McArdle, Brit. J. Nutr. 99 (2008) S66-S71. [92] L.M. Knowles, J.A. Milner, Carcinogenesis 21 (2000) [93] A.T. Dinkova-Kostova, Mini Rev. Med. Chem. 2 (2002) ). [94] N.L. Anderson, N.G. Anderson, Mol. Cell. Proteomics 1 (2002) [95] X. Fang, W-W. Zhang, J. Proteomics 71 (2008) [96] M. Pernemalm, L.M. Orre, J. Lengqvist, P. Wikström, R. Lewensohn, J. Lehtiö. J. Proteome Res. 7 (2008) [97] L.A. Huber, K. Pfaller, I. Vietor, Circ. Res. 92 (2003) [98] A. Leitner, W. Lindner, Proteomics 6 (2006) [99] B. de Roos, S.J. Duthie, A.C.J. Polley, F. Mulholland, F.G. Bouwman, C. Heim, G.J. Rucklidge, I.T. Johnson, E.C. Mariman, H. Daniel, R.M. Elliott. J. Proteome Res. 7 (2008) [100] P. Lescuyer, D.F. Hochstrasser, J-C. Sanchez, Electrophoresis 25 (2004) [101] M. Fountoulakis, P. Dimitraki in: A. Posch (Ed.), 2D PAGE: Sample preparation and fractionation, Humana Press, Totowa, NJ, 2008 pp [102] E. Boschetti, P.G. Righetti, J. Proteomics 71 (2008)
39 [103] C.H. Chen, Anal. Chim. Acta. 624 (2008) [104] X. Han, A. Aslanian, J.R Yates III, Curr. Opin. Chem. Biol. 12 (2008) [105] B. Wittmann-Liebold, H-R. Graack, T. Pohl. Proteomics 6 (2006) [106]R. Marouga, S. David, E. Hawkins, Anal. Bioanal. Chem. 382 (2005) [107] M.F. Mouat, K. Kolli, R. Orlando, J.L. Hargrove, A. Grider, Nutr. J. 4 (2005), 1-7. [108] B. de Roos, I. Duivenvoorden, G. Rucklidge, M. Reid, K. Ross, R-J.A.N. Lamers, P.J. Voshol, L.M. Havekes, B. Teusink, FASEB J. 19 (2005) [109] D. Fuchs, B. Dirscher, J.H. Schroot, H. Daniel, U. Wenzel, Mol. Nutr. Food. Res. 50 (2006), [110] D. Fuchs, S. de Pascual-Teresa, G. Rimbach, F. Virgili, R. Ambra, R. Turner, H. Daniel, U. Wenzel, Eur. Nutr. 44 (2005) [111] D. Fuchs, P. Erhard, R. Turner, G. Rimbach, H. Daniel, U. Wenzel, J. Proteome Res. 4 (2005) [112] D. Fuchs, P. Erhard, G. Rimbach, H. Daniel, U. Wenzel, Proteomics 5 (2005) [113] D. Fuchs, K. Vafeiadou, W.L. Hall, H. Daniel, C.M. Williams, J.H, Schroot, U. Wenzel, Am. J. Clin. Nutr. 86 (2007) [114] W.Y. Lin, C-Y. Song, T-M. Pan, J. Agric. Food Chem. 54 (2006) [115] H-S. Seo, M. Hirano, J. Shibato, R. Rawkal, I.K. Hwang, Y. Masuo, J. Agric. Food. Chem., 56 (2008) [116] Q-Y. Lu, Y.S. Jin, Z-F. Zhang, A.D. Le, D. Heber, F.P. Li, S.M. Dubinett, J.Y. Rao, Lab. Invest. 87 (2007) [117] G. Breikers, S.G.J. van Breda, F.G. Bouwman, M.H.M. van Herwijnen, J. Renes, E.C.M. Mariman, J.C.S. Kleinjans, J.H.M. van Delft, Proteomics 6 (2006) [118103] M.C.Y. Wong, P.W. Emery, V.R. Preedy, H. Wiseman, Inflammopharmacology 16 (2008) [119] A.I. Nesvizhskii, R. Aebersold, Mol. Cell. Prot. 4 (2005) [120] L. Hu, M. Ye, X. Jiang, S. Fng, H. Zou, Anal. Chim. Acta 598 (2007) [121] M. Herrero, E. Ibañez, A. Cifuentes, Electrophoresis 29 (2008)
40 [122] V. Kasicka, Electrophoresis 29 (2008) [123] E. Schiffer, H. Mischak, J. Novak, Proteomics 20 (2006) [124] V. Dolnik, S. Liu, J. Sep. Sci. 28 (2005) [125] M.L. Fournier, J.M. Gilmore, S.A. Martin-Brown, M.P. Washburn, Chem. Rev. 107 (2007) [126] Motoyama, J.R. Yates III, Anal. Chem. 80 (2008) [127] R. Wu, L. Hu, F. Wang, M. Ye, H. Zou, J. Chromatogr. A 1184 (2008) [128] P.J. Boersema, S. Mohammed, A.J.R. Heck, Anal. Bioanal. Chem. 391 (2008) [129] T. Guo, C.S. Lee, W. Wang, D.L. de Voe, B.M. Balgley, Electrophoresis 27 (2006) [130 ] Q. Hu, R.J. Noll, H. Li, A. Makarov, M. Hardmanc, R.G. Cooks, J. Mass Spectrom. 40 (2005) [131] Y. Yang, S. Zhang, K. Howe, D.B. Wilson, F. Moser, D. Irwin, T.W. Thannhauser, J. Biomol. Tech. 18 (2007) [132] K. Breuker, M. Jin, X. Han, H. Jiang, F.W. McLafferty, J. Am. Soc. Mass Spectrom. 19 (2008) [133] B. Bogdanov, R.D. Smith, Mass. Spec. Rev. 24 (2005) [134] B. Macek, L.F. Waanders, J.V. Olsen, M. Mann, Mol. Cell. Prot. 5 (2006) [135] J.W. Morgan, J.M. Hettick, D.H. Russell, 402 (2005) [136] S.A. Raspopov, A. El-Faramawy, B.A. Thomson, K.W.M. Siu, Anal. Chem. 78 (2006), [137] Y. Gea, D.M. Horna, F.W. McLafferty, Int. J. Mass Spectrom (2001) [138] S.M. Sweet, H.J. Cooper, Expert Rev. Proteomics 4 (2007) [139] J. Wiesner, T. Premsler, A. Sickmann, Proteomics 8 (2008) [140] D.C. Simpson, S. Ahn, L. Pasa-Tolic, B. Bogdanov, H.M. Mottaz, A.N. Vilkov, G.A. Anderson, M.S. Lipton, R.D. Smith, Electrophoresis 27 (2006) [141] C.A.K. Borrebaeck, C. Wingren, Expert Rev. Mol. Diagn. 7 (2007) [142] T.C.W. Poon, Expert Rev. Proteomics 4 (2007) [143] T. Linke, A.C. Ross, E.H. Harrison, J. Chromatogr. A 1043 (2004)
41 [144] E. Trujillo, C. Davis, J. Millner, J. Am. Diet. Assoc. 106, 3 (2006) [145] M. Kussman, S. Rezzi, H. Danelore, Curr. Opin. Biotech. 19 (2008) [146] Wai-Nang, P. Lee, V. L. Go, J. Nutr. (2005) 3027S-3032S. [147] O. Fiehn, Plant Mol. Biol. 48 (2002) [148] M.C. Walsh, A. Nugent, L. Brennan, M.J. Gibney, Nutr. Bull. 33 (2008) [149] A. Cassidy, F.S. Dalais, in: M.J. Gibney, I. Macdonald, H.M. Roche (Eds.), Nutrition & Metabolism, Oxford, United Kingdom, 2003, pp [150] J.D. Lambert, J. Hong, G. Yang, J. Liao, C. Yang., Am. J. Clin. Nutr. 81 (2005) 284S-291S. [151] A. Koulman, D.A. Volmer, Nutr. Bull. 33 (2008) [152] S. Rezzi, Z. Ramadan, L.B. Fay, S. Kochhar, J. Prot. Res. 6 (2007) [153] J.K. Nicholson, E. Holmes, J.C. Lindon, I.D. Wilson, Nat. Biotechnol, 22 (2004) [154] R. Goodacre, J. Nutr. 137 (2007) 259S-266S. [155] M.C. Walsh, L. Brennan, J. Malthouse, H.M. Roche, M.J. Gibney, Am. J. Clin. Nutr. 84 (2006) [156] X. Zhang, Y. Yap, D. Wei, G. Chen, F. Chen, Biotechnol. Adv. 26 (2008) [157] M.J. Gibney, M. Walsh, L. Brennan, H.M. Roche, B. German, B. Van Ommen, Am. J. Clin. Nutr. 82 (2005) [158] H. Gu, H. Chen, Z. Pan, A. U. Jackson, N. Talaty, B. Xi, C. Kissinger, C. Duda, D. Mann, D. Raftery, R. G. Cooks, Anal. Chem. 79 (2007) [159] M.C Walsh, L. Brennan, E. Pujos-Guillot, J-L. Sébédio, A. Scalbert, A. Fagan, D.G Higgins, M.J. Gibney, Am. J. Clin. Nutr. 86 (2007) [160] R. Roselló-Mora, M. Lucio, A. Pea, J. Brito-Echeverría, A. López-López, M. Valens-Vadell, M. Frommberger, J. Antón, P. Schmitt-Kopplin, ISME J. 2 (2008) [161] K. Dettmer, P.A. Aronov, B.D. Hammock, Mass Spectrom. Rev. 26 (2007) [162] E. Werner, J-F. Heilier, C. Ducruix, E. Ezan, C. Junot, J-C. Tabet, J. Chromatogr. B 871 (2008) [163] J. Chen, X. Zhao, J. Fritsche, P. Yin, P. Schmitt-Kopplin, W. Wang, X. Lu, H.U. Haring, E.D. Schleicher, R. Lehmann, G. Xu, Anal. Chem. 80 (2008)
42 [164] C.H. Grün, F.A. van Dorsten, D.M. Jacobs, M. Le Belleguic, E.J. van Velzen, M.O. Bingham, H-G. Janssen, J.P. van Duynhoven, J. Chromatogr. B 871 (2008) [165] P. Yin, P. Mohemaiti, J. Chen, X. Zhao, X. Lu, A. Yimiti, H. Upur, G. Xu J. Chromatogr. B 871 (2008) [166] P.A. Guy, I. Tavazzi, S.J. Bruce, Z. Ramadan, S. Kochhar, J. Chromatogr. B. 871 (2008) [167] M.E. Dumas, E.C. Maibaum, C. Teague, H. Ueshima, B. Zhou, J.C. Lindon, J.K. Nicholson, J. Stamler, P. Elliot, Q. Chan, E. Holmes, Anal Chem. 78 (2006) [168] Y. Wang, H. Tang, J.K. Nicholson, P.J. Hylands, J. Sampson, E. Holmes., J. Agric. Food Chem. 53 (2005) [169] D.M. Jacobs, N. Deltimple, E. van Velzen, F.A. van Dorsten, M. Bingham, E.E. Vaughan, J. van Duynhoven, NMR Biomed. 21 (2008) [170] K.S. Solanky, N.J. Bailey, B.M. Beckwith-Hall, A. Davis, S. Bingham, E.Holmes, J.K. Nicholson, A. Cassidy, Anal. Biochem. 323 (2003) [171] K.S. Solanky, N.J. Bailey, B.M. Beckwith-Hall, S. Bingham, A. Davis, E. Holmes, J.K. Nicholson, A. Cassidy, J. Nutr. Biochem. 16 (2005) [172] C.L Gavaghan, J.K. Nicholson, S.C. Connor, I.D. Wilson, B. Wright, E. Holmes, Anal. Biochem. 291 (2001) [173] T.W-M. Fan, A.N. Lane, Prog. Nucl. Mag. Res. Sp. 52 (2008) [174] M. Kanehisa, S. Goto, Nucleic Acids Res. 28 (2000) [175] [176] [177] D.S. Wishart, D. Tzur, C. Knox, R. Eisner, A.C. Guo, N. Young, D. Cheng, K. Jewell, D. Arndt, S. Sawhney, C. Fung, L. Nikolai, M. Lewis, M.A. Coutouly, I. Forsythe, P. Tang, S. Shrivastava, K. Jeroncic, P. Stothard, G. Amegbey, D. Block, D.D. Hau, J. Wagner, J. Miniaci, M. Clements, M. Gebremedhin, N. Guo, Y. Zhang, G.E. Duggan, G.D. MacInnis, A.M. Weljie, R. Dowlatabadi, F. Bamforth, D. Clive, R. Greiner, Nucleic Acids Res. 35 (2007) D521-D526. [178] A.D. Weston, L. Hood, J. Proteome Res. 3 (2004)
43 [179] L. Hood, R.M. Perlmutter, Nat. Biotechnol. 22 (2004) [180] I. Rigoutsos in: I. Rigoutsos (Ed.), Systems Biology, Oxford University Press, Cary, NC, USA, 2006, pp xiii-xxi. [181] X. Feng, X. Liu, Q. Luo, B.F. Liu, Mass Spectrom. Rev. 27 (2008) [182] D.M. Mutch, W. Wahli, G. Williamson, FASEB J. 12 (2005) [183] M.A. Kohanski, D.J. Dwyer, J. Wierzbowski, G. Cottarel, J.J. Collins, Cell 135 (2008) [184] B.J. Privett, J.H. Shin, M.H. Schoenfisch, Anal. Chem. 80 (2008) [185] A. Sassolas, B.D. Leca-Bouvier, L.J. Blum, Chem. Rev. 108 (2008) [186] J.A. Stamatoyannopoulos, Genomics 84 (2004) [187] D.A. Casciano, J. Woodcock, Nat. Biotechnol. 24 (2006) 113. [188] P.A. Hoen, Y. Ariyurek, H.H. Thygesen, E. Vreugdenhil, R.A. Vossen, R.X. de Menezes, J.M. Boer, G.B van Ommen, J.T. den Dunnen, Nucleic Acids Res. 36 (2008) e141. [189] A. Mortazavi, B.A. Williams, K. McCue, L. Schaeffer, B. Wold, Nat. Methods 5 (2008) [190] B.T. Wilhelm, S. Marguerat, S. Watt, F. Schubert, V. Wood, I. Goodhead, C.J. Penkett, J.Rogers, J. Bahler, Nature 453 (2008) [191] M. Sultan, M.H. Schulz, H. Richard, A. Magen, A. Klingenhoff, M. Scherf, M. Seifert, T. Borodina, A. Soldatov, D. Parkhomchuk, D. Schmidt, Science 321 (2008) [192] C.P. Fredlake, D.G. Hert, E.R. Mardis, A.E. Barron, Electrophoresis 27 (2006) [193] M.A. Quail, I. Kozarewa, F. Smith, A. Scally, P.J. Stephens, R. Durbin, H. Swerdlow, D.J. Turner, Nat. Methods 5 (2008) [194] T. Maricic, S. Paabo, BioTechniques 46 (2009) [195] H. Chen, Z. Pan, N. Talaty, D. Raftery, R.G. Cooks, Rapid Commun. Mass Spectrom. 20 (2006) [1 - tter, E. Holmes, S. Bahn, Plos ONE 2 (2007) e756. [197] X. Feng, X. Liu, Q. Luo, B-F. Liu, Mass Spectrom. Rev. 27 (2008)
44 , A. Cifuentes, J. Chromatogr. A 1195 (2008) , A. Cifuentes, Anal. Chem. 80 (2008) [200] C. Barbas, M. Vallejo, A. García, D. Barlow, M. Hanna-Brown., J. Pharmac. Biomed. Anal. 47 (2008) [201] K.K. Pasikanti, P.C. Ho, E.C. Chan, J. Chromatogr. B. 871 (2008) [202] R.A. Shellie, W. Welthagen, J. Zrostliková, J. Spranger, M. Ristow, O. Fiehn, R. Zimmermann. J. Chromatogr. A 1086 (2005)
45 FIGURE LEGENDS Figure 1. Scanned image of a microarray composed of a total of 250 kinases and phosphatases showing the expression profile obtained from human prostate carcinoma LNCaP cells treated with 12 mm epigallocatechin gallate (EGCG) or water-only for 12 h. Redrawn from [53]. Figure 2. Workflow of multidimensional separation-ms/ms-based shotgun proteomics strategy. N is the sample fraction. Redrawn from [126]. Figure 3. SELDI TOF mass spectra representing protein expression differences in plasma of vitamin A-deficient (n=3) and vitamin A-sufficient (n=3) rats at three different m/z: 10693, and Bold line, vitamin A-sufficient Mr profile; dotted line, vitamin A-deficient Mr profile. Redrawn from [143]. Figure 4. Metabolomics workflow in Nutrigenomics research. Figure 5. NMR profiles of faeces from different subjects using two different extraction methods (water and methanol). Redrawn from [169]. 45

46 Figure 1 46
47 Figure 2 47

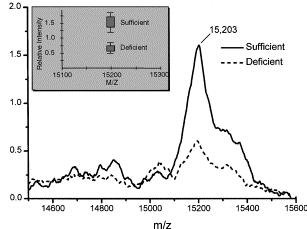
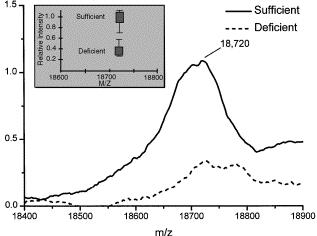
48 Figure 3 48
49 1. Samples (urine, blood...) 2. Metabolite extraction 3. Separation (GC, LC, CE, GCxGC...) 4. Detection and characterization (MS, NMR) 5. Statistical Analysis (PCA, PLS-DA) 6. Elucidation (KEGG, HMDB, NuGO...) Figure 4 49

50 Figure 5 50
SGN-6106 Computational Systems Biology I
 SGN-6106 Computational Systems Biology I A View of Modern Measurement Systems in Cell Biology Kaisa-Leena Taattola 21.2.2007 1 The cell a complex system (Source: Lehninger Principles of Biochemistry 4th
Computing with large data sets
 Computing with large data sets Richard Bonneau, spring 2009 Lecture 14 (week 8): genomics 1 Central dogma Gene expression DNA RNA Protein v22.0480: computing with data, Richard Bonneau Lecture 14 places
Proteomics And Cancer Biomarker Discovery. Dr. Zahid Khan Institute of chemical Sciences (ICS) University of Peshawar. Overview. Cancer.
 University of Peshawar. Overview. Cancer.") Proteomics And Cancer Biomarker Discovery Dr. Zahid Khan Institute of chemical Sciences (ICS) University of Peshawar Overview Proteomics Cancer Aims Tools Data Base search Challenges Summary 1 Overview
Proteomics And Cancer Biomarker Discovery Dr. Zahid Khan Institute of chemical Sciences (ICS) University of Peshawar Overview Proteomics Cancer Aims Tools Data Base search Challenges Summary 1 Overview
Gene Expression Technology
 Gene Expression Technology Bing Zhang Department of Biomedical Informatics Vanderbilt University bing.zhang@vanderbilt.edu Gene expression Gene expression is the process by which information from a gene
Capabilities & Services
 Capabilities & Services Accelerating Research & Development Table of Contents Introduction to DHMRI 3 Services and Capabilites: Genomics 4 Proteomics & Protein Characterization 5 Metabolomics 6 In Vitro
CAP BIOINFORMATICS Su-Shing Chen CISE. 10/5/2005 Su-Shing Chen, CISE 1
 CAP 5510-9 BIOINFORMATICS Su-Shing Chen CISE 10/5/2005 Su-Shing Chen, CISE 1 Basic BioTech Processes Hybridization PCR Southern blotting (spot or stain) 10/5/2005 Su-Shing Chen, CISE 2 10/5/2005 Su-Shing
The Five Key Elements of a Successful Metabolomics Study
 The Five Key Elements of a Successful Metabolomics Study Metabolomics: Completing the Biological Picture Metabolomics is offering new insights into systems biology, empowering biomarker discovery, and
Proteomics. Proteomics is the study of all proteins within organism. Challenges
 Proteomics Proteomics is the study of all proteins within organism. Challenges 1. The proteome is larger than the genome due to alternative splicing and protein modification. As we have said before we
Recent technology allow production of microarrays composed of 70-mers (essentially a hybrid of the two techniques)
") Microarrays and Transcript Profiling Gene expression patterns are traditionally studied using Northern blots (DNA-RNA hybridization assays). This approach involves separation of total or polya + RNA on
Microarrays and Transcript Profiling Gene expression patterns are traditionally studied using Northern blots (DNA-RNA hybridization assays). This approach involves separation of total or polya + RNA on
Motivation From Protein to Gene
 MOLECULAR BIOLOGY 2003-4 Topic B Recombinant DNA -principles and tools Construct a library - what for, how Major techniques +principles Bioinformatics - in brief Chapter 7 (MCB) 1 Motivation From Protein
Expressed genes profiling (Microarrays) Overview Of Gene Expression Control Profiling Of Expressed Genes
 Overview Of Gene Expression Control Profiling Of Expressed Genes") Expressed genes profiling (Microarrays) Overview Of Gene Expression Control Profiling Of Expressed Genes Genes can be regulated at many levels Usually, gene regulation, are referring to transcriptional
Expressed genes profiling (Microarrays) Overview Of Gene Expression Control Profiling Of Expressed Genes Genes can be regulated at many levels Usually, gene regulation, are referring to transcriptional
LECTURE-3. Protein Chemistry to proteomics HANDOUT. Proteins are the most dynamic and versatile macromolecules in a living cell, which
 LECTURE-3 Protein Chemistry to proteomics HANDOUT PREAMBLE Proteins are the most dynamic and versatile macromolecules in a living cell, which regulates essential activities of the cell. The classical protein
Proteomics and some of its Mass Spectrometric Applications
 Proteomics and some of its Mass Spectrometric Applications What? Large scale screening of proteins, their expression, modifications and interactions by using high-throughput approaches 2 1 Why? The number
11/22/13. Proteomics, functional genomics, and systems biology. Biosciences 741: Genomics Fall, 2013 Week 11
 Proteomics, functional genomics, and systems biology Biosciences 741: Genomics Fall, 2013 Week 11 1 Figure 6.1 The future of genomics Functional Genomics The field of functional genomics represents the
Faster, easier, flexible proteomics solutions
 Agilent HPLC-Chip LC/MS Faster, easier, flexible proteomics solutions Our measure is your success. products applications soft ware services Phospho- Anaysis Intact Glycan & Glycoprotein Agilent s HPLC-Chip
From Proteomics to Systems Biology. Integration of omics - information
 From Proteomics to Systems Biology Integration of omics - information Outline and learning objectives Omics science provides global analysis tools to study entire systems How to obtain omics - data What
Metabolomics S.M.Shotorbani, V. A. Suliman
 13 International Journal of Advance Research, IJOAR.org Volume 1, Issue 1, January 2013, Online: Metabolomics S.M.Shotorbani, V. A. Suliman ABSTRACT A brief review on metabolomics, a new field being explored,
Biomarker Discovery using Surface Plasmon Resonance Imaging
 F e a t u r e A r t i c l e Feature Article Biomarker Discovery using Surface Plasmon Resonance Imaging Elodie LY-MORIN, Sophie BELLON, Géraldine MÉLIZZI, Chiraz FRYDMAN Surface Plasmon Resonance (SPR)
Emerging Focus. Nutrigenomics. Department of Nutritional Sciences Faculty of Life Sciences
 Emerging Focus Nutrigenomics Emerging Focus Nutrigenomics The Emerging Focus Nutrigenomics A New Research Group at the of the University of Vienna Overview Nutrigenomics is the study of the response of
This place covers: Methods or systems for genetic or protein-related data processing in computational molecular biology.
 G16B BIOINFORMATICS, i.e. INFORMATION AND COMMUNICATION TECHNOLOGY [ICT] SPECIALLY ADAPTED FOR GENETIC OR PROTEIN-RELATED DATA PROCESSING IN COMPUTATIONAL MOLECULAR BIOLOGY Methods or systems for genetic
Outline and learning objectives. From Proteomics to Systems Biology. Integration of omics - information
 From to Systems Biology Outline and learning objectives Omics science provides global analysis tools to study entire systems How to obtain omics - What can we learn Limitations Integration of omics - In-class
Lecture 5: 8/31. CHAPTER 5 Techniques in Protein Biochemistry
 Lecture 5: 8/31 CHAPTER 5 Techniques in Protein Biochemistry Chapter 5 Outline The proteome is the entire set of proteins expressed and modified by a cell under a particular set of biochemical conditions.
Proteomics. Manickam Sugumaran. Department of Biology University of Massachusetts Boston, MA 02125
 Proteomics Manickam Sugumaran Department of Biology University of Massachusetts Boston, MA 02125 Genomic studies produced more than 75,000 potential gene sequence targets. (The number may be even higher
Kinetics Review. Tonight at 7 PM Phys 204 We will do two problems on the board (additional ones than in the problem sets)
") Quiz 1 Kinetics Review Tonight at 7 PM Phys 204 We will do two problems on the board (additional ones than in the problem sets) I will post the problems with solutions on Toolkit for those that can t make
Quiz 1 Kinetics Review Tonight at 7 PM Phys 204 We will do two problems on the board (additional ones than in the problem sets) I will post the problems with solutions on Toolkit for those that can t make
Design. Construction. Characterization
 Design Construction Characterization DNA mrna (messenger) A C C transcription translation C A C protein His A T G C T A C G Plasmids replicon copy number incompatibility selection marker origin of replication
Finding Genes with Genomics Technologies
 PLNT2530 Plant Biotechnology (2018) Unit 7 Finding Genes with Genomics Technologies Unless otherwise cited or referenced, all content of this presenataion is licensed under the Creative Commons License
Lecture Four. Molecular Approaches I: Nucleic Acids
 Lecture Four. Molecular Approaches I: Nucleic Acids I. Recombinant DNA and Gene Cloning Recombinant DNA is DNA that has been created artificially. DNA from two or more sources is incorporated into a single
Tooling up for Functional Genomics
 Tooling up for Functional Genomics Michael Abberton, Iain Donnison, Phil Morris, Helen Ougham, Mark Robbins, Howard Thomas From model to crop species 6 Genomes and genome mapping 7 The transcriptome 7
METABOLOMICS: OPPORTUNITIES AND CHALLENGES
 METABOLOMICS: OPPORTUNITIES AND CHALLENGES PR. NOUREDINE BENKEBLIA UWI JAMAICA Metabolomics DISCIPLINE or METHODS to understand the dynamics of small molecules in living systems METABOLOMIC PROFILING aims
Chapter 1. from genomics to proteomics Ⅱ
 Proteomics Chapter 1. from genomics to proteomics Ⅱ 1 Functional genomics Functional genomics: study of relations of genomics to biological functions at systems level However, it cannot explain any more
Measuring and Understanding Gene Expression
 Measuring and Understanding Gene Expression Dr. Lars Eijssen Dept. Of Bioinformatics BiGCaT Sciences programme 2014 Why are genes interesting? TRANSCRIPTION Genome Genomics Transcriptome Transcriptomics
Agilent Solutions for Metabolomics EMERGING INSIGHTS
 Agilent Solutions for Metabolomics EMERGING INSIGHTS Understanding Metabolic Fingerprints A Powerful Way to Investigate Biology What is Metabolomics? Metabolomics is the study of the metabolite content
Proteomics and Cancer
 Proteomics and Cancer Japan Society for the Promotion of Science (JSPS) Science Dialogue Program at Niitsu Senior High School Niitsu, Niigata September 4th 2006 Vladimir Valera, M.D, PhD JSPS Postdoctoral
Bi 8 Lecture 4. Ellen Rothenberg 14 January Reading: from Alberts Ch. 8
 Bi 8 Lecture 4 DNA approaches: How we know what we know Ellen Rothenberg 14 January 2016 Reading: from Alberts Ch. 8 Central concept: DNA or RNA polymer length as an identifying feature RNA has intrinsically
Genomics and Proteomics *
 OpenStax-CNX module: m44558 1 Genomics and Proteomics * OpenStax This work is produced by OpenStax-CNX and licensed under the Creative Commons Attribution License 3.0 By the end of this section, you will
Bioinformatics (Lec 19) Picture Copyright: the National Museum of Health
 Picture Copyright: the National Museum of Health") 3/29/05 1 Picture Copyright: AccessExcellence @ the National Museum of Health PCR 3/29/05 2 Schematic outline of a typical PCR cycle Target DNA Primers dntps DNA polymerase 3/29/05 3 Gel Electrophoresis
3/29/05 1 Picture Copyright: AccessExcellence @ the National Museum of Health PCR 3/29/05 2 Schematic outline of a typical PCR cycle Target DNA Primers dntps DNA polymerase 3/29/05 3 Gel Electrophoresis
Combining Techniques to Answer Molecular Questions
 Combining Techniques to Answer Molecular Questions UNIT FM02 How to cite this article: Curr. Protoc. Essential Lab. Tech. 9:FM02.1-FM02.5. doi: 10.1002/9780470089941.etfm02s9 INTRODUCTION This manual is
Strategies in proteomics
 Strategies in proteomics Systems biology - understand cellpathways, network, and complex interacting (includes Genomics, Proteomics, Metabolomics..) Biological processes - characterize protein complexes,
Methods for Working with DNA and RNA
 Methods for Working with DNA and RNA 1. Gel electrophoresis A. Materials: agarose (large DNAs) vs. acrylamide (high resolution, DNA sequencing) B. Separated by its sieving property and charge: both are
MRC-NIHR National Phenome Centre
 MRC-NIHR National Phenome Centre PROFESSOR JEREMY NICHOLSON Director of the MRC-NIHR National Phenome Centre OUR PHILOSOPHY Disease risk at the individual and population level is determined by complex
DNA Microarray Technology
 2 DNA Microarray Technology 2.1 Overview DNA microarrays are assays for quantifying the types and amounts of mrna transcripts present in a collection of cells. The number of mrna molecules derived from
Agilent Solutions for Metabolomics YOUR PATH TO SUCCESS
 Agilent Solutions for Metabolomics YOUR PATH TO SUCCESS UNDERSTANDING METABOLOMICS Agilent is the leading global metabolomics vendor, offering our customers a broad array of cutting-edge instrumentation
Mass Spectrometry and Proteomics - Lecture 6 - Matthias Trost Newcastle University
 Mass Spectrometry and Proteomics - Lecture 6 - Matthias Trost Newcastle University matthias.trost@ncl.ac.uk Previously Quantitation techniques Label-free TMT SILAC Peptide identification and FDR 194 Lecture
Basic protein and peptide science for proteomics. Henrik Johansson
 Basic protein and peptide science for proteomics Henrik Johansson Proteins are the main actors in the cell Membranes Transport and storage Chemical factories DNA Building proteins Structure Proteins mediate
Molecular Cell Biology - Problem Drill 11: Recombinant DNA
 Molecular Cell Biology - Problem Drill 11: Recombinant DNA Question No. 1 of 10 1. Which of the following statements about the sources of DNA used for molecular cloning is correct? Question #1 (A) cdna
Metabolomics in Systems Biology
 Metabolomics in Systems Biology Basil J. Nikolau W.M. Keck Metabolomics Research Laboratory Iowa State University February 7, 2008 Outline What is metabolomics? Why is metabolomics important? What are
IMPORTANCE OF CELL CULTURE MEDIA TO THE BIOPHARMACEUTICAL INDUSTRY
 IMPORTANCE OF CELL CULTURE MEDIA TO THE BIOPHARMACEUTICAL INDUSTRY Research, development and production of biopharmaceuticals is growing rapidly, thanks to the increase of novel therapeutics and biosimilar
Non-Organic-Based Isolation of Mammalian microrna using Norgen s microrna Purification Kit
 Application Note 13 RNA Sample Preparation Non-Organic-Based Isolation of Mammalian microrna using Norgen s microrna Purification Kit B. Lam, PhD 1, P. Roberts, MSc 1 Y. Haj-Ahmad, M.Sc., Ph.D 1,2 1 Norgen
21.5 The "Omics" Revolution Has Created a New Era of Biological Research
 21.5 The "Omics" Revolution Has Created a New Era of Biological Research 1 Section 21.5 Areas of biological research having an "omics" connection are continually developing These include proteomics, metabolomics,
DNA/RNA MICROARRAYS NOTE: USE THIS KIT WITHIN 6 MONTHS OF RECEIPT.
 DNA/RNA MICROARRAYS This protocol is based on the EDVOTEK protocol DNA/RNA Microarrays. 10 groups of students NOTE: USE THIS KIT WITHIN 6 MONTHS OF RECEIPT. 1. EXPERIMENT OBJECTIVE The objective of this
Selected Techniques Part I
 1 Selected Techniques Part I Gel Electrophoresis Can be both qualitative and quantitative Qualitative About what size is the fragment? How many fragments are present? Is there in insert or not? Quantitative
Moc/Bio and Nano/Micro Lee and Stowell
 Moc/Bio and Nano/Micro Lee and Stowell Moc/Bio-Lecture GeneChips Reading material http://www.gene-chips.com/ http://trueforce.com/lab_automation/dna_microa rrays_industry.htm http://www.affymetrix.com/technology/index.affx
NPTEL VIDEO COURSE PROTEOMICS PROF. SANJEEVA SRIVASTAVA
 LECTURE-06 PROTEIN PURIFICATION AND PEPTIDE ISOLATION USING CHROMATOGRAPHY TRANSCRIPT Welcome to the proteomics course. Today, we will talk about protein purification and peptide isolation using chromatography
Improving Productivity with Applied Biosystems GPS Explorer
 Product Bulletin TOF MS Improving Productivity with Applied Biosystems GPS Explorer Software Purpose GPS Explorer Software is the application layer software for the Applied Biosystems 4700 Proteomics Discovery
Lecture 23: Metabolomics Technology
 MBioS 478/578 Bioinformatics Mark Lange Lecture 23: Metabolomics Technology Definitions and Background Technologies Nuclear Magnetic Resonance Mass Spectrometry General Introduction Fourier-Transform Mass
Solutions Guide. MX Series II Modular Automation for Nano and Analytical Scale HPLC And Low Pressure Fluid Switching Applications
 Solutions Guide MX Series II Modular Automation for Nano and Analytical Scale HPLC And Low Pressure Fluid Switching Applications Page 1 of 12 Table of Contents Sample Injection... 3 Two- Selection... 4
Protein Microarrays?
 Protein Microarrays? Protein Chemistry/Proteomics Unit and the Neuroscience Program,Biomedicum Helsinki E-Mail: marc.baumann@helsinki.fi (http://research.med.helsinki.fi/corefacilities/proteinchem) What
Application Note # ET-20 BioPharma Compass: A fully Automated Solution for Characterization and QC of Intact and Digested Proteins
 Application Note # ET-20 BioPharma Compass: A fully Automated Solution for Characterization and QC of Intact and Digested Proteins BioPharma Compass TM is a fully automated solution for the rapid characterization
MagSi Beads. Magnetic Silica Beads for Life Science and Biotechnology study
 MagSi Beads Magnetic Silica Beads for Life Science and Biotechnology study MagnaMedics Diagnostics B.V. / Rev. 9.2 / 2012 Wide range of products for numerous applications MagnaMedics separation solutions
Understanding life WITH NEXT GENERATION PROTEOMICS SOLUTIONS
 Innovative services and products for highly multiplexed protein discovery and quantification to help you understand the biological processes that shape life. Understanding life WITH NEXT GENERATION PROTEOMICS
Chapter 6 - Molecular Genetic Techniques
 Chapter 6 - Molecular Genetic Techniques Two objects of molecular & genetic technologies For analysis For generation Molecular genetic technologies! For analysis DNA gel electrophoresis Southern blotting
Genome Biology and Biotechnology
 Genome Biology and Biotechnology Functional Genomics Prof. M. Zabeau Department of Plant Systems Biology Flanders Interuniversity Institute for Biotechnology (VIB) University of Gent International course
Overview. Tools for Protein Sample Preparation, 2-D Electrophoresis, and Imaging and Analysis
 Expression Proteomics // Tools for Protein Separation and Analysis www.expressionproteomics.com 1 2 3 4 Overview Tools for Protein Sample Preparation, 2-D Electrophoresis, and Imaging and Analysis overview
Gene expression analysis. Biosciences 741: Genomics Fall, 2013 Week 5. Gene expression analysis
 Gene expression analysis Biosciences 741: Genomics Fall, 2013 Week 5 Gene expression analysis From EST clusters to spotted cdna microarrays Long vs. short oligonucleotide microarrays vs. RT-PCR Methods
DNA Arrays Affymetrix GeneChip System
 DNA Arrays Affymetrix GeneChip System chip scanner Affymetrix Inc. hybridization Affymetrix Inc. data analysis Affymetrix Inc. mrna 5' 3' TGTGATGGTGGGAATTGGGTCAGAAGGACTGTGGGCGCTGCC... GGAATTGGGTCAGAAGGACTGTGGC
Innovations for Protein Research. Protein Research. Powerful workflows built on solid science
 Innovations for Protein Research Protein Research Powerful workflows built on solid science Your partner in discovering innovative solutions for quantitative protein and biomarker research Applied Biosystems/MDS
Towards unbiased biomarker discovery
 Towards unbiased biomarker discovery High-throughput molecular profiling technologies are routinely applied for biomarker discovery to make the drug discovery process more efficient and enable personalised
Proteomics: A Challenge for Technology and Information Science. What is proteomics?
 Proteomics: A Challenge for Technology and Information Science CBCB Seminar, November 21, 2005 Tim Griffin Dept. Biochemistry, Molecular Biology and Biophysics tgriffin@umn.edu What is proteomics? Proteomics
Hichrom Limited 1 The Markham Centre, Station Road, Theale, Reading, Berkshire, RG7 4PE, UK Tel: +44 (0) Fax: +44 (0)
 Fax: +44 (0)") Hichrom Limited 1 The Markham Centre, Station Road, Theale, Reading, Berkshire, RG7 4PE, UK Tel: +44 (0)118 930 3660 Fax: +44 (0)118 932 3484 Email: www.hichrom.co.uk Table of Contents Sample Injection...
Hichrom Limited 1 The Markham Centre, Station Road, Theale, Reading, Berkshire, RG7 4PE, UK Tel: +44 (0)118 930 3660 Fax: +44 (0)118 932 3484 Email: www.hichrom.co.uk Table of Contents Sample Injection...
ChIP-seq and RNA-seq. Farhat Habib
 ChIP-seq and RNA-seq Farhat Habib fhabib@iiserpune.ac.in Biological Goals Learn how genomes encode the diverse patterns of gene expression that define each cell type and state. Protein-DNA interactions
A Highly Accurate Mass Profiling Approach to Protein Biomarker Discovery Using HPLC-Chip/ MS-Enabled ESI-TOF MS
 Application Note PROTEOMICS METABOLOMICS GENOMICS INFORMATICS GLYILEVALCYSGLUGLNALASERLEUASPARG CYSVALLYSPROLYSPHETYRTHRLEUHISLYS A Highly Accurate Mass Profiling Approach to Protein Biomarker Discovery
27041, Week 02. Review of Week 01
 27041, Week 02 Review of Week 01 The human genome sequencing project (HGP) 2 CBS, Department of Systems Biology Systems Biology and emergent properties 3 CBS, Department of Systems Biology Different model
Application Note 18 RNA/DNA/Protein Sample Preparation METHODS AND MATERIALS INTRODUCTION
 Application Note 18 /DNA/Protein Sample Preparation Sequential Purification of, DNA and Protein from a Single Sample using 's /DNA/Protein Purification Kit and Comparison to a Market B. Lam, PhD 1, C.
Lecture 23: Clinical and Biomedical Applications of Proteomics; Proteomics Industry
 Lecture 23: Clinical and Biomedical Applications of Proteomics; Proteomics Industry Clinical proteomics is the application of proteomic approach to the field of medicine. Proteome of an organism changes
Molecular characterization, detection & quantitation of biological products Purin Charoensuksai, PhD
 Molecular characterization, detection & quantitation of biological products Purin Charoensuksai, PhD Department of Biopharmacy, Faculty of Pharmacy, Silpakorn University Example of critical checkpoints
Corporate Medical Policy
 Corporate Medical Policy Proteogenomic Testing for Patients with Cancer (GPS Cancer Test) File Name: Origination: Last CAP Review: Next CAP Review: Last Review: proteogenomic_testing_for_patients_with_cancer_gps_cancer_test
MBios 478: Mass Spectrometry Applications [Dr. Wyrick] Slide #1. Lecture 25: Mass Spectrometry Applications
![MBios 478: Mass Spectrometry Applications [Dr. Wyrick] Slide #1. Lecture 25: Mass Spectrometry Applications](/thumbs/74/71368870.jpg "MBios 478: Mass Spectrometry Applications [Dr. Wyrick] Slide #1. Lecture 25: Mass Spectrometry Applications") MBios 478: Mass Spectrometry Applications [Dr. Wyrick] Slide #1 Lecture 25: Mass Spectrometry Applications Measuring Protein Abundance o ICAT o DIGE Identifying Post-Translational Modifications Protein-protein
MBios 478: Mass Spectrometry Applications [Dr. Wyrick] Slide #1 Lecture 25: Mass Spectrometry Applications Measuring Protein Abundance o ICAT o DIGE Identifying Post-Translational Modifications Protein-protein
Chapter 5: Proteins: Primary Structure
 Instant download and all chapters Test Bank Fundamentals of Biochemistry Life at the Molecular Level 4th Edition Donald Voet https://testbanklab.com/download/test-bank-fundamentals-biochemistry-life-molecular-level-
What is a proteome and how is the link between an organisms genome and a proteome.
 Answer to exam questions Bi2014 autumn 2013. Question 1a. What is a proteome and how is the link between an organisms genome and a proteome. The answer should discuss the following topics: What is a genome,
B. Incorrect! Ligation is also a necessary step for cloning.
 Genetics - Problem Drill 15: The Techniques in Molecular Genetics No. 1 of 10 1. Which of the following is not part of the normal process of cloning recombinant DNA in bacteria? (A) Restriction endonuclease
Mass Spectrometry. Kyle Chau and Andrew Gioe
 Mass Spectrometry Kyle Chau and Andrew Gioe Computation of Molecular Mass - Mass Spectrum is a plot of intensity as a function of masscharge ratio, m/z. - Mass-charge ratio can be determined through accelerating
AGILENT S BIOINFORMATICS ANALYSIS SOFTWARE
 ACCELERATING PROGRESS IS IN OUR GENES AGILENT S BIOINFORMATICS ANALYSIS SOFTWARE GENESPRING GENE EXPRESSION (GX) MASS PROFILER PROFESSIONAL (MPP) PATHWAY ARCHITECT (PA) See Deeper. Reach Further. BIOINFORMATICS
GREG GIBSON SPENCER V. MUSE
 A Primer of Genome Science ience THIRD EDITION TAGCACCTAGAATCATGGAGAGATAATTCGGTGAGAATTAAATGGAGAGTTGCATAGAGAACTGCGAACTG GREG GIBSON SPENCER V. MUSE North Carolina State University Sinauer Associates, Inc.
Rapid Method for the Purification of Total RNA from Formalin- Fixed Paraffin-Embedded (FFPE) Tissue Samples
 Tissue Samples") Application Note 17 RNA Sample Preparation Rapid Method for the Purification of Total RNA from Formalin- Fixed Paraffin-Embedded (FFPE) Tissue Samples M. Melmogy 1, V. Misic 1, B. Lam, PhD 1, C. Dobbin,
Application Note 17 RNA Sample Preparation Rapid Method for the Purification of Total RNA from Formalin- Fixed Paraffin-Embedded (FFPE) Tissue Samples M. Melmogy 1, V. Misic 1, B. Lam, PhD 1, C. Dobbin,
DISCOVERY AND VALIDATION OF TARGETS AND BIOMARKERS BY MASS SPECTROMETRY-BASED PROTEOMICS. September, 2011
 DISCOVERY AND VALIDATION OF TARGETS AND BIOMARKERS BY MASS SPECTROMETRY-BASED PROTEOMICS September, 2011 1 CAPRION PROTEOMICS Leading proteomics-based service provider - Biomarker and target discovery
Zakopane, April, 2011
 Clinical Proteomics: A Technology to shape the future? Zakopane, April, 2011 Protein Chemistry/Proteomics/Peptide Synthesis and Array Unit Institute of Biomedicine/Anatomy Biomedicum Helsinki, 00014 University
Gene expression analysis: Introduction to microarrays
 Gene expression analysis: Introduction to microarrays Adam Ameur The Linnaeus Centre for Bioinformatics, Uppsala University February 15, 2006 Overview Introduction Part I: How a microarray experiment is
ChIP-seq and RNA-seq
 ChIP-seq and RNA-seq Biological Goals Learn how genomes encode the diverse patterns of gene expression that define each cell type and state. Protein-DNA interactions (ChIPchromatin immunoprecipitation)
3.1.4 DNA Microarray Technology
 3.1.4 DNA Microarray Technology Scientists have discovered that one of the differences between healthy and cancer is which genes are turned on in each. Scientists can compare the gene expression patterns
NPTEL
 NPTEL Syllabus Proteomics: Principles and Techniques - Video course COURSE OUTLINE An introduction to proteomics: Basics of protein structure and function, An overview of systems biology, Evolution from
Parallel analysis of translated ORF (PLATO)
") Parallel analysis of translated ORF (PLATO) Technical Journal Club 16.04.2013 Mary-Aude Rochat, PhD student Speck group Proteomics Rationale: Increase in the DNA sequence information Understand biological
Parallel analysis of translated ORF (PLATO) Technical Journal Club 16.04.2013 Mary-Aude Rochat, PhD student Speck group Proteomics Rationale: Increase in the DNA sequence information Understand biological
MICROARRAYS: CHIPPING AWAY AT THE MYSTERIES OF SCIENCE AND MEDICINE
 MICROARRAYS: CHIPPING AWAY AT THE MYSTERIES OF SCIENCE AND MEDICINE National Center for Biotechnology Information With only a few exceptions, every
Methods of Biomaterials Testing Lesson 3-5. Biochemical Methods - Molecular Biology -
 Methods of Biomaterials Testing Lesson 3-5 Biochemical Methods - Molecular Biology - Chromosomes in the Cell Nucleus DNA in the Chromosome Deoxyribonucleic Acid (DNA) DNA has double-helix structure The
Topic 2: Proteins. 2-1 specific proteins can be purified from cell extracts. Molecular Biology and Public Health ( 分子生物学与公共卫生 )
") HAPTER20: Techniques of Molecular Biology Molecular Biology and Public Health ( 分子生物学与公共卫生 ) -------Protein manipulation ( 蛋白操作 ) Topic 2: Proteins 1. Protein purification ( 蛋白质纯化 ) 2. Affinity chromatography
HAPTER20: Techniques of Molecular Biology Molecular Biology and Public Health ( 分子生物学与公共卫生 ) -------Protein manipulation ( 蛋白操作 ) Topic 2: Proteins 1. Protein purification ( 蛋白质纯化 ) 2. Affinity chromatography
Strategies for Quantitative Proteomics. Atelier "Protéomique Quantitative" La Grande Motte, France - June 26, 2007
 Strategies for Quantitative Proteomics Atelier "Protéomique Quantitative", France - June 26, 2007 Bruno Domon, Ph.D. Institut of Molecular Systems Biology ETH Zurich Zürich, Switzerland OUTLINE Introduction
BIOTECHNOLOGY. Course Syllabus. Section A: Engineering Mathematics. Subject Code: BT. Course Structure. Engineering Mathematics. General Biotechnology
 BIOTECHNOLOGY Subject Code: BT Course Structure Sections/Units Section A Section B Unit 1 Unit 2 Unit 3 Unit 4 Unit 5 Unit 6 Unit 7 Section C Section D Section E Topics Engineering Mathematics General
Exam MOL3007 Functional Genomics
 Faculty of Medicine Department of Cancer Research and Molecular Medicine Exam MOL3007 Functional Genomics Tuesday May 29 th 9.00-13.00 ECTS credits: 7.5 Number of pages (included front-page): 5 Supporting
Chapter 10 Analytical Biotechnology and the Human Genome
 Chapter 10 Analytical Biotechnology and the Human Genome Chapter Outline Enzyme tests and biosensors DNA-based tests DNA analysis technologies Human genome and genome-based analytical methods 1 Enzyme-based
Introduction to Bioinformatics and Gene Expression Technologies
 Vocabulary Introduction to Bioinformatics and Gene Expression Technologies Utah State University Fall 2017 Statistical Bioinformatics (Biomedical Big Data) Notes 1 Gene: Genetics: Genome: Genomics: hereditary
Introduction to Bioinformatics and Gene Expression Technologies
 Introduction to Bioinformatics and Gene Expression Technologies Utah State University Fall 2017 Statistical Bioinformatics (Biomedical Big Data) Notes 1 1 Vocabulary Gene: hereditary DNA sequence at a