The European Medical Technology Industry. in figures / 2018
|
|
|
- Silvester Shields
- 6 years ago
- Views:
Transcription


1 The European Medical Technology Industry in figures / 2018
2 Table of contents What is Medical Technology? 4 Innovation 10 Employment 14 Companies 18
3 Expenditure on Medical Technology 20 MedTech Market in Europe 24 Trade in Europe 32 About MedTech Europe 38


4 What is Medical Technology?
5 Medical technology is any technology used to save lives or transform the health of individuals suffering from a wide range of conditions. In its many forms, medical technology is already diagnosing, monitoring and treating virtually every disease or condition that affects us. For the sake of this document, medical technology includes medical devices and in vitro diagnostic medical devices. Medical devices are products intended to perform a therapeutic or diagnostic action on human beings by physical means. In vitro diagnostic medical devices are products which provide medically useful diagnostic information by examination of a specimen derived from the human body. What is Medical Technology? 5

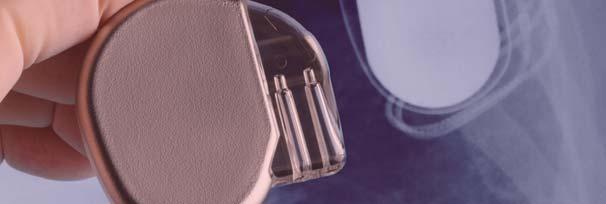
6 There are more than 500,000 medical technologies currently available and they all share a common purpose: improving, extending and transforming people s lives. Medical technology can be familiar, everyday products such as blood glucose meters, sticking plasters, syringes or latex gloves. Alternatively, it can also be pregnancy tests, spectacles, wheelchairs and hearing aids. Meanwhile, Visual 1: at Diversity the high-tech and end classification of the scale, medical of medical technology technology includes molecular diagnostics, total Medical body scanners, Devices ultrasounds, life-supporting machines, implantable devices such as heart valves In Vitro and pacemakers, Diagnostics neurostimulators and replacement joints for knees and hips. The common thread through all applications of medical technology is the beneficial impact on health, quality of life and in society as a whole. Medical technologies contribute to living longer and better, and empower citizens to contribute to society for longer. In so doing, they improve the quality of care and the efficacy, efficiency and sustainability of healthcare systems. 6 What is Medical Technology?

7 Regulation and classification of medical technologies In the European Union, medical technologies are tightly regulated by laws that govern the safety and performance of devices across their lifetime, pre- and post-market. Over the next few years, the European medical technology sector will transition from being regulated under the current medical devices directives to two new regulations. What is Medical Technology? 7
8 Classification of in vitro diagnostic medical devices Today, the in vitro diagnostic (IVD) sector is regulated by Directive 98/79/EC. From 26 May 2022, the new Regulation 2017/746/EU will fully apply. Until this date, manufacturers can choose to comply with either the Directive or the Regulation. Classification of IVDs is important as it determines the level of involvement by a third party (the notified body ) in assessing IVDs both pre- and post-market. This level of control is generally relative to the risk of an erroneous result from the assay. Under the IVD Directive, IVDs are classified into four classes following a positive list approach: Annex II List A Annex II List B Devices for self-testing Self-declared devices (e.g. ABO bloodtyping) (e.g. blood glucose monitoring) (e.g. pregnancy tests) (e.g. clinical chemistry analyser) Under the IVD Regulation, all IVDs will be classified under a new risk-based classification system according to the risk the device poses to the health of the public and or an individual as result of an incorrect test result. All IVDs will be classified under class A, B, C or D, with class D being the highest risk class. 8 What is Medical Technology?
9 Classification of medical devices The medical device (MD) sector is regulated by Directives 93/42/EC and 90/385/EEC. From 26 May 2020, the new Regulation 2017/745/EU will fully apply. Until this date, manufacturers can choose to comply with either the Directives or the Regulation. Classification of medical devices (estimated to be more than ) drives many pre- and postmarket requirements. Due to the large variety of products, the level of control made by a thirdparty (the notified body ) before placing them in the market depends on the level of impact on the human body that their use might imply. The same notified body is involved post-market to ensure the continued safety and performance of medical devices. Under the MD Directive, MDs are classified into 4 classes following a risk based classification system: Class I Class IIa Class IIb Class III (e.g. simple bandages or wound care products) (e.g. syringes without the needle) (e.g. anaesthesia machines) (e.g. pacemakers) Under the new MD Regulation, the risk-based classification system contained in the current Directives has been maintained, although some changes/additions have been introduced. The principle is the same: to link the class of the device to the potential risk posed to the health of the public and an individual as result of fault in the functioning. All MDs are classified under class I, IIA, IIB or III, with class III being the highest risk class. What is Medical Technology? 9


10 Innovation
11 Medical technology is characterised by a constant flow of innovation, which is the result of a high level of research and development within the industry, and of close co-operation with the users. Products typically have a lifecycle of only months before an improved product becomes available. In 2016, more than 12,200 patent applications were filed with the European Patent Office (EPO) in the field of medical technology 7.7% of the total number of applications, still more than any other sector in Europe. 41% of these patent applications were filed from European countries (EU28, Norway and Switzerland) and 59% from other countries, out of which with the majority of applications filed from the US (38%). In comparison, around 5,700 applications were filed in the pharmaceutical field and around 5,700 also in the field of biotechnology. While over the last decade the number of EPO filings in the field of medical technology has doubled, pharma and biotech patent applications were relatively stagnant 1. PATENT APPLICATION IN MEDICAL TECHNOLOGY FIELD FILLED WITH EPO IN % EU28, Norway and Switzerland 59% Other countries Innovation 11
12 TOP 10 TECHNICAL FIELDS IN PATENT APPLICATIONS. NUMBER OF PATENT APPLICATIONS FILED WITH EPO, 2016 (REF. 1) 12,263 MEDICAL TECHNOLOGY 10,915 10,657 DIGITAL COMMUNICATION COMPUTER TECHNOLOGY 10,293 ELECTRICAL MACHINERY, APPARATUS, ENERGY 8,402 7,442 6,301 TRANSPORT MEASUREMENT ENGINES, PUMPS, TURBINES 6,189 5,754 5,744 ORGANIC FINE CHEMISTRY PHARMACEUTICALS BIOTECHNOLOGY
13 EVOLUTION OF EUROPEAN PATENT APPLICATIONS BY TECHNICAL FIELD (REF. 1) Medical technology Biotechnology Pharmaceuticals Innovation 13


14 Employment
15 >675,000 3 employees The European medical technology industry employs directly more than 675,000 people. Germany had the highest absolute number of people employed in the medical technology sector, while the number of medtech employees per capita is highest in Ireland and Switzerland. This high level of employment shows that the medical technology industry is an important player in the European economy. In comparison, the European pharmaceutical industry employs more than 740,000 people 2. Europe refers to EU 28, Norway and Switzerland unless specified otherwise. Employment 15
16 TOP 7 COUNTRIES WITH HIGHEST EMPLOYMENT IN THE MEDICAL TECHNOLOGY INDUSTRY (REF. 3) United Kingdom 100,000 Germany 210,000 Ireland 35,000 Switzerland 54,000 France 85,000 Spain 23,000 Italy 38, MedTech Market in Europe
17 NUMBER OF PEOPLE DIRECTLY EMPLOYED IN THE MEDICAL TECHNOLOGY INDUSTRY PER 10,000 INHABITANTS IN 2016 (REF. 3) Ireland 74 Switzerland 64 Denmark 26 Germany 25 Sweden 23 Belgium 15 UK 15 France 13 Italy 13 Netherlands 9 Spain 5 Greece 5 Portugal 4 Employment 17


18 Companies
19 27,000 medical technology companies in Europe 95% SMEs There are approximately 27,000 medical technology companies in Europe. Most of them are based in Germany, followed by the UK, Italy, Switzerland, France and Spain. Small and medium-sized companies (SMEs*) make up almost 95% of the medical technology industry, the majority of which employ less than 50 people (small and micro-sized companies) 3. *An enterprise is considered to be a SME if it employs fewer than 250 persons and has an annual turnover not exceeding 50 million (small company- employs fewer than 50 persons and has a turnover of less than 10 million). Companies 19


20 Expenditure on Medical Technology
21 203 Expenditure on medical technology per capita in Europe In Europe, an average of 10% of gross domestic product (GDP) is spent on healthcare. Of this figure, around 7.2% is attributed to medical technologies, i.e. less than 1% of GDP. The spending on medical technology is estimated to vary significantly across European countries, ranging from around 5% to 10% of the total healthcare expenditure 4. Expenditure on medical technology per capita in Europe is at around 203 (weighted average). Expenditure on Medical Technology 21
 76.")
22 BREAKDOWN OF TOTAL HEALTHCARE EXPENDITURE IN EUROPE (REF. 5) 7.2% Medical technology 0.7% In vitro diagnostics 15.9% Phamaceuticals & other medical non-durables 6.5% Medical devices (incl. imaging) 76.9% Inpatient & outpatient care, other 22 Expenditure on Medical Technology

23 Expenditure on Medical Technology 23


24 MedTech Market in Europe
25 110 billion market The European medical technology market in 2016 is estimated at roughly 110 billion 6. Based upon manufacturer prices the European medical technology market is estimated to make up 29% of the world market. It is the second largest medical technology market after the US (approximately 43%). MedTech Market in Europe 25
 GERMANY 28 % FRANCE 15 % UK 12 % ITALY 10 % SPAIN 6 % NETHERLANDS 4 % SWITZERLAND 4 % BELGIUM 3 % SWEDEN 2 % AUSTRIA 2 % OTHER 14 % 26 MedTech Market in Europe The biggest medtech markets in")
26 EUROPEAN MEDICAL DEVICE MARKET BY COUNTRY, BASED UPON MANUFACTURER PRICES, 2016 (REF. 6) GERMANY 28 % FRANCE 15 % UK 12 % ITALY 10 % SPAIN 6 % NETHERLANDS 4 % SWITZERLAND 4 % BELGIUM 3 % SWEDEN 2 % AUSTRIA 2 % OTHER 14 % 26 MedTech Market in Europe The biggest medtech markets in Europe are Germany, France, the United Kingdom, Italy and Spain 6. The same countries form the top 5 IVD markets in Europe 7.
 GERMANY 21 % ITALY 15 % FRANCE 13 % SPAIN 9 % UK")

27 EUROPEAN IVD MARKET BY COUNTRY, 2016 (REF. 7) GERMANY 21 % ITALY 15 % FRANCE 13 % SPAIN 9 % UK 9 % SWITZERLAND 4 % BELGIUM 3 % NETHERLANDS 3 % POLAND 3 % AUSTRIA 2 % OTHERS 17 % MedTech Market in Europe 27
 USA EUROPE JAPAN CHINA 43 % 29 % 7 % 6 % CANADA BRAZIL RUSSIA OTHER 2 % 1 % 1 % 11 % 28")
28 WORLD MEDICAL DEVICE MARKET BY REGION BASED UPON MANUFACTURER PRICES, 2016 (REF. 6) USA EUROPE JAPAN CHINA 43 % 29 % 7 % 6 % CANADA BRAZIL RUSSIA OTHER 2 % 1 % 1 % 11 % 28 MedTech Market in Europe
29 WORLD MEDICAL TECHNOLOGY MARKET BY AREA AND SALES GROWTH, (REF. 8) WW Market Share in % 16% 14% 12% 10% 8% 6% 4% 2% 0% Diagnostic imaging Orthopedics Wound management Cardiology Ophthalmics Drug delivery General & Plastic Surgery Dental In Vitro Diagnostics (IVD) Endoscopy +3.0% +3.5% +4.0% +4.5% +5.0% +5.5% +6.0% +6.5% +7.0% Source: Evaluate, September 2017 % Sales Growth: CAGR Medical technology offers solutions for many disease areas. On a worldwide perspective, in vitro diagnostics are the largest sector, followed by cardiology and diagnostic imaging 8. Note: Size of Bubble = WW Sales in 2022 MedTech Market in Europe 29
30 EUROPEAN MEDICAL DEVICE MARKET GROWTH RATES, BASED UPON MANUFACTURER PRICES, (REF. 6) 15% 10% 5% 0% % The European medical technology market has been growing on average by 4,4% per annum over the past 9 years. Demand fell in 2009 due to the economic crisis, resulting in a growth rate of only 1%. The market recovered in 2010, but growth rates fell back in MedTech Market in Europe
31 EUROPEAN IN VITRO DIAGNOSTICS MARKET GROWTH RATES, BASED UPON MANUFACTURER PRICES, (REF. 7) 5% 4% 3% 2% 1% 0% % -2% -3% -4% The European IVD market growth has been slowing down until 2013, while annual growth rates in the pre-crisis period were at around 2-4%. In 2013 the European market started to recover and the annual growth rate in 2016 was around 1%. * Market size estimated in manufacturers prices, not including margins, such as value added in the wholesaling and retailing, transportation costs, some taxes included in the final price, etc. MedTech Market in Europe 31


32 Trade in Europe
33 17.5 billion Estimation of Europe s trade surplus in 2016 Europe has a positive medical technology trade* balance of 17.5 billion (2016) and this represents a more than twofold increase since In comparison, the US medical technology trade surplus is at 5 billion. Compared to 2012, the main European medtech trade partners remain the same: the US, China and Japan (Ref 6). *Trade section does not include in vitro diagnostics in the figures for medical technology. Trade in Europe 33
 Russia 2.")

34 TOP EUROPEAN MEDICAL DEVICE EXPORT DESTINATIONS, 2016 (REF. 6) Russia 2.8% USA 36.9% China 10.3% Japan 5.4% India 1.9% Brazil 1.4% 34 Trade in Europe

35 TOP SUPPLIERS TO EUROPEAN MEDICAL DEVICE MARKET (IMPORTS), 2016 (REF. 6) Canada 3.0% USA 55.0% India 0,8% Singapore 2.0% China 10.0% Japan 5.0% Australia 4.0% Trade in Europe 35
36 EXPORT AND IMPORTS OF MEDICAL DEVICE BY COUNTRY 2016 (INCLUDING INTRA-COMMUNITY TRADE, MILLION EUROS) (REF. 6) MILLIONS GERMANY NETHERLANDS BELGIUM IRELAND SWITZERLAND FRANCE UNITED KINGDOM ITALY AUSTRIA DENMARK FINLAND SPAIN SWEDEN POLAND CZECH REPUBLIC 36 Trade in Europe
37 MEDICAL DEVICE TRADE BALANCE BY COUNTRY (INCLUDING INTRA-COMMUNITY TRADE, MILLION EUROS), 2016 (REF. 6) MILLIONS % IRELAND GERMANY SWITZERLAND NETHERLANDS BELGIUM FINLAND DENMARK HUNGARY AUSTRIA CZECH REPUBLIC LITHUANIA 46 ESTONIA LATVIA -61 BULGARIA SLOVENIA SWEDEN CROATIA SLOVAKIA ROMANIA POLAND PORTUGAL GREECE NORWAY -604 ITALY UK SPAIN FRANCE Trade in Europe 37


38 About MedTech Europe
39 MedTech Europe is the European trade association representing the medical technology industry from diagnosis to cure. We represent In-Vitro Diagnostics and Medical Devices manufacturers operating in Europe. MedTech Europe s mission is to make innovative medical technology available to more people, while helping healthcare systems move towards a sustainable path. MedTech Europe promotes a balanced policy environment that helps the medical technology industry meet Europe s growing healthcare needs and expectations. We also promote medical technology s value for Europe through our five-year industry strategy, which focuses on valuebased innovations that support more sustainable healthcare systems. We use economic research to show the benefits of medical technology and we organise many initiatives to explain the value we bring to Europe. We bring stakeholders together to discuss trends, issues and opportunities. Each year we also organise the European MedTech Forum, the largest health and industry policy conference in Europe, to engage with stakeholders on common topics of interest. About MedTech Europe 39
40 References 1 European Patent Office, MedTech Europe calculations. Medical technology as defined by World Intellectual Property Organization (based on the WIPO IPC-Technology concordance as revised in August 2014). European countries refer to EU + Norway, Switzerland. Patents are attributed by the country of residence of the applicant. 2 EFPIA The Pharmaceutical Industry in Figures. Key Data Europe refers to EU + Norway, Switzerland. 3 MedTech Europe calculation based on the data obtained from National Associations of 12 countries for the latest year available. Europe refers to EU + Norway, Switzerland. 4 WHO Global Health expenditure Database, Eurostat, BMI Research, MedTech Europe calculations based on the data obtained from National Associations of 15 countries for the latest year available. 5 BMI Research, WHO, Eurostat, EFPIA, EDMA, MedTech Europe calculations. Europe refers to EU + Norway, Switzerland. 6 BMI Research, MedTech Europe calculations. Manufacturer prices. Medical technology excluding in vitro diagnostics. 7 MedTech Europe - European IVD Market Statistics Report Worldwide Medtech Sales by EvaluateMedTech Device Area: Top 15 Categories & Total Market (2016 & 2022)-
41
42 MedTech Europe, 2017
43

44
The European Medical Technology Industry in figures
 The European Medical Technology Industry in figures Table of contents What is Medical Technology? 4 Innovation 10 Employment 14 Companies 18 Expenditure on Medical Technology 20 MedTech Market in Europe
The Innovation Union Scoreboard: Monitoring the innovation performance of the 27 EU Member States
 MEMO/12/74 Brussels, 7 February 2012 The Innovation Union Scoreboard: Monitoring the innovation performance of the 27 EU Member States This MEMO provides an overview of the research and innovation performance
CAP CONTEXT INDICATORS
 CAP CONTEXT INDICATORS 2014-2020 24. AGRICULTURAL TRAINING OF FARM MANAGERS 2017 update CONTEXT INDICATOR 24: AGRICULTURAL TRAINING OF FARM MANAGERS Learning by doing is still the main form of for the
Over the whole year 2011, GDP increased by 1.4% in the euro area and by 1.5% in the EU27, compared with +1.9% and +2.0% respectively in 2010.
 35/2012-6 March 2012 Second estimates for the fourth quarter of Euro area and EU27 down by 0.3% +0.7% and +0.9% respectively compared with the fourth quarter of 2010 decreased by 0.3% in both the euro
Sea freight data indicate weak import demand both in US and EU27. Data on inland road and rail freight indicate weak domestic activity
 Statistics Brief Global Trade and Transport July 2013 Global Freight Volumes Indicate Increasing Dependency on -led Growth The latest update of global freight data collected by the International Transport
International trade related air freight volumes move back above the precrisis level of June 2008 both in the EU area and in the Unites States;
 Statistics Brief Global Trade and Transport October 2017 Air freight volumes increase since the second quarter of 2016 The latest update of global freight data collected by the International Transport
FRAMEWORK CONVENTION ON CLIMATE CHANGE - Secretariat CONVENTION - CADRE SUR LES CHANGEMENTS CLIMATIQUES - Secrétariat KEY GHG DATA
 UNITED NATIONS NATIONS UNIES FRAMEWORK CONVENTION ON CLIMATE CHANGE - Secretariat CONVENTION - CADRE SUR LES CHANGEMENTS CLIMATIQUES - Secrétariat KEY GHG DATA Greenhouse Gas Emissions Data for 1990 2003
Emissions Trading System (ETS): The UK needs to deliver its share of the total EU ETS emissions reduction of 21% by 2020, compared to 2005;
: The UK needs to deliver its share of the total EU ETS emissions reduction of 21% by 2020, compared to 2005;") Emissions Trading System (ETS): The UK needs to deliver its share of the total EU ETS emissions reduction of 21% by 2020, compared to 2005; Non-ETS emissions: The Effort Sharing Decision sets a target
Emissions Trading System (ETS): The UK needs to deliver its share of the total EU ETS emissions reduction of 21% by 2020, compared to 2005; Non-ETS emissions: The Effort Sharing Decision sets a target
Session 13: Prequalification Within the Context of Global Fund Procurements
 Session 13: Prequalification Within the Context of Global Fund Procurements Established in 2002 Global Fund Attracts and disburses additional resources to prevent and treat AIDS, tuberculosis (TB), and
Energy demand dynamics and infrastructure development plans in the EU. October 10 th, 2012 Jonas Akelis, Managing Partner - Baltics
 Energy demand dynamics and infrastructure development plans in the EU October 10 th, 2012 Jonas Akelis, Managing Partner - Baltics Forecasted energy demand dynamics of EU-11 will be significantly higher
USA and EU27 external trade by sea and by air, measured in tonnes of goods moved, remain stagnant below pre-crisis (June 2008) levels;
 levels;") Statistics Brief July 2014 Global Trade and Transport Global freight data show diverging trends for developed and developing economies The latest update of global freight data collected by the International
Statistics Brief July 2014 Global Trade and Transport Global freight data show diverging trends for developed and developing economies The latest update of global freight data collected by the International
Even implementation of the EU Timber Regulation Harmonizing and improving the implementation of the EUTR in the EUTR countries
 Even implementation of the EU Timber Regulation Harmonizing and improving the implementation of the EUTR in the EUTR countries Thünen Institute, 09 October 2018, Hamburg EUTR EU MS obligations for application
The Fourth Community Innovation Survey (CIS IV)
") The Fourth Community Innovation Survey (CIS IV) THE HARMONISED SURVEY QUESTIONNAIRE The Fourth Community Innovation Survey (Final Version: October 20 2004) This survey collects information about product
The Fourth Community Innovation Survey (CIS IV) THE HARMONISED SURVEY QUESTIONNAIRE The Fourth Community Innovation Survey (Final Version: October 20 2004) This survey collects information about product
Market surveillance of medical devices
 Market surveillance of medical devices A Joint Action to reinforce public health protection and medical devices monitoring by implementing joint manufacturer inspections and improving clinical process
High-Level Public Administration Conference For a Business-Friendly Public Administration Brussels, 29 October 2013
 European Institute of Public Administration - Institut européen d administration publique High-Level Public Administration Conference For a Business-Friendly Public Administration Brussels, 29 October
ENERGY PRIORITIES FOR EUROPE
 ENERGY PRIORITIES FOR EUROPE Presentation of J.M. Barroso, President of the European Commission, to the European Council of 4 February 2011 Contents 1 I. Why energy policy matters II. Why we need to act
Performance of Rural Development Programmes of the period - Your Voice
 Performance of Rural Development Programmes of the 2007-2013 period - Your Voice Fields marked with * are mandatory. Introduction The Commission will use the information gathered through this survey together
Surface freight volumes, measured in tonne-kilometres of goods transported, show signs of a slowing down in China and Russia.
 Statistics Brief Global Trade and Transport October 2015 Air Freight Volumes Indicate Slowing Growth in the Second Quarter 2015 The latest update of global freight data collected by the International Transport
Siemens Partner Program
 Siemens Partner Program Factory Automation Partner Strategy for Factory Automation End Customer Focus on core competencies Demand on efficient solutions Certified Partner Added value in solutions and services
Environmental statistics in Europe Facts and figures on the environment: from environmental taxes to water resources
 STAT/10/189 10 December 2010 Environmental statistics in Europe Facts and figures on the environment: from environmental taxes to water resources What share of fresh water resources is being abstracted
Example of using detailed statistics: The case of poplar markets in EU
 Example of using detailed statistics: The case of poplar markets in EU Arvydas Lebedys FAO Forestry Officer (Statistics) Eurostat Forestry Statistics Working Group Meeting, Luxembourg, 16-17 November 2011
EUROPEAN COUNCIL Brussels, 31 May 2013 (OR. en)
") EUROPEAN COUNCIL Brussels, 31 May 2013 (OR. en) Interinstitutional File: 2013/0900 (NLE) EUCO 110/13 INST 234 POLG 69 OC 295 LEGAL ACTS Subject: DRAFT EUROPEAN COUNCIL DECISION establishing the composition
EUROPEAN COUNCIL Brussels, 31 May 2013 (OR. en) Interinstitutional File: 2013/0900 (NLE) EUCO 110/13 INST 234 POLG 69 OC 295 LEGAL ACTS Subject: DRAFT EUROPEAN COUNCIL DECISION establishing the composition
Detailed Data from the 2010 OECD Survey on Public Procurement
 ANNEX G Detailed Data from the 2010 OECD Survey on Public Procurement This annex provides data for each responding country on the transparency of the public procurement cycle, as well as the online availability
12. Waste and material flows
 1 Environmental signals 22 12. Waste and material flows policy issue indicator assessment decoupling resource use from economic activity decoupling waste generation from economic activity reducing generation
The Community Innovation Survey 2010
 The Community Innovation Survey 2010 (CIS 2010) THE HARMONISED SURVEY QUESTIONNAIRE The Community Innovation Survey 2010 FINAL VERSION July 9, 2010 This survey collects information on your enterprise s
CAP CONTEXT INDICATORS
 CAP CONTEXT INDICATORS 2014-2020 44. ENERGY USE IN AGRICULTURE, FORESTRY AND THE FOOD INDUSTRY 2017 update BE BG CZ DK DE EE IE EL ES FR HR IT CY LV LT LU HU MT NL AT PL PT RO SI SK FI SE UK CONTEXT INDICATOR
International Indexes of Consumer Prices,
 International Indexes of Consumer Prices, July International Labor Comparisons Table of Contents Highlights... 1 Monthly Charts.. Monthly Tables... Annual Charts..... 5 Annual Tables.. 7 Technical Notes..
EUROPE S ENERGY PORTAL
 EUROPE S ENERGY PORTAL METHODOLOGY GAS & ELECTRICTY PRICES Collect Analyze Report EUROPEAN UNION END-USERS Description of the process leading to the determination of end-user prices for natural gas and
Flash Eurobarometer 426. SMEs, Resource Efficiency and Green Markets
 SMEs, Resource Efficiency and Green Markets Fieldwork Publication December 2015 Survey requested by the European Commission, Directorate-General for Internal Market, Industry, Entrepreneurship and SMEs
Council of the European Union Brussels, 10 November 2016 (OR. en)
") Conseil UE Council of the European Union Brussels, 10 November 2016 (OR. en) Interinstitutional File: 2016/0186 (COD) 13660/16 LIMITE NOTE CULT 101 AELE 77 EEE 41 CODEC 1506 From: Permanent Representatives
Conseil UE Council of the European Union Brussels, 10 November 2016 (OR. en) Interinstitutional File: 2016/0186 (COD) 13660/16 LIMITE NOTE CULT 101 AELE 77 EEE 41 CODEC 1506 From: Permanent Representatives
Photo: Thinkstock. Wind in power 2010 European statistics. February The European Wind energy association
 Photo: Thinkstock Wind in power 21 European statistics February 211 1 WIND IN POWER: 21 EUROPEAN STATISTICS Contents Executive summary 21 annual installations Wind map 21 Wind power capacity installations
INNOVATION UNION SCOREBOARD 2011
 INNOVATION UNION SCOREBOARD 2011 The Innovation Union's performance scoreboard for Research and Innovation 7 February 2012 The IUS report, its annexes and the indicators database are available at http://www.proinno-europe.eu/metrics
How to improve collection on organic agriculture in the countries of Central and Eastern Europe
 Research Institute of Organic Agriculture FiBL info.suisse@fibl.org, How to improve collection on organic agriculture in the countries of Central and Eastern Europe Helga Willer and Julia Lernoud ICOAS
AMBITION OF RENEWABLE ENERGY TARGETS FOR THE EU IN 2030
 AMBITION OF RENEWABLE ENERGY TARGETS FOR THE EU IN CONCLUSIONS FROM THE REPORT BENCHMARKS FOR A MORE AMBITIOUS EU RENEWABLES TARGET COMMISSIONED BY EREF CORINNA KLESSMANN 17 OCTOBER 2017 1 / ECOFYS, A
At A Glance Summary of Q highlights
 At A Glance Summary of Q1 214 highlights Economic Bulletin Q1 214 EU food and drink industry evolution during Q1 214 against major economic trends in the EU EVOLUTION OF MAIN AGRICULTURAL RAW MATERIAL
Wind energy in Europe markets
 Wind energy in Europe markets Turkish Wind Energy Congress (TWEC 2012), 7 November 2012, Istanbul Christian Kjaer CEO European Wind Energy Association (EWEA) More than 600 members from almost 60 countries
Eurostat current work on resource-efficient circular economy Renato Marra Campanale
 Eurostat current work on resource-efficient circular economy Renato Marra Campanale Renato.Marra-Campanale@ec.europa.eu Eurostat Unit E2 'Environmental statistics and accounts; sustainable development'
How to secure Europe s competitiveness in terms of energy and raw materials? The answer, my friend, is blowing in the wind
 How to secure Europe s competitiveness in terms of energy and raw materials? The answer, my friend, is blowing in the wind Iván Pineda Head of Policy Analysis, EWEA PolyTalk 2014, Brussels Around 600 members
ANNEXES. to the COMMUNICATION FROM THE COMMISSION TO THE EUROPEAN PARLIAMENT AND THE COUNCIL
 EUROPEAN COMMISSION Brussels, 23.7.2014 COM(2014) 520 final ANNEXES 1 to 3 ANNEXES to the COMMUNICATION FROM THE COMMISSION TO THE EUROPEAN PARLIAMENT AND THE COUNCIL Energy Efficiency and its contribution
RFID Systems Radio Country Approvals
 SIMATIC Ident RFID Systems Radio Approvals 2017-12-17 www.siemens.com/ident Short Range Systems RF200 RF300 RF1060 MOBY D RF210R / RF220R 6GT2821-1AC10,-2AC10 RF210R / RF220R / RF240R/ RF250R/ RF260R IO-Link
Trends in waste generation and management in Europe. Özgür Saki European Environment Agency
 Trends in waste generation and management in Europe Özgür Saki European Environment Agency The European Environment Agency An EU institution situated in Copenhagen since 1994 Provides the information necessary
ANNUAL PUBLICATION: detailed data. VOLUME OF EXPORTS FELL BY 4,7 PER CENT IN 2015 Export prices rose 0,7 per cent. 24 March 2016
 ANNUAL PUBLICATION: detailed data 2 March 216 VOLUME OF EXPORTS FELL BY,7 PER CENT IN 21 Export prices rose,7 per cent According to Finnish Customs preliminary data, the value of Finland s goods exports
PPI Training. MODULE 2 The need to innovate in municipal waste management. PPI training Location of the training Date of the training.
 PPI Training MODULE 2 The need to innovate in municipal waste management PPI training Location of the training Date of the training Contents Status quo Waste management in Europe Drivers for innovation
Air freight volumes in tonnes of goods moved, considered as a lead indicator, have recovered above pre-crisis peak in the United States and EU-28.
 Statistics Brief Global Trade and Transport February 2015 Air freight volumes indicate a potential improvement of the near-term outlook The latest update of global freight data collected by the International
Making the Parcel Regulation work. 17th Königswinter Postal Seminar 5-7 February
 Making the Parcel Regulation work 17th Königswinter Postal Seminar 5-7 February 2018 1 A lot going on. 2 Not just a parcel More A journey 3 AT DE DK FI FR IE LU NL SE CY EL ES IT MT PT BG HR HU
ESF Ex-Post evaluation
 ESF 2007-2013 Ex-Post evaluation Fields marked with * are mandatory. Open public consultation Questionnaire Please consult the background document as it provides useful information on the European Social
The FMD Pack Coding, Sharing and Transition
 The FMD Pack Coding, Sharing and Transition Ask the expert Joan Cahill & Grant Courtney April 2017 Introduction Joan Cahill Director, Pfizer Packaging & Delivery Systems Member EFPIA Supply Chain Working
Solar Heat Worldwide
 Solar Heat Worldwide Markets and Contribution to the Energy Supply 2013 EDITION 2015 Franz Mauthner, Werner Weiss, Monika Spörk-Dür AEE INTEC AEE - Institute for Sustainable Technologies A-8200 Gleisdorf,
Environmental Best Practices, It Begins with Us: Business, Local Governments and International Community Should Work Together
 Environmental Best Practices, It Begins with Us: Business, Local Governments and International Community Should Work Together Jung Wan Lee, PhD Boston University, United States Objectives of the Paper
European Pharmaceutical Policy: Access for Patients or Improving Competitiveness
 European Pharmaceutical Policy: Access for Patients or Improving Competitiveness The s Vision Dr Stefaan Van der Spiegel Policy Officer, Unit F5 DG Enterprise and Industry Study day OSE / RIZIV-INAMI Brussels,
Innovation. Union. Scoreboard Enterprise and Industry
 Innovation Union Scoreboard 2013 Enterprise and Industry Legal notice: The views expressed in this report, as well as the information included in it, do not necessarily reflect the opinion or position
Quality of life indicators - natural and living environment
 Quality of life indicators - natural and living environment Statistics Explained Data from January 2018. Most recent data: Further Eurostat information, Main tables and Database. Planned update: January
10. Demand (light road freight veh shares)
") . Demand (light road freight veh shares) Overview Target The view is intended to calculate the share of light vehicles in total road freight vehicles. The light road freight vehicles are those belonging
. Demand (light road freight veh shares) Overview Target The view is intended to calculate the share of light vehicles in total road freight vehicles. The light road freight vehicles are those belonging
Resource efficiency and waste
 Municipal Municipal management across European See also: Country profiles on municipal management 1. Introduction Over the last two decades, European have increasingly shifted their focus with regard to
ASSESSING GOOD PRACTICES IN POLICIES AND MEASURES TO MITIGATE CLIMATE CHANGE IN CENTRAL AND EASTERN EUROPE. Elena Petkova
 Workshop on Best Practices in Policies and Measures, 8-10 October 2001, Copenhagen ASSESSING GOOD PRACTICES IN POLICIES AND MEASURES TO MITIGATE CLIMATE CHANGE IN CENTRAL AND EASTERN EUROPE Elena Petkova
Background of gas data transparency Gas data collection exercise: questionnaire, methodologies and definitions
 Background of gas data transparency Gas data collection exercise: questionnaire, methodologies and definitions Yuichiro Torikata Energy Analyst International Energy Forum What has been done so far Outcome
Online Appendix: How should we measure environmental policy stringency?
 University of Neuchatel Institute of Economic Research IRENE, Working paper 14-02 Online Appendix: How should we measure environmental policy stringency? A new approach Caspar Sauter* * University of Neuchatel
Correlations between energy economy and housing market prices in the EU-impacts on future sustainability
 Correlations between energy economy and housing market prices in the EU-impacts on future sustainability Maria Alexandra MAASSEN The Bucharest University of Economic Studies, Bucharest, Romania maria.nichifor@fabiz.ase.ro
Latest state-of-play EU Timber Regulation. Harmonizing and improving the implementation of the EUTR in the EUTR countries
 Latest state-of-play EU Timber Regulation Harmonizing and improving the implementation of the EUTR in the EUTR countries EU Forest Directors meeting, Sofia 12 April 2018 EU Timber Regulation - Key obligations
 2 ENERGY TECHNOLOGY RD&D BUDGETS: OVERVIEW (2017 edition) Released in October 2017. The IEA energy RD&D data collection and the analysis presented in this paper were performed by Remi Gigoux under the
Figure 1. Energy dependency of EU member states in 2004 (%)
") The ESTONIAN ENERGY SECTOR IN COMPARISON TO OTHER COUNTRIES Einari Kisel The n energy sector has undergone several significant changes in the past few years. The following article represents an effort
The ESTONIAN ENERGY SECTOR IN COMPARISON TO OTHER COUNTRIES Einari Kisel The n energy sector has undergone several significant changes in the past few years. The following article represents an effort
CAP CONTEXT INDICATORS
 CAP CONTEXT INDICATORS 2014-2020 33. FARMING INTENSITY 2017 update CONTEXT INDICATOR 33: FARMING INTENSITY Intensification is an important restructuring process that has characterised European agriculture
Munkaanyag
 TECHNICAL SPECIFICATION SPÉCIFICATION TECHNIQUE TECHNISCHE SPEZIFIKATION CEN/TS 16555-2 December 2014 ICS 03.100.50; 03.100.40 English Version Innovation management - Part 2: Strategic intelligence management
The Pharmaceutical Industry in Figures
 The Pharmaceutical Industry in Figures 2010 Edition SUMMARY Europe has a great deal to gain in health and economic terms from a strong and competitive indigenous researchbased pharmaceutical sector. The
Antitrust: Car price report shows price differentials for new cars in EU narrowing in 2010
 EUROPEAN COMMISSION - PRESS RELEASE Antitrust: Car price report shows price differentials for new cars in EU narrowing in 2010 Brussels, 26 July 2011 - The European Commission s latest car price report
European Label Industry Continues Dynamic Track Record in 2017
 European Label Industry Continues Dynamic Track Record in 2017 Total consumption of self-adhesive label materials in Europe amounted to 7.45 million m 2 in 2017, corresponding with a growth rate of 4.7%
Organic market & trade: what current figures don't say Raffaele Zanoli
 Organic market & trade: what current figures don't say Raffaele Zanoli Professor, Università Politecnica delle Marche Coordinator, FP7 OrganicDataNetwork project Development of the Organic Market in EU
Background paper. Electricity production from wind and solar photovoltaic power in the EU
 Background paper Electricity production from wind and solar photovoltaic power in the EU February 2018 1 The 2009 Lisbon Treaty gave the European Union (EU) the authority to develop an energy policy containing
Photo: Karpov. Wind in power 2009 European statistics. February 2010 THE EUROPEAN WIND ENERGY ASSOCIATION
 Photo: Karpov Wind in power 29 European statistics February 21 1 WIND IN POWER: 29 EUROPEAN STATISTICS Contents Executive summary 29 annual installations Wind map 29 Wind installations 29 Power capacity
Highlights. Figure 1. World Marketed Energy Consumption by Region,
 Highlights World energy consumption is projected to increase by 71 percent from 3 to 23. Fossil fuels continue to supply much of the energy used worldwide, and oil remains the dominant energy source. In
Cutting Red Tape The Member State point of view. Presentation by Hilde Van de Velde Bruges March 2010
 Cutting Red Tape The Member State point of view Presentation by Hilde Van de Velde Bruges March 2010 The Action Programme created a momentum for reducing administrative burdens and inspired MS to launch
IAB Adex Benchmark 2012 Daniel Knapp, IHS Electronics & Media
 IAB Adex Benchmark 2012 Daniel Knapp, IHS Electronics & Media ABOUT THE STUDY 2 3 A meta-analysis of online ad spend in Europe GROSS NET RATECARD Revenue Billed Revenue Billed No Agency commissions Campaigns
Rethinking E-Government Services
 Rethinking E-Government Services Session 3: Serving Citizens Becoming User-focused in the Provision of E-Government Services OECD-India meeting 4 December 2009 New Delhi, India Yih-Jeou Wang Head of Unit
.eu brand awareness. Domain names have a high awareness. About 81% of the European Internet population has heard of domain names.
 .eu brand awareness Domain names have a high awareness. About 81% of the European Internet population has heard of domain names. More than half of the European Internet population knows of the existence
ODYSSEE-MURE, a decision support tool for energy efficiency policy evaluation. Recent energy efficiency trends in the EU
 ODYSSEE-MURE, a decision support tool for energy efficiency policy evaluation Recent energy efficiency trends in the EU Didier Bosseboeuf, ADEME, project coordinator Bruno Lapillonne, Karine Pollier; Enerdata
The aim of this paper is to outline how PRO EUROPE and its members participate to these efforts through:
 POSITION PAPER Contribution of Packaging Recycling and Optimisation to reducing Climate Change February 2010 IN BRIEF Packaging recycling has led to positive environmental effects, including savings of
Fare clic per modificare lo stile del sottotitolo dello schema THE BIOTECH SECTOR IN ITALY AND LOMBARDY
 Fare clic per modificare lo stile del sottotitolo dello schema THE BIOTECH SECTOR IN ITALY AND TABLE OF CONTENT 1. THE BIOTECH SECTOR IN ITALY 2. : A LAND OF OPPORTUNITIES 3. : BIOTECH FACTS AND FIGURES
QUESTIONNAIRE FOR FIRMS. INNOVATION-BASED STRATEGIES FOR GLOBALIZATION Questionnaire for SECTOR NAME (COUNTRY NAME)
") VR Questionnaire Insert logo of partner institution here QUESTIONNAIRE FOR FIRMS INNOVATION-BASED STRATEGIES FOR GLOBALIZATION Questionnaire for SECTOR NAME (COUNTRY NAME) Person that makes the interview
VR Questionnaire Insert logo of partner institution here QUESTIONNAIRE FOR FIRMS INNOVATION-BASED STRATEGIES FOR GLOBALIZATION Questionnaire for SECTOR NAME (COUNTRY NAME) Person that makes the interview
Europe s Number One Medical Diagnostics Provider
 Europe s Number One Medical Diagnostics Provider English www.synlab.com A network of more than 1.000 medical experts Present in more than 30 countries on 4 continents Areas of expertise: human, veterinary,
This document is a preview generated by EVS
 TECHNICAL SPECIFICATION SPÉCIFICATION TECHNIQUE TECHNISCHE SPEZIFIKATION CEN/TS 16555-1 July 2013 ICS 03.100.50; 03.100.40 English Version Innovation Management - Part 1: Innovation Management System Management
GLOBAL COALITION FOR GOOD WATER GOVERNANCE
 GLOBAL COALITION FOR GOOD WATER GOVERNANCE Launched at the 2016 World Water Week in Stockholm, Sweden The OECD Principles on Water Governance On 4 June 2015, the OECD Principles on Water Governance were
This document is a preview generated by EVS
 TECHNICAL SPECIFICATION SPÉCIFICATION TECHNIQUE TECHNISCHE SPEZIFIKATION CEN/TS 16555-3 December 2014 ICS 03.100.40; 03.100.50 English Version Innovation management - Part 3: Innovation thinking Management
Munkaanyag
 TECHNICAL SPECIFICATION SPÉCIFICATION TECHNIQUE TECHNISCHE SPEZIFIKATION CEN/TS 16555-3 December 2014 ICS 03.100.40; 03.100.50 English Version Innovation management - Part 3: Innovation thinking Management
Sectoral Profile - Industry
 Sectoral Profile - Industry Energy consumption Energy consumption trends in EU There is a regular decrease in energy consumption since 2003, although there was growth in industrial activity from 2003 to
3. Future wood demand for energy
 UNECE/FAO Workshop on wood resource balances Part II: Future wood resource availability and demands presented by Sebastian Hetsch University of Hamburg Centre of Wood Science Udo Mantau Florian Steierer
Relating to the transnational hiring-out of workers in the framework of the provision of services
 FORM FOR USE (OPTIONAL) BY THE REQUESTING ADMINISTRATION I. REQUEST FOR INFORMATION Relating to the transnational hiring-out of workers in the framework of the provision of services Pursuant to Article
Solution Partner Program Global Perspective
 Solution Partner Program Global Perspective SPACe 2012 Siemens Process Automation Conference Business Development Solution Partner Program Copyright Siemens AG 2012. All rights reserved Solution Partner
This document is a preview generated by EVS
 TECHNICAL REPORT RAPPORT TECHNIQUE TECHNISCHER BERICHT CEN/TR 15628 July 2007 ICS 03.100.30 English Version Maintenance - Qualification of Maintenance personnel Maintenance - Qualification du personnel
This document is a preview generated by EVS
 TECHNICAL SPECIFICATION SPÉCIFICATION TECHNIQUE TECHNISCHE SPEZIFIKATION CEN/TS 16827-2 August 2015 ICS 11.100.10 English Version Molecular in vitro diagnostic examinations - Specifications for pre-examination
Digital Transformation on Ports, Transport and Logistics EURO MED TELCO FORUM 2016
 Digital Transformation on Ports, Transport and Logistics EURO MED TELCO FORUM 2016 Who we are Valenciaport Foundation is a private non-profit research centre of excellence created to carry out academic
This document is a preview generated by EVS
 TECHNICAL SPECIFICATION SPÉCIFICATION TECHNIQUE TECHNISCHE SPEZIFIKATION CEN/TS 16931-3-2 October 2017 ICS 35.240.20; 35.240.63 English Version Electronic invoicing - Part 3-2: Syntax binding for ISO/IEC
Outlook on WtE bottom ash recycling and EU policy
 Outlook on WtE bottom ash recycling and EU policy MAXIME PERNAL, CEWEP SEMINAR: BOTTOM ASH RECYCLING AS A COMPONENT FOR THE CIRCULAR ECONOMY 8 TH JUNE 2017 CEWEP - Confederation of European Waste-to-Energy
International Business Parcels Rate card
 International Business Parcels Rate card Tracked Effective from 3rd July 2017 Standard Tracked Tracked Signed Standard 1 Contents International Business Parcels services... 3 International Tracked... 4
GRI Sustainability Reporting Statistics Publication year By Report Services
 GRI Sustainability Reporting Statistics Publication year 2010 By Report Services GRI reports 1999-2010 2000 1800 1600 1400 1200 1000 800 600 400 200 0 1999 2000 2001 2002 2003 2004 2005 2006 2007 2008
Circular Economy and Energy Union
 Circular Economy and Energy Union Dr. Ella Stengler CEWEP Managing Director 16 June 2016, Rotterdam 8 th CEWEP Waste-to-Energy Congress 2016 1 Members CEWEP Confederation of European Waste-to-Energy Plants
That s Thuringia. Dinner Seminar in Akron / Ohio. on October 2, 2013
 That s Thuringia. Dinner Seminar in Akron / Ohio on October 2, 2013 Germany Germany Europe s Leading Economy Economic strength Norway Sweden Finland Estonia Ireland Denmark Latvia Russia China Export USA
Cancer survival trends and inequalities: what is the role for Europe?
 Cancer survival trends and inequalities: what is the role for Europe? European Joint Action on Comprehensive Cancer Control 2014-2017 Brussels, Belgium, 13 May 2015 Measures of cancer burden definition
A decade of oil demand
 A decade of oil demand World oil demand Eni has recently published the thirteenth edition of the 2014 World Oil and Gas Review, the annual statistical review on the world oil and gas market and the refining
Contribution of Forest Management Credits in Kyoto Protocol Compliance and Future Perspectives
 ADVANCES IN CLIMATE CHANGE RESEARCH 2(4): 171 177, 2011 www.climatechange.cn DOI: 10.3724/SP.J.1248.2011.00171 POLICY FORUM Contribution of Forest Management Credits in Kyoto Protocol Compliance and Future
Energy Statistics 2017 edition
 Energy Statistics 2017 edition COMPACT GUIDES Energy Union Lighting, heating, transport, industrial output: without energy we would have none of these essential day-to-day services that make we and our