The human noncoding genome defined by genetic diversity
|
|
|
- Monica Johns
- 6 years ago
- Views:
Transcription
1 SUPPLEMENTARY INFORMATION Letters In the format provided by the authors and unedited. The human noncoding genome defined by genetic diversity Julia di Iulio 1,5, Istvan Bartha 1,6, Emily H. M. Wong 1, Hung-Chun Yu 1, Victor Lavrenko 1, Dongchan Yang 2, Inkyung Jung 2, Michael A. Hicks 1, Naisha Shah 1, Ewen F. Kirkness 1, Martin M. Fabani 1,7, William H. Biggs 1, Bing Ren 3, J. Craig Venter 1,4 and Amalio Telenti 4,5 * 1 Human Longevity, Inc., San Diego, CA, USA. 2 Department of Biological Science, Korea Advanced Institute of Science & Technology, Daejeon, Korea. 3 Ludwig Institute for Cancer Research, La Jolla, CA, USA. 4 J. Craig Venter Institute, La Jolla, CA, USA. 5 Present address: Scripps Research Institute, La Jolla, CA, USA. 6 Present address: Swiss Federal Institute of Technology, Lausanne, Switzerland. 7 Present address: Verogen, San Diego, CA, USA. * atelenti@scripps.edu Nature Genetics Nature America Inc., part of Springer Nature. All rights reserved.
 on 162,997 ancestry-informative markers. Genomes are colored based on their major ancestries.")
2 Supplementary Figure 1 Genetic ancestry of the study population a, Number of genomes sharing each ancestry. b, Principal-component analysis (PCA) of the study population. PCA was performed using PLINK (1.9) on 162,997 ancestry-informative markers. Genomes are colored based on their major ancestries. EUR, European; AFR, African; EAS, East Asian; CSA, Central South Asian; ARM, Native American; ADMIX, admixed population group.
3
4 Supplementary Figure 2 Heptamer metrics in the human genome a, Cumulative distribution function of the total number of occurrence of each heptamer in the genome. Each dot (n = 16,384) represents a heptamer. b, Cumulative distribution function of the autosomal count scores. The count score represents the fraction of the middle nucleotide in a heptameric sequence that varies. Every circle (n = 16,384) represents a heptameric sequence. The size of the circles is proportional to the number of occurrences of the heptamer in the genome (plotted in a). c, Cumulative distribution function of the autosomal frequency scores. The frequency score represents the fraction of SNV at the middle nucleotide in a heptamer that varies with an allelic frequency > Every circle (n = 16,384) represents a heptameric sequence. The size of the circles is proportional to the number of occurrences of the heptamer in the genome (plotted in a). d, Cumulative distribution function of the autosomal tolerance scores. The tolerance score represents the probability of the middle nucleotide in a heptamer varying with an AF > Every circle (n = 16,384) represents a heptameric sequence. The size of the circles is proportional to the number of occurrences of the heptamer in the genome (plotted in a). e, Comparison of tolerance score separately computed on autosomes versus chromosome X. Each dot (n = 16,384) represents a heptamer. The r 2 represents the fraction of the variation explained by a linear regression model. The dashed line represents x = y. AF, allelic frequency; SNV, single-nucleotide variant.
5
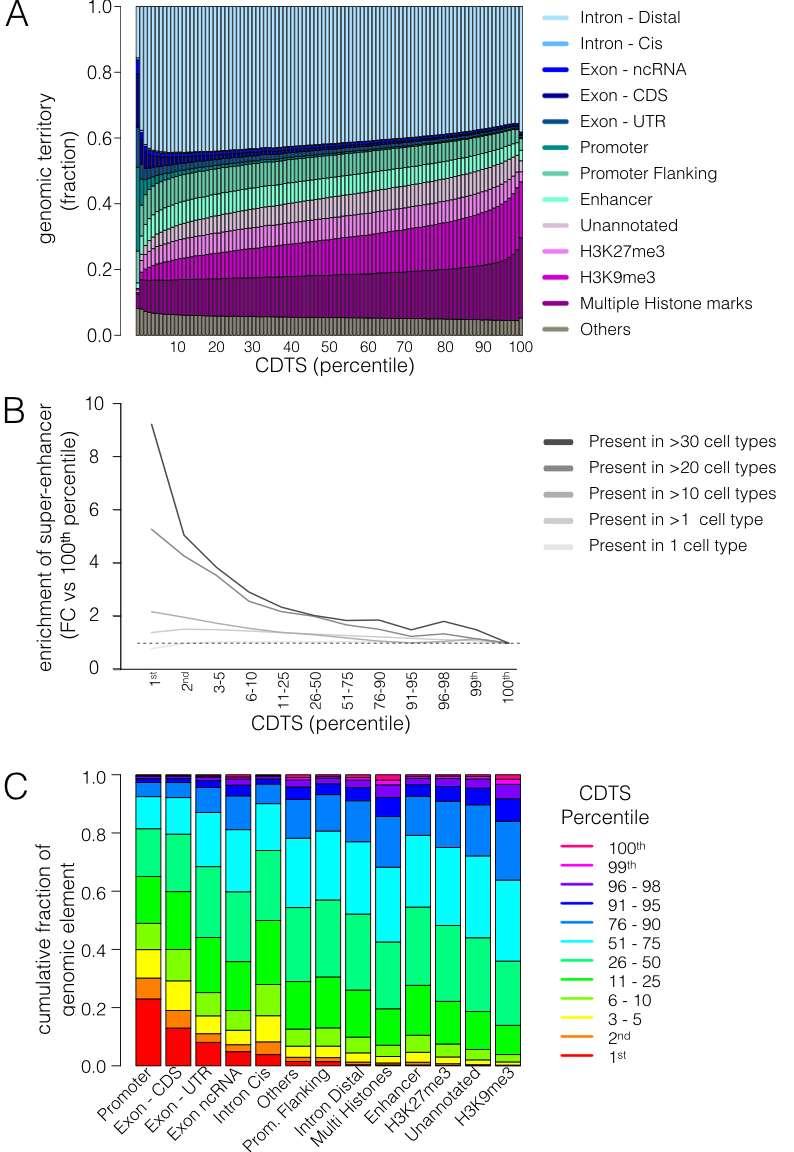
6 Supplementary Figure 3 Distribution of genomic elements within the CDTS spectrum a, The bar plot displays the cumulative territory fraction covered by each element family at different percentiles (1 to 100). Others refers to ENCODE element families that did not cover a substantial part of the genome individually (such as transcription factor binding sites; Methods). The elements appear in the same order as in the legend. b, Size-normalized distribution of super-enhancer annotation. The relative enrichment of the fraction of enhancer bins overlapping with super-enhancer annotation is calculated with regard to the 100th percentile. Super-enhancers were subcategorized depending on the number of cell types in which they were annotated, represented by the lines of multiple shades of gray. c, The bar plot displays the distribution of the total number of nucleotides within the percentile slices for each element family. The boxes within a bar indicate the fraction of elements in each percentile slice (e.g., 23% of the promoters are within the 1st percentile). The element families are ordered on the x axis by the fraction of elements within the 1stpercentile slice. The coloring of the boxes is in the same order as in the legend. CDS, coding sequence; ncrna, noncoding RNA; Prom., promoter; FC, fold change; CDTS, context-dependent tolerance score.
.")
7 Supplementary Figure 4 Distribution of chromosomes within the CDTS spectrum a, The bar plot displays the cumulative territory fraction covered by autosomes and chromosome X throughout the CDTS spectrum for unrelated individuals in the study (n = 7,794). b, The bar plot displays the cumulative territory fraction covered by each chromosome throughout the CDTS spectrum for unrelated individuals in the study. c, The bar plot displays the cumulative territory fraction covered by autosomes and chromosome X throughout the CDTS spectrum for all individuals in the study (n = 11,257). d, The bar plot displays the cumulative territory fraction covered by each chromosome throughout the CDTS spectrum for all individuals. e, The bar plot displays the cumulative territory fraction covered by autosomes and chromosome X throughout the CDTS spectrum for unrelated individuals (merged from this study and the gnomad Consortium; n = 23,290). f, The bar plot displays the cumulative territory fraction covered by each chromosome throughout the CDTS spectrum for unrelated individuals merged from this study and the gnomad Consortium. The coloring of the boxes is in the same order as in the legend. The difference in chromosome X distribution for the smaller population reflects the lack of power to discriminate variation at the allelic frequency threshold used. The distribution of chromosome X in all individuals and unrelated individuals (merged from this study and gnomad Consortium is very similar and indicates that the distribution stabilizes after reaching a sufficient number of chromosome X alleles. The autosome distribution is not subject to the same noise in the smaller study population, as both males and females provide two allele counts each. CDTS, contextdependent tolerance score; HLI, Human Longevity, Inc.,; gnomad, genome aggregation database (
. The percentiles are based on the rank of CDTS values.")
8 Supplementary Figure 5 Robustness of the approach with different study populations The bar plots display the cumulative territory fraction covered by each element family in the different percentile slices (indicated on the x axis). The percentiles are based on the rank of CDTS values. The similarity in distributions indicates that the CDTS metric is robust to downsampling or different population. Others refers to ENCODE element families that did not cover a substantial part of the genome individually (such as transcription factor binding sites; Methods). The elements appear in the same order as in the legend depicted below the bar plots. Every bar plot was obtained by computing CDTS with a different study population or subset of study populations. Unrelated are a subset of All. Unrelated EUR, AFR and ADMIX are a subset of unrelated. CDS, coding sequence; ncrna, noncoding RNA; EUR, European; AFR, African; ADMIX, admixed population group.
. The counts are normalized by the size of the respective percentile slices. The intensity of the coloring reflects the number of normalized counts.")
9 Supplementary Figure 6 Comparison of CDTS between study populations a, The heat map compares the CDTS percentiles computed with two different study populations: unrelated EUR (n = 4,436) and unrelated AFR (n = 1,087). The counts are normalized by the size of the respective percentile slices. The intensity of the coloring reflects the number of normalized counts. Overall matched CDTS percentiles are particularly dense at both ends of the spectrum. b, The figure illustrates the R 2 obtained through linear regression when comparing the CDTS percentiles of all study populations presented in Supplementary Fig. 5 (all, n = 11,257; unrelated, n = 7,794; unrelated AFR, n = 1,087; unrelated EUR, n = 4,436; unrelated ADMIX, n = 1,763; 1000 Genomes, n = 2,504). The linear regression for each comparison was computed with the percentileslice-size-normalized counts, as depicted in a. There is strong agreement in genome domains that have high constraint across ancestries. However, we observed occasional differences among ancestry groups that will merit attention to separate technical noise (sequencing, alignment, limited data for some populations) from biologically relevant differences. One possibility is that recent population growth may have resulted in changes in the patterns of deleterious genetic variation and genome structure with consequences for fitness and disease architecture. Unrelated are a subset of All. Unrelated EUR, AFR and ADMIX are a subset of unrelated. EUR, European; AFR, African; ADMIX, admixed population group.
 and the overlap region of CDTS and GERP ( Intersection ). Boxes in the bar correspond to different element families.")
10 Supplementary Figure 7 Comparison of conserved regions assessed with CDTS and GERP a, Element family composition in the 1st-percentile regions of CDTS (the bar labeled as CTDS 1st ), GERP ( GERP 1st ) and the overlap region of CDTS and GERP ( Intersection ). Boxes in the bar correspond to different element families. Others refers to ENCODE element families that did not cover a substantial part of the genome individually (such as transcription factor binding sites; Methods). The coloring of the boxes is in the same order as in the legend. b, Absolute length of the 1st-percentile regions of CDTS, GERP and the overlap region of CDTS and GERP. Bins without GERP score, due to insufficient multiple-species alignments in the region, were not considered in the ranking process. This explains the total length difference between the 1st-percentile regions of CDTS and GERP. c, Element family composition in the first ten percentile regions of CDTS (the bar labeled as CTDS 1 10th ), GERP ( GERP 1 10th ) and the overlap region ( Intersection ). d, Absolute length of the first ten percentile regions of CDTS, GERP and the overlap region of CDTS and GERP. CDS, coding sequence; ncrna, noncoding RNA; CDTS, context-dependent tolerance score; GERP, Genomic Evolutionary Rate Profiling.
11
12 Supplementary Figure 8 CDTS distribution near coding regions a, Mean CDTS values are depicted for a 15-kb window up- and downstream of first exons (n = 39,948 for All genes/isoforms, shown in purple; n = 9,176 for Essential genes/isoforms, shown in red; Methods). The regional profile is distinct, indicating a general pattern of constraint around exons with more profound constrain around exons of essential genes. Any annotation indicates any sequence surrounding the first exon. b,c, The apparent symmetry for regions up- and downstream of the first exons shown in a disappears when only regions annotated as promoters and introns (upstream and downstream, respectively, of the exons) are considered in particular, in the immediate vicinity of the coding region (c). The asymmetric pattern supports the specific coordination between promoters and exons. d, The bar plots display the cumulative territory fraction covered by each element family upstream and downstream of the first exon (indicated on the x axis). As every protein-coding isoform was used to increase the power of the analysis, the annotation upstream/downstream of the first exon consists of a mixture of genomic elements. Others refers to ENCODE element families that did not cover a substantial part of the genome individually (such as transcription factor binding sites; Methods). The coloring of the boxes is in the same order as in the legend. e, Paired analysis of promoter:intron CDTS percentile. The upward signal indicates that the asymmetry in constrains surrounding the first exon is present in most genes/isoforms. f,g, GERP (f) and Eigen (g) mean percentile distributions in the vicinity of the first exon. The same set of exons were used as in a e. Shaded regions represent 95% CIs. CDTS, context-dependent tolerance score; GERP, Genomic Evolutionary Rate Profiling.
13 Supplementary Figure 9 Properties of topologically associating domains a, The plot depicts the cumulative distribution function of the mean CDTS values (in 10-kb windows) inside and outside TADs. TAD and non-tad regions were divided into 10-kb windows (the overhang windows were discarded if smaller than 1 kb). The most constrained TAD windows are those identified by Hi-C as present in five or more cell types. TAD in at least one cell type versus no TAD: Kolmogorov Smirnov two-sided test, P = The total number of windows per group was as follows: non-tad (n = 19,999 covering 139 Mb), TAD 1 cell type (n = 331,471 covering 2.4 Gb), TAD 2 cell types (n = 134,486 covering 911 Mb), TAD 5 cell types (n = 4,558 covering 29 Mb). b, The plot depicts the cumulative distribution function of the mean CDTS values (in 10-kb windows) of anchor and loop regions within TADs. Anchor and loop regions were divided into 10-kb windows (the overhang windows were discarded if smaller than 1 kb). The anchor regions are consistently more constrained than the loops within the same TADs. Anchor in at least one cell type versus loop in at least one cell type: Kolmogorov Smirnov two-sided test, P = The total number of windows per group is as follows: anchor 1 cell type (n = 2,954 covering 17 Mb), anchor 2 cell types (n = 1,321 covering 7 Mb), anchor 5 cell types (n = 38 covering 0.2 Mb), loop 1 cell type (n = 271,356 covering 1.8 Gb), loop 2 cell types (n = 117,581 covering 753 Mb), loop 5 cell types (n = 4,020 covering 24 Mb). TAD, topologically associating domain.
14 Supplementary Figure 10 The distribution of pathogenic variants a, The distribution of pathogenic variants across the different percentile slices is normalized by the size of protein-coding and noncoding regions in the respective percentile slices. The relative enrichment is calculated with regard to the 100th percentile. The total number of pathogenic variants was as follows: n = 120,608 protein-coding variants (dark blue) and n = 15,741 noncoding variants (orange), including n = 1,369 variants that are located more than 10 bp from a splice-site position (red) b, The distribution of noncoding pathogenic variants is depicted for CDTS (pink) and GERP (green). GERP as expected best captured the larger set of variants (n = 15,741) that mostly consisted of splice-site variants. c, Outside of the exon boundaries (>10 bp; n = 1,369) both methods are enriched for pathogenic noncoding variants at their lowest percentiles; however, the enrichment is more striking with the CDTS metric. GERP misclassifies variants at the least conserved regions. CDTS, context-dependent tolerance score; GERP, Genomic Evolutionary Rate Profiling; FC, fold change.
15 Supplementary materials The human non- coding genome defined by genetic diversity Julia di Iulio a, Istvan Bartha a, Emily H.M. Wong a, Hung- Chun Yu a, Victor Lavrenko a, Dongchan Yang b, Inkyung Jung b, Michael A. Hicks a, Naisha Shah a, Ewen F. Kirkness a, Martin M. Fabani a, William H. Biggs a, Bing Ren c, J. Craig Venter a,d* and Amalio Telenti a,d* Tables Supplementary Table 1. Size- normalized distribution of histone and transcription factor binding sites. The normalization is done with regards to multiple histone marks territory for histones and to Others territory for transcription factor binding sites. The relative enrichment/depletion, as well as the sample size of each element, is given in the table. A loess regression, a linear regression and a linear regression performed on the log data was computed for each combination. (Provided as a separate File, hg38 coordinates) Supplementary Table 2. Non- coding pathogenic variants from ClinVar and HGMD. The variants tagged as stringent are located >10bp from a splice site position. (Provided as a separate File, hg38 coordinates) Supplementary Table 3. Description of non- coding variants associated with Mendelian traits. (Provided as a separate File, hg38 coordinates) Supplementary Table 4. Distribution of non- coding variants associated with Mendelian traits per genomic elements. Supplementary Table 5. Distal interacting regions and associated genes identified by pchi- C. (Provided as a separate File, hg19 coordinates) 1
16 Supplementary Table 4. Distribution of non- coding variants associated with Mendelian traits Total number of variants per Element Number of variants within CDTS 1 st percentile (% total) Number of variants within CDTS 10 th percentile (% total) Intron (>10bp from SS) (4.0) 23 (18.5) UTR (51.8) 114 (67.1) Promoter (40.1) 41 (59.4) Promoter Flanking 9 5 (55.6) 8 (88.9) Enhancer 20 3 (15.0) 6 (30.0) Unannotated 0 0 (NA) 0 (NA) H3K27me3 1 0 (0) 0 (0) H3K9me3 0 0 (NA) 0 (NA) Multiple Histone marks 19 0 (0) 16 (84.2) Others 15 2 (13.3) 6 (40.0) Total (30.7) 214 (50.1) 2
Nature Biotechnology: doi: /nbt Supplementary Figure 1. Number and length distributions of the inferred fosmids.
 Supplementary Figure 1 Number and length distributions of the inferred fosmids. Fosmid were inferred by mapping each pool s sequence reads to hg19. We retained only those reads that mapped to within a
Chromosome-scale scaffolding of de novo genome assemblies based on chromatin interactions. Supplementary Material
 Chromosome-scale scaffolding of de novo genome assemblies based on chromatin interactions Joshua N. Burton 1, Andrew Adey 1, Rupali P. Patwardhan 1, Ruolan Qiu 1, Jacob O. Kitzman 1, Jay Shendure 1 1 Department
From Variants to Pathways: Agilent GeneSpring GX s Variant Analysis Workflow
 From Variants to Pathways: Agilent GeneSpring GX s Variant Analysis Workflow Technical Overview Import VCF Introduction Next-generation sequencing (NGS) studies have created unanticipated challenges with
Nature Structural & Molecular Biology: doi: /nsmb Supplementary Figure 1
 Supplementary Figure 1 Origin use and efficiency are similar among WT, rrm3, pif1-m2, and pif1-m2; rrm3 strains. A. Analysis of fork progression around confirmed and likely origins (from cerevisiae.oridb.org).
Supplementary Figures
 Supplementary Figures 1 Supplementary Figure 1. Analyses of present-day population differentiation. (A, B) Enrichment of strongly differentiated genic alleles for all present-day population comparisons
SUPPLEMENTAL MATERIALS
 SUPPLEMENL MERILS Eh-seq: RISPR epitope tagging hip-seq of DN-binding proteins Daniel Savic, E. hristopher Partridge, Kimberly M. Newberry, Sophia. Smith, Sarah K. Meadows, rian S. Roberts, Mark Mackiewicz,
BCHM 6280 Tutorial: Gene specific information using NCBI, Ensembl and genome viewers
 BCHM 6280 Tutorial: Gene specific information using NCBI, Ensembl and genome viewers Web resources: NCBI database: http://www.ncbi.nlm.nih.gov/ Ensembl database: http://useast.ensembl.org/index.html UCSC
Chimp Chunk 3-14 Annotation by Matthew Kwong, Ruth Howe, and Hao Yang
 Chimp Chunk 3-14 Annotation by Matthew Kwong, Ruth Howe, and Hao Yang Ruth Howe Bio 434W April 1, 2010 INTRODUCTION De novo annotation is the process by which a finished genomic sequence is searched for
user s guide Question 3
 Question 3 During a positional cloning project aimed at finding a human disease gene, linkage data have been obtained suggesting that the gene of interest lies between two sequence-tagged site markers.
Supplementary Figure 1
 number of cells, normalized number of cells, normalized number of cells, normalized Supplementary Figure CD CD53 Cd3e fluorescence intensity fluorescence intensity fluorescence intensity Supplementary
Genomes summary. Bacterial genome sizes
 Genomes summary 1. >930 bacterial genomes sequenced. 2. Circular. Genes densely packed. 3. 2-10 Mbases, 470-7,000 genes 4. Genomes of >200 eukaryotes (45 higher ) sequenced. 5. Linear chromosomes 6. On
Mate-pair library data improves genome assembly
 De Novo Sequencing on the Ion Torrent PGM APPLICATION NOTE Mate-pair library data improves genome assembly Highly accurate PGM data allows for de Novo Sequencing and Assembly For a draft assembly, generate
Mapping strategies for sequence reads
 Mapping strategies for sequence reads Ernest Turro University of Cambridge 21 Oct 2013 Quantification A basic aim in genomics is working out the contents of a biological sample. 1. What distinct elements
ARTS: Accurate Recognition of Transcription Starts in human
 ARTS: Accurate Recognition of Transcription Starts in human Sören Sonnenburg, Alexander Zien,, Gunnar Rätsch Fraunhofer FIRST.IDA, Kekuléstr. 7, 12489 Berlin, Germany Friedrich Miescher Laboratory of the
Transcription in Eukaryotes
 Transcription in Eukaryotes Biology I Hayder A Giha Transcription Transcription is a DNA-directed synthesis of RNA, which is the first step in gene expression. Gene expression, is transformation of the
user s guide Question 3
 Question 3 During a positional cloning project aimed at finding a human disease gene, linkage data have been obtained suggesting that the gene of interest lies between two sequence-tagged site markers.
Ensembl Tools. EBI is an Outstation of the European Molecular Biology Laboratory.
 Ensembl Tools EBI is an Outstation of the European Molecular Biology Laboratory. Questions? We ve muted all the mics Ask questions in the Chat box in the webinar interface I will check the Chat box periodically
ALSO: look at figure 5-11 showing exonintron structure of the beta globin gene
 S08 Biology 205 6/4/08 Reading Assignment Chapter 7: From DNA to Protein: How cells read the genome pg 237-243 on exons and introns (you are not responsible for the biochemistry of splicing: figures 7-15,16
Guided tour to Ensembl
 Guided tour to Ensembl Introduction Introduction to the Ensembl project Walk-through of the browser Variations and Functional Genomics Comparative Genomics BioMart Ensembl Genome browser http://www.ensembl.org
Personal Genomics Platform White Paper Last Updated November 15, Executive Summary
 Executive Summary Helix is a personal genomics platform company with a simple but powerful mission: to empower every person to improve their life through DNA. Our platform includes saliva sample collection,
Gene Expression - Transcription
 DNA Gene Expression - Transcription Genes are expressed as encoded proteins in a 2 step process: transcription + translation Central dogma of biology: DNA RNA protein Transcription: copy DNA strand making
MODULE 1: INTRODUCTION TO THE GENOME BROWSER: WHAT IS A GENE?
 MODULE 1: INTRODUCTION TO THE GENOME BROWSER: WHAT IS A GENE? Lesson Plan: Title Introduction to the Genome Browser: what is a gene? JOYCE STAMM Objectives Demonstrate basic skills in using the UCSC Genome
Association Mapping in Plants PLSC 731 Plant Molecular Genetics Phil McClean April, 2010
 Association Mapping in Plants PLSC 731 Plant Molecular Genetics Phil McClean April, 2010 Traditional QTL approach Uses standard bi-parental mapping populations o F2 or RI These have a limited number of
Hands-On Four Investigating Inherited Diseases
 Hands-On Four Investigating Inherited Diseases The purpose of these exercises is to introduce bioinformatics databases and tools. We investigate an important human gene and see how mutations give rise
SUPPLEMENTARY INFORMATION
 SUPPLEMENTARY INFORMATION doi:10.1038/nature09937 a Name Position Primersets 1a 1b 2 3 4 b2 Phenotype Genotype b Primerset 1a D T C R I E 10000 8000 6000 5000 4000 3000 2500 2000 1500 1000 800 Donor (D)
Biotechnology Explorer
 Biotechnology Explorer C. elegans Behavior Kit Bioinformatics Supplement explorer.bio-rad.com Catalog #166-5120EDU This kit contains temperature-sensitive reagents. Open immediately and see individual
Analysis of Biological Sequences SPH
 Analysis of Biological Sequences SPH 140.638 swheelan@jhmi.edu nuts and bolts meet Tuesdays & Thursdays, 3:30-4:50 no exam; grade derived from 3-4 homework assignments plus a final project (open book,
Interpreting RNA-seq data (Browser Exercise II)
") Interpreting RNA-seq data (Browser Exercise II) In previous exercises, you spent some time learning about gene pages and examining genes in the context of the GBrowse genome browser. It is important to
Interpreting RNA-seq data (Browser Exercise II) In previous exercises, you spent some time learning about gene pages and examining genes in the context of the GBrowse genome browser. It is important to
BayesPI-BAR: a new biophysical model for characterization of regulatory sequence variations
 Published online 21 July 2015 Nucleic Acids Research, 2015, Vol. 43, No. 21 e147 doi: 10.1093/nar/gkv733 BayesPI-BAR: a new biophysical model for characterization of regulatory sequence variations Junbai
Figure S1: NUN preparation yields nascent, unadenylated RNA with a different profile from Total RNA.
 Summary of Supplemental Information Figure S1: NUN preparation yields nascent, unadenylated RNA with a different profile from Total RNA. Figure S2: rrna removal procedure is effective for clearing out
Temperature sensitive gene expression: Two rules.
 32 Research Notes Dros. Inf. Serv. 92 (2009) Temperature sensitive gene expression: Two rules. Gupta, Anand P. Johnson C. Smith University, Department of Science and Mathematics, 100 Beatties Ford Road,
Perm-seq: Mapping Protein-DNA Interactions in Segmental Duplication and Highly Repetitive Regions of Genomes with Prior- Enhanced Read Mapping
 RESEARCH ARTICLE Perm-seq: Mapping Protein-DNA Interactions in Segmental Duplication and Highly Repetitive Regions of Genomes with Prior- Enhanced Read Mapping Xin Zeng 1,BoLi 2, Rene Welch 1, Constanza
Analysis of Microarray Data
 Analysis of Microarray Data Lecture 3: Visualization and Functional Analysis George Bell, Ph.D. Senior Bioinformatics Scientist Bioinformatics and Research Computing Whitehead Institute Outline Review
Nucleic acids. What important polymer is located in the nucleus? is the instructions for making a cell's.
 Nucleic acids DNA - The Double Helix Recall that the nucleus is a small spherical, dense body in a cell. It is often called the "control center" because it controls all the activities of the cell including
Variant calling in NGS experiments
 Variant calling in NGS experiments Jorge Jiménez jjimeneza@cipf.es BIER CIBERER Genomics Department Centro de Investigacion Principe Felipe (CIPF) (Valencia, Spain) 1 Index 1. NGS workflow 2. Variant calling
Basic Concepts of Human Genetics
 Basic Concepts of Human Genetics The genetic information of an individual is contained in 23 pairs of chromosomes. Every human cell contains the 23 pair of chromosomes. One pair is called sex chromosomes
Supplementary Fig. 1 related to Fig. 1 Clinical relevance of lncrna candidate
 Supplementary Figure Legends Supplementary Fig. 1 related to Fig. 1 Clinical relevance of lncrna candidate BC041951 in gastric cancer. (A) The flow chart for selected candidate lncrnas in 660 up-regulated
iregnet3d: three-dimensional integrated regulatory network for the genomic analysis of coding and non-coding disease mutations
 Liang et al. Genome Biology (2017) 18:10 DOI 10.1186/s13059-016-1138-2 METHOD iregnet3d: three-dimensional integrated regulatory network for the genomic analysis of coding and non-coding disease mutations
Gene Regulation Solutions. Microarrays and Next-Generation Sequencing
 Gene Regulation Solutions Microarrays and Next-Generation Sequencing Gene Regulation Solutions The Microarrays Advantage Microarrays Lead the Industry in: Comprehensive Content SurePrint G3 Human Gene
Introduction to Microarray Data Analysis and Gene Networks. Alvis Brazma European Bioinformatics Institute
 Introduction to Microarray Data Analysis and Gene Networks Alvis Brazma European Bioinformatics Institute A brief outline of this course What is gene expression, why it s important Microarrays and how
Amapofhumangenomevariationfrom population-scale sequencing
 doi:.38/nature9534 Amapofhumangenomevariationfrom population-scale sequencing The Genomes Project Consortium* The Genomes Project aims to provide a deep characterization of human genome sequence variation
Analysis of a Tiling Regulation Study in Partek Genomics Suite 6.6
 Analysis of a Tiling Regulation Study in Partek Genomics Suite 6.6 The example data set used in this tutorial consists of 6 technical replicates from the same human cell line, 3 are SP1 treated, and 3
Supplementary Note: Detecting population structure in rare variant data
 Supplementary Note: Detecting population structure in rare variant data Inferring ancestry from genetic data is a common problem in both population and medical genetic studies, and many methods exist to
4.1. Genetics as a Tool in Anthropology
 4.1. Genetics as a Tool in Anthropology Each biological system and every human being is defined by its genetic material. The genetic material is stored in the cells of the body, mainly in the nucleus of
WORKSHOP. Transcriptional circuitry and the regulatory conformation of the genome. Ofir Hakim Faculty of Life Sciences
 WORKSHOP Transcriptional circuitry and the regulatory conformation of the genome Ofir Hakim Faculty of Life Sciences Chromosome conformation capture (3C) Most GR Binding Sites Are Distant From Regulated
TIGR THE INSTITUTE FOR GENOMIC RESEARCH
 Introduction to Genome Annotation: Overview of What You Will Learn This Week C. Robin Buell May 21, 2007 Types of Annotation Structural Annotation: Defining genes, boundaries, sequence motifs e.g. ORF,
The Genetic Code and Transcription. Chapter 12 Honors Genetics Ms. Susan Chabot
 The Genetic Code and Transcription Chapter 12 Honors Genetics Ms. Susan Chabot TRANSCRIPTION Copy SAME language DNA to RNA Nucleic Acid to Nucleic Acid TRANSLATION Copy DIFFERENT language RNA to Amino
SMARTer Ultra Low RNA Kit for Illumina Sequencing Two powerful technologies combine to enable sequencing with ultra-low levels of RNA
 SMARTer Ultra Low RNA Kit for Illumina Sequencing Two powerful technologies combine to enable sequencing with ultra-low levels of RNA The most sensitive cdna synthesis technology, combined with next-generation
Decoding Chromatin States with Epigenome Data Advanced Topics in Computa8onal Genomics
 Decoding Chromatin States with Epigenome Data 02-715 Advanced Topics in Computa8onal Genomics HMMs for Decoding Chromatin States Epigene8c modifica8ons of the genome have been associated with Establishing
T and B cell gene rearrangement October 17, Ram Savan
 T and B cell gene rearrangement October 17, 2016 Ram Savan savanram@uw.edu 441 Lecture #9 Slide 1 of 28 Three lectures on antigen receptors Part 1 (Last Friday): Structural features of the BCR and TCR
SNP calling and VCF format
 SNP calling and VCF format Laurent Falquet, Oct 12 SNP? What is this? A type of genetic variation, among others: Family of Single Nucleotide Aberrations Single Nucleotide Polymorphisms (SNPs) Single Nucleotide
Walk Through The Y Project. FTDNA Conference 2010 Houston TX Dipl.- Ing. Thomas Krahn
 Walk Through The Y Project FTDNA Conference 2010 Houston TX Dipl.- Ing. Thomas Krahn Participants - Origin Austria 1 Basque 2 Belarus 2 Belgium 2 Czech Republic 1 Egypt 1 Finland 3 France 7 Georgia 3 Germany
measuring gene expression December 5, 2017
 measuring gene expression December 5, 2017 transcription a usually short-lived RNA copy of the DNA is created through transcription RNA is exported to the cytoplasm to encode proteins some types of RNA
RNA-Sequencing analysis
 RNA-Sequencing analysis Markus Kreuz 25. 04. 2012 Institut für Medizinische Informatik, Statistik und Epidemiologie Content: Biological background Overview transcriptomics RNA-Seq RNA-Seq technology Challenges
Annotating 7G24-63 Justin Richner May 4, Figure 1: Map of my sequence
 Annotating 7G24-63 Justin Richner May 4, 2005 Zfh2 exons Thd1 exons Pur-alpha exons 0 40 kb 8 = 1 kb = LINE, Penelope = DNA/Transib, Transib1 = DINE = Novel Repeat = LTR/PAO, Diver2 I = LTR/Gypsy, Invader
ENCODE RBP Antibody Characterization Guidelines
 ENCODE RBP Antibody Characterization Guidelines Approved on November 18, 2016 Background An integral part of the ENCODE Project is to characterize the antibodies used in the experiments. This document
Gene Signal Estimates from Exon Arrays
 Gene Signal Estimates from Exon Arrays I. Introduction: With exon arrays like the GeneChip Human Exon 1.0 ST Array, researchers can examine the transcriptional profile of an entire gene (Figure 1). Being
Genome-wide association studies (GWAS) Part 1
 Part 1") Genome-wide association studies (GWAS) Part 1 Matti Pirinen FIMM, University of Helsinki 03.12.2013, Kumpula Campus FIMM - Institiute for Molecular Medicine Finland www.fimm.fi Published Genome-Wide Associations
Genome-wide association studies (GWAS) Part 1 Matti Pirinen FIMM, University of Helsinki 03.12.2013, Kumpula Campus FIMM - Institiute for Molecular Medicine Finland www.fimm.fi Published Genome-Wide Associations
DNA - The Double Helix
 DNA - The Double Helix Recall that the nucleus is a small spherical, dense body in a cell. It is often called the "control center" because it controls all the activities of the cell including cell reproduction,
RareVariantVis 2: R suite for analysis of rare variants in whole genome sequencing data.
 RareVariantVis 2: R suite for analysis of rare variants in whole genome sequencing data. Adam Gudyś and Tomasz Stokowy October 30, 2017 Introduction The search for causative genetic variants in rare diseases
Chapter 1 Analysis of ChIP-Seq Data with Partek Genomics Suite 6.6
 Chapter 1 Analysis of ChIP-Seq Data with Partek Genomics Suite 6.6 Overview ChIP-Sequencing technology (ChIP-Seq) uses high-throughput DNA sequencing to map protein-dna interactions across the entire genome.
Differential Gene Expression
 Biology 4361 Developmental Biology Differential Gene Expression September 28, 2006 Chromatin Structure ~140 bp ~60 bp Transcriptional Regulation: 1. Packing prevents access CH 3 2. Acetylation ( C O )
DNA - The Double Helix
 DNA - The Double Helix Recall that the nucleus is a small spherical, dense body in a cell. It is often called the "control center" because it controls all the activities of the cell including cell reproduction,
Full-length single-cell RNA-seq applied to a viral human. cancer: Applications to HPV expression and splicing analysis. Supplementary Information
 Full-length single-cell RNA-seq applied to a viral human cancer: Applications to HPV expression and splicing analysis in HeLa S3 cells Liang Wu 1, Xiaolong Zhang 1,2, Zhikun Zhao 1,3,4, Ling Wang 5, Bo
Runs of Homozygosity Analysis Tutorial
 Runs of Homozygosity Analysis Tutorial Release 8.7.0 Golden Helix, Inc. March 22, 2017 Contents 1. Overview of the Project 2 2. Identify Runs of Homozygosity 6 Illustrative Example...............................................
Systematic comparison of CRISPR/Cas9 and RNAi screens for essential genes
 CORRECTION NOTICE Nat. Biotechnol. doi:10.1038/nbt. 3567 Systematic comparison of CRISPR/Cas9 and RNAi screens for essential genes David W Morgens, Richard M Deans, Amy Li & Michael C Bassik In the version
Transcription Eukaryotic Cells
 Transcription Eukaryotic Cells Packet #20 1 Introduction Transcription is the process in which genetic information, stored in a strand of DNA (gene), is copied into a strand of RNA. Protein-encoding genes
PLINK gplink Haploview
 PLINK gplink Haploview Whole genome association software tutorial Shaun Purcell Center for Human Genetic Research, Massachusetts General Hospital, Boston, MA Broad Institute of Harvard & MIT, Cambridge,
DNA - The Double Helix
 Name Date Period DNA - The Double Helix Recall that the nucleus is a small spherical, dense body in a cell. It is often called the "control center" because it controls all the activities of the cell including
Machine Learning Methods for RNA-seq-based Transcriptome Reconstruction
 Machine Learning Methods for RNA-seq-based Transcriptome Reconstruction Gunnar Rätsch Friedrich Miescher Laboratory Max Planck Society, Tübingen, Germany NGS Bioinformatics Meeting, Paris (March 24, 2010)
Regulation of eukaryotic transcription:
 Promoter definition by mass genome annotation data: in silico primer extension EMBNET course Bioinformatics of transcriptional regulation Jan 28 2008 Christoph Schmid Regulation of eukaryotic transcription:
Name: Date: Pd: Nucleic acids
 Name: Date: Pd: DNA - The Double Helix Nucleic acids Recall that the nucleus is a small spherical, dense body in a cell. It is often called the "control center" because it controls all the activities of
DNA - The Double Helix
 DNA - The Double Helix Recall that the nucleus is a small spherical, dense body in a cell. It is often called the "control center" because it controls all the activities of the cell including cell reproduction,
Supplementary Figure 1: sgrna library generation and the length of sgrnas for the functional screen. (a) A diagram of the retroviral vector for sgrna
 A diagram of the retroviral vector for sgrna") Supplementary Figure 1: sgrna library generation and the length of sgrnas for the functional screen. (a) A diagram of the retroviral vector for sgrna expression. It contains a U6-promoter-driven sgrna
Supplementary Figure 1: sgrna library generation and the length of sgrnas for the functional screen. (a) A diagram of the retroviral vector for sgrna expression. It contains a U6-promoter-driven sgrna
Fig Ch 17: From Gene to Protein
 Fig. 17-1 Ch 17: From Gene to Protein Basic Principles of Transcription and Translation RNA is the intermediate between genes and the proteins for which they code Transcription is the synthesis of RNA
LECTURE: 22 IMMUNOGLOBULIN DIVERSITIES LEARNING OBJECTIVES: The student should be able to:
 LECTURE: 22 Title IMMUNOGLOBULIN DIVERSITIES LEARNING OBJECTIVES: The student should be able to: Identify the chromosome that contains the gene segments that encode the surface immunoglobulin heavy chain
Year III Pharm.D Dr. V. Chitra
 Year III Pharm.D Dr. V. Chitra 1 Genome entire genetic material of an individual Transcriptome set of transcribed sequences Proteome set of proteins encoded by the genome 2 Only one strand of DNA serves
Gene Expression Technology
 Gene Expression Technology Bing Zhang Department of Biomedical Informatics Vanderbilt University bing.zhang@vanderbilt.edu Gene expression Gene expression is the process by which information from a gene
GENETICS. I. Review of DNA/RNA A. Basic Structure DNA 3 parts that make up a nucleotide chains wrap around each other to form a
 GENETICS I. Review of DNA/RNA A. Basic Structure DNA 3 parts that make up a nucleotide 1. 2. 3. chains wrap around each other to form a Chains run in opposite direction known as Type of bond between the
Axiom mydesign Custom Array design guide for human genotyping applications
 TECHNICAL NOTE Axiom mydesign Custom Genotyping Arrays Axiom mydesign Custom Array design guide for human genotyping applications Overview In the past, custom genotyping arrays were expensive, required
Identification of the Photoreceptor Transcriptional Co-Repressor SAMD11 as Novel Cause of. Autosomal Recessive Retinitis Pigmentosa
 Identification of the Photoreceptor Transcriptional Co-Repressor SAMD11 as Novel Cause of Autosomal Recessive Retinitis Pigmentosa Corton M 1,2 *, Avila-Fernández A 1,2, Campello L 3, Sánchez M 1,2, Benavides
Name_BS50 Exam 3 Key (Fall 2005) Page 2 of 5
 Page 2 of 5") Name_BS50 Exam 3 Key (Fall 2005) Page 2 of 5 Question 1. (14 points) Several Hfr strains derived from the same F + strain were crossed separately to an F - strain, giving the results indicated in the table
Name_BS50 Exam 3 Key (Fall 2005) Page 2 of 5 Question 1. (14 points) Several Hfr strains derived from the same F + strain were crossed separately to an F - strain, giving the results indicated in the table
Differential Gene Expression
 Biology 4361 Developmental Biology Differential Gene Expression June 19, 2008 Differential Gene Expression Overview Chromatin structure Gene anatomy RNA processing and protein production Initiating transcription:
CS273B: Deep Learning in Genomics and Biomedicine. Recitation 1 30/9/2016
 CS273B: Deep Learning in Genomics and Biomedicine. Recitation 1 30/9/2016 Topics Genetic variation Population structure Linkage disequilibrium Natural disease variants Genome Wide Association Studies Gene
Humboldt Universität zu Berlin. Grundlagen der Bioinformatik SS Microarrays. Lecture
 Humboldt Universität zu Berlin Microarrays Grundlagen der Bioinformatik SS 2017 Lecture 6 09.06.2017 Agenda 1.mRNA: Genomic background 2.Overview: Microarray 3.Data-analysis: Quality control & normalization
Training materials.
 Training materials Ensembl training materials are protected by a CC BY license http://creativecommons.org/licenses/by/4.0/ If you wish to re-use these materials, please credit Ensembl for their creation
Data Mining in Bioinformatics Day 6: Classification in Bioinformatics
 Data Mining in Bioinformatics Day 6: Classification in Bioinformatics Karsten Borgwardt February 25 to March 10 Bioinformatics Group MPIs Tübingen Karsten Borgwardt: Data Mining in Bioinformatics, Page
Targeted Sequencing Reveals Large-Scale Sequence Polymorphism in Maize Candidate Genes for Biomass Production and Composition
 RESEARCH ARTICLE Targeted Sequencing Reveals Large-Scale Sequence Polymorphism in Maize Candidate Genes for Biomass Production and Composition Moses M. Muraya 1,2, Thomas Schmutzer 1 *, Chris Ulpinnis
PERSPECTIVES. A gene-centric approach to genome-wide association studies
 PERSPECTIVES O P I N I O N A gene-centric approach to genome-wide association studies Eric Jorgenson and John S. Witte Abstract Genic variants are more likely to alter gene function and affect disease
UCSC Genome Browser. Introduction to ab initio and evidence-based gene finding
 UCSC Genome Browser Introduction to ab initio and evidence-based gene finding Wilson Leung 06/2006 Outline Introduction to annotation ab initio gene finding Basics of the UCSC Browser Evidence-based gene
Lecture 20: Drosophila melanogaster
 Lecture 20: Drosophila melanogaster Model organisms Polytene chromosome Life cycle P elements and transformation Embryogenesis Read textbook: 732-744; Fig. 20.4; 20.10; 20.15-26 www.mhhe.com/hartwell3
How to view Results with Scaffold. Proteomics Shared Resource
 How to view Results with Scaffold Proteomics Shared Resource Starting out Download Scaffold from http://www.proteomes oftware.com/proteom e_software_prod_sca ffold_download.html Follow installation instructions
Eukaryotic Gene Structure
 Eukaryotic Gene Structure Terminology Genome entire genetic material of an individual Transcriptome set of transcribed sequences Proteome set of proteins encoded by the genome 2 Gene Basic physical and
Fusion Gene Analysis. ncounter Elements. Molecules That Count WHITE PAPER. v1.0 OCTOBER 2014 NanoString Technologies, Inc.
 Fusion Gene Analysis NanoString Technologies, Inc. Fusion Gene Analysis ncounter Elements v1.0 OCTOBER 2014 NanoString Technologies, Inc., Seattle WA 98109 FOR RESEARCH USE ONLY. Not for use in diagnostic
SUPPLEMENTARY INFORMATION
 SUPPLEMENTARY INFORMATION doi:10.1038/nature11112 Figure 1 Salient features of the m 6 A methylome. a, m 6 A punctuates RNA molecules mainly around the stop codon and in unusually long internal exons.
Computational Workflows for Genome-Wide Association Study: I
 Computational Workflows for Genome-Wide Association Study: I Department of Computer Science Brown University, Providence sorin@cs.brown.edu October 16, 2014 Outline 1 Outline 2 3 Monogenic Mendelian Diseases
Sept 2. Structure and Organization of Genomes. Today: Genetic and Physical Mapping. Sept 9. Forward and Reverse Genetics. Genetic and Physical Mapping
 Sept 2. Structure and Organization of Genomes Today: Genetic and Physical Mapping Assignments: Gibson & Muse, pp.4-10 Brown, pp. 126-160 Olson et al., Science 245: 1434 New homework:due, before class,
Class 35: Decoding DNA
 Class 35: Decoding DNA Sign up for your PS8 team design review! CS150: Computer Science University of Virginia Computer Science DNA Helix Photomosaic from cover of Nature, 15 Feb 2001 (made by Eric Lander)