Supplemental Information
|
|
|
- Edgar Briggs
- 6 years ago
- Views:
Transcription
1 Supplemental Information Itemized List Materials and Methods, Related to Supplemental Figures S5A-C and S6. Supplemental Figure S1, Related to Figures 1 and 2. Supplemental Figure S2, Related to Figure 1. Supplemental Figure S3, Related to Figure 2. Supplemental Figure S4, Related to Figure 2. Supplemental Figure S5, Related to Figures 3-7 Supplemental Figure S6, Related to Figures 3-7 Supplemental Figure S7, Related to Figure 3. Supplemental Figure S8, Related to Figure 7. Supplemental Figure S9, Related to Figure 7. Supplemental Figure S10, Related to Figure 7. Supplemental Figure S11, Related to Figures 3-7. Supplemental Figure S12, Related to Figures 3-7. Supplemental Movie S1, Related to Figure 1. Supplemental Movie S2, Related to Figure 1. Supplemental Movie S3, Related to Figure 2. Supplemental Movie S4, Related to Figure 2. Supplemental Movie S5, Related to Figure 2. Supplemental Movie S6, Related to Figure 3. 1
2 Supplemental Materials and Methods Measurement of the delay for expression of Dll1 WT and mutant genes To measure the delay for expression of Dll1 WT and mutant genes, we used the optogenetic control tool of gene expression (Imayoshi et al., 2013). The light-inducible Dll1 WT gene and Dll1 mutant gene reporters were constructed, as follows. Dll1 WT reporter (Dll1-luciferase fusion reporter) sequence and Dll1 type1/type2 mutant reporter sequences were obtained by BAC recombineering. To obtain the light-inducible Dll1 WT reporter, the region from the ATG sequence of Dll1 gene to the 3 UTR sequence was retrieved by T2A-pUAS vector, including Tol2 transposon target sites for integration of DNA fragments into genomic DNA and the repeated UAS sequences with TATA box, GAVPO target sites. To obtain the light-inducible Dll1 type1 mutant reporter, the region from the ATG sequence of Dll1 cdna to the 3 UTR was retrieved by T2ApUAS vector. In the case of Dll1 type2 mutant reporter, the region from the ATG of Dll1 cdna, inserted to the first exon of Dll1 gene, to the 3 UTR of Dll1 gene was retrieved. The retrieving vector also included the sequence of hgavpo under the control of PGK promoter, puromycin-registant gene for clone selection, and mcherry coding sequence. These light-inducible Dll1 WT and mutant reporter constructs were introduced into NIH3T3 cell lines and integrated into genomic DNA by Tol2 transposon. Puromycinresistant clones were collected by FACS, according to mcherry expression. Established stable cell lines carrying either Dll1 WT reporter or Dll1 type1/type2 mutant reporter were seeded to 24-well dishes in 10%FBS/DMEM, including 1mM luciferin. After 1 min blue light stimulation, the expression of each reporter was measured by photonmultiplier tube (CL24B-LIC/B, Churitsu Electric Corp.) for 5-sec exposures with 3-min intervals. Signals were obtained by counts per second (cps). RT-PCR analysis Dll1 RNA expression in wild-type and Dll1 type 2 mutant mice were examined by RT- PCR. The following primers were used. F1: GGTCAGGGATACACACAGCAAACG; F3: AAAGGCACTTCGGGTCTATGTGAC; R1: CATTCATCGGGGCTATATCCTTGG; R2: AGGCGGCTGATGAGTCTTTCTGGG. 2

3 Supplemental Figures 3
4 Figure S1. Generation and analysis of Dll1-luciferase knock-in (KI) mice, Related to Figures 1 and 2. (A) Strategy for generation of Dll1-luciferase KI mice. (B) In situ hybridization of Uncx4.1 in heterozygous (wt/dl) and homozygous (DL/DL) Dll1-Fluc KI mice at E10.5. (C) In situ hybridization of Uncx4.1 in wild-type (wt/wt), heterozygous (wt/de), and homozygous (DE/DE) Dll1-Eluc KI mice at E10.5. (D) In situ hybridization of Uncx4.1 in heterozygous (wt/dr) and homozygous (DR/DR) Dll1- Rluc KI mice at E10.5. (E) Bone staining of wild-type (wt/wt), heterozygous (wt/dl), and homozygous (DL/DL) Dll1-Fluc KI mice at postnatal day 1 (P1). (F) Bone staining of wild-type (wt/wt), heterozygous (wt/dr), and homozygous (DR/DR) Dll1-Rluc KI mice at P0. (G) Bioluminescence imaging (Luc, Fluc) and immunocytochemistry (ICC) for Dll1 in neural progenitors of Dll1-Fluc KI embryos. BF, bright field. (H) Immunostaining for Dll1 (left) and bioluminescence imaging (right) of the PSM (dorsal view) of a Dll1-Rluc KI embryo at E10.5. (I) Half-lives of wild-type Dll1 and Dll1-Fluc proteins were measured by treatment with cycloheximide (20 µm). Relative protein levels were measured after addition of cycloheximide at time = 0. 4
 Time-lapse imaging of Dll1 protein expression in the PSM of Dll1-Fluc (B) and Dll1-Eluc (K) KI mice at E10.5. The signal intensity is also shown by pseudocolors (lower panels).")
5 Figure S2. Dll1 expression in the presomitic mesoderm, Related to Figure 1. (A,J) Structures of Dll1-Fluc (A) and Dll1-Eluc (J) KI alleles. (B,K) Time-lapse imaging of Dll1 protein expression in the PSM of Dll1-Fluc (B) and Dll1-Eluc (K) KI mice at E10.5. The signal intensity is also shown by pseudocolors (lower panels). (C,L) Bioluminescence images of the PSM in Dll1-Fluc (C) and Dll1-Eluc (L) KI mice. (D,M) Spatiotemporal profiles of Dll1 protein expression obtained from (B,K). (E,N) Quantification of Dll1 protein expression in the PSM. The intensity of Dll1 protein expression was quantified along the red lines in (D and M). (F,O) Temporal differences in the rate of change in Dll1 protein expression in the PSM of Dll1-Fluc (F) and Dll1- Eluc (O) KI mice at E10.5. The signal intensity is also shown by pseudocolors (lower panels). (G,P) Bioluminescence images of temporal differences in the rate of change in Dll1 protein expression in the PSM of Dll1-Fluc (G) and Dll1-Eluc (P) KI mice. (H,Q) Spatiotemporal profiles of temporal differences in the rate of change in Dll1 protein expression obtained from (F,O). (I,R) Quantification of temporal differences in the rate of change in Dll1 protein expression along the red lines in (H,Q). 5
6 Figure S3. Time-lapse imaging analysis of Dll1 expression in neural progenitors, Related to Figure 2. (A,B) Quantification of Dll1 protein expression in neural progenitors obtained from Dll1-Fluc KI mice at E10.5. (C,D) Quantification of Dll1 mrna expression in neural progenitors obtained from pdll1-ub-fluc transgenic mice at E10.5. (E,F) Distribution of periods of Dll1 protein (E) and Dll1 mrna (F) oscillations. 6
 Bioluminescence imaging of neural progenitors transfected with 6-kb Dll1 promoter-driven Dll1-Fluc reporter and pef-mcherry.")
7 Figure S4. Dll1 expression in neural progenitors, Related to Figure 2. (A) Structure of 6-kb Dll1 promoter-driven Dll1-Fluc reporter. (B,C) Bioluminescence imaging of neural progenitors transfected with 6-kb Dll1 promoter-driven Dll1-Fluc reporter and pef-mcherry. (D) Quantification of Dll1 protein expression in neural progenitors in (B,C). 7
8 8
9 Figure S5. Quantification of the delay in Dll1 expression and strategies for generation of Dll1 type 1 and type 2 mutant mice, Related to Figures 3-7. (A) Structures of the hgavpo expression vector and Dll1 type 1 and type 2 mutant and wild-type (WT) reporters. (B) The time course of luciferase activities after blue light illumination. n=4. (C) The initial 90-min time course is magnified. (D,E) Strategies for generation of Dll1 type 1 (D) and type 2 (E) mutant mice. 9
10 Figure S6. Analysis of Dll1 RNA expression from Dll1 type 2 KI mutant mice, Related to Figures 3-7. (A) Genomic structures of Dll1 locus of wild-type (WT) and Dll1 type 2 KI mutant mice (KI). (B) mrna structures expressed from Dll1 locus of wild-type (WT) and Dll1 type 2 KI mutant mice (KI). The positions of the primers are indicated. (C,D) RT-PCR was performed with primers F1 and R1 (C) and F3 and R2 (D). While the 3 UTR sequence was inserted in the first exon of Dll1 locus of Dll1 type 2 KI mutant mice, the downstream region (C, wt; D, mut) was also continuously transcribed at a comparable level to the upstream region (C, mut), suggesting that the inserted 3 UTR did not stop transcription. Furthermore, Dll1 mrna expression levels were comparable between the wild type and Type 2 mutant embryos (see Figure 5A), suggesting that the nonsense-mediated decay did not occur. 10
11 11
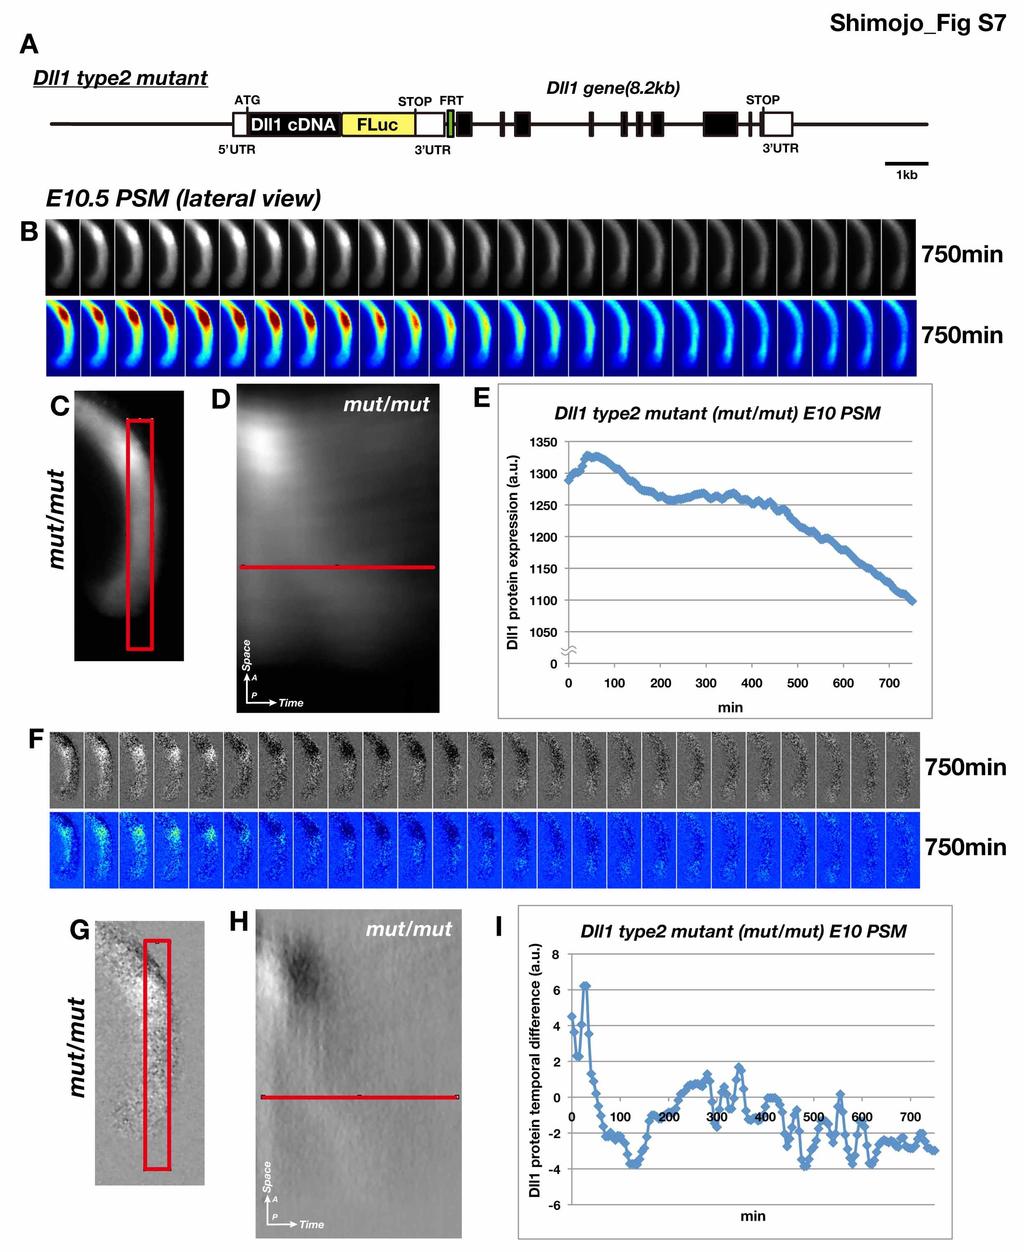
12 Figure S7. Time-lapse imaging analysis of Dll1 expression in the presomitic mesoderm (PSM) of Dll1 type 2 mutant mice, Related to Figure 3. (A) Structure of Dll1 type 2 mutant mouse gene. (B) Time-lapse imaging of Dll1 protein expression in the PSM (lateral view) of a Dll1 type 2 mutant mouse at E10.5. The signal intensity is also shown by pseudocolors (lower panels). (C) Bioluminescence image of the PSM of a Dll1 type 2 mutant mouse. (D) Spatiotemporal profile of Dll1 protein expression obtained from (B). (E) Quantification of Dll1 protein expression in the PSM. The intensity of Dll1 protein expression was quantified along the red line in (D). (F) Temporal differences in the rate of change in Dll1 protein expression in the PSM of a Dll1 type 2 mutant mouse at E10.5. The signal intensity is also shown by pseudocolors (lower panels). (G) Bioluminescence image of temporal differences in the rate of change in Dll1 protein expression in the PSM of a Dll1 type 2 mutant mouse at E10.5. (H) Spatiotemporal profile of temporal differences in the rate of change in Dll1 protein expression obtained from (F). (I) Quantification of temporal differences in the rate of change in Dll1 protein expression along the red line in (H). 12
 Hes1 protein and Dll1 mrna expression in the telencephalon of wild-type (A) and homozygous Dll1 type 1 and type 2 mutant mice (B,C) at E12.5.")
13 Figure S8. Analysis of neural marker expression in Dll1 type 1 and type 2 mutant mice, Related to Figure 7. (A-C) Hes1 protein and Dll1 mrna expression in the telencephalon of wild-type (A) and homozygous Dll1 type 1 and type 2 mutant mice (B,C) at E12.5. (D,E) Quantification of Hes1 protein and Dll1 mrna expression in the ventricular zone shown in (A-C). (F-H) Higher magnification of the telencephalon of wild-type and homozygous Dll1 type 1 and type 2 mutant mice for NICD, Hes1, and Neurog2 protein expression at E12.5. (I-K) Box plots of NICD, Hes1, and Neurog2 protein expression levels at E12.5. *p<0.05, Student t test. Scale bar: (A-C) 50µm. 13
 In situ hybridization of Hes5 in the telencephalon of wildtype (A) and homozygous Dll1 type 2 mutant mice (B) at E12.5. A boxed region in (B) is enlarged in (C).")
14 Figure S9. Size defects of neural development of Dll1 type 1 and type 2 mutant mice, Related to Figure 7. (A-C) In situ hybridization of Hes5 in the telencephalon of wildtype (A) and homozygous Dll1 type 2 mutant mice (B) at E12.5. A boxed region in (B) is enlarged in (C). (D,E) The proportions of the ventricular zone in the cortex of Dll1 type 1 and type 2 mutant mice at E10.5-E14.5. (F) The proportions of Neurod+ regions in the cortex at E12.5. (G) The dorsal views of wild-type, heterozygous and homozygous Dll1 type 1 mutant brains. (H) The relative brain sizes of wild-type, heterozygous and homozygous Dll1 type 1 mutant mice at E17. *p<0.05, **p<0.01, ***p<0.001, Student t test. *p<0.05, Student t test. Scale bars: (A,B) 500µm; (G) 2mm. 14
15 Figure S10. Light-induced Dll1 expression by the hgavpo system, Related to Figure 7. (A) The structures of ppgk-hgavpo and puas-dll1 type1 mutant reporter. (B,C) ppgk-hgavpo and puas-dll1 type1 mutant reporter were co-transfected into NS cells, and Dll1 expression was induced by blue light exposure at 3-hr (B) and 30-min (C) intervals. Dll1 expression was monitored with the luciferase activities. 15
16 16
17 Figure S11. Mathematical modeling for amplitude/oscillation death of coupled oscillators, Related to Figures 3-7. (A) The schematic of the mathematical model. This model consists of two variables x 1 (t) and x 2 (t) (where the unit of time is hour), representing Hes1 levels in two neighboring cells. Here,! 1 is the time required for Hes1 to affect its own formation in the same cell through the negative feedback loop. The interaction between cells is simplified in the following manner. Dll is inhibited by Hes1 in the same cell and activates Hes1 in the other cell. This interaction can be regarded as the mutual inhibition between two cells with delay! 2. (B) The dynamical equations of this model. The interpretations of other parameters is as follows: v is the maximum synthesis rate, r is the degradation rate, K 1 and K 2 correspond to the typical amounts of Hes1 that account for the repression, m and n are the Hill coefficients. In numerical simulations, we set v = 10, r = 2, K 1 = 1, K 2 = 2, m = 2, n = 2,! = 3/4 and observe the dependence of dynamical behavior on! 2. (C) Time series of x 1 and x 2 for different! 2 values. For! 2 = 0.7 and 1.75, in-phase (a) and anti-phase (c) oscillations were observed, respectively. In both cases, when! 2 was decreased by 0.2 h, x 1 and x 2 showed quenching of oscillation (b,d). Time series of x 1 and x 2. (a)! 2 = 0.7. (b)! 2 = 0.5. (c)! 2 = (d)! 2 = (D) Bifurcation diagram. To see! 2 dependence, the maximum and minimum values of x i (i =1, 2) were measured after a transient time. The maximum and minimum values are identical when x i undergoes oscillation quenching, while they are different when x i undergoes self-sustained oscillation. 17
, in-phase and out-of-phase Dll1-Hes oscillations would undergo")
18 Figure S12. Summary of defects observed in Dll1 type 1 and type 2 mutant mice. When! 2, the time required for coupling between cells, is decreased or increased (corresponding to Dll1 type 1 or type 2 mutant, respectively), in-phase and out-of-phase Dll1-Hes oscillations would undergo amplitude/oscillation death. Steady Dll1 expression seems to be non-functional for tissue development, leading to defects similar to those of Dll1 loss-of-function mutations. 18
19 SUPPLEMENTAL MOVIE LEGENDS Movie S1. Dll1 mrna expression in the PSM at E10.5. Movie S2. Dll1 protein expression in the PSM at E10.5. Movie S3. Dll1 mrna expression in the developing nervous system at E10.5. Movie S4. Dll1 mrna expression in cultured neural progenitors at E14.5. Movie S5. Dll1 protein expression in cultured neural progenitors at E12.5. Movie S6. Dll1 protein expression (upper) and its temporal rate changes (lower) in the PSM of heterozygous and homozygous Dll1 type 1 mutant mice at E
TRANSGENIC ANIMALS. -transient transfection of cells -stable transfection of cells. - Two methods to produce transgenic animals:
 TRANSGENIC ANIMALS -transient transfection of cells -stable transfection of cells - Two methods to produce transgenic animals: 1- DNA microinjection - random insertion 2- embryonic stem cell-mediated gene
Nature Biotechnology: doi: /nbt.4166
 Supplementary Figure 1 Validation of correct targeting at targeted locus. (a) by immunofluorescence staining of 2C-HR-CRISPR microinjected embryos cultured to the blastocyst stage. Embryos were stained
Supplementary Figure 1. Homozygous rag2 E450fs mutants are healthy and viable similar to wild-type and heterozygous siblings.
 Supplementary Figure 1 Homozygous rag2 E450fs mutants are healthy and viable similar to wild-type and heterozygous siblings. (left) Representative bright-field images of wild type (wt), heterozygous (het)
Supplementary Information
 Supplementary Information MicroRNA-212/132 family is required for epithelial stromal interactions necessary for mouse mammary gland development Ahmet Ucar, Vida Vafaizadeh, Hubertus Jarry, Jan Fiedler,
The RRPA knock-in allele was generated by homologous recombination in TC1 ES cells.
 Supplemental Materials Materials & Methods Generation of RRPA and RAPA Knock-in Mice The RRPA knock-in allele was generated by homologous recombination in TC1 ES cells. Targeted ES clones in which the
Nature Genetics: doi: /ng Supplementary Figure 1
 Supplementary Figure 1 Ihh interacts preferentially with its upstream neighboring gene Nhej1. Genes are indicated by gray lines, and Ihh and Nhej1 are highlighted in blue. 4C seq performed in E14.5 limbs
- 1 - Supplemental Data
 - 1-1 Supplemental Data 2 3 4 5 6 7 8 9 Supplemental Figure S1. Differential expression of AtPIP Genes in DC3000-inoculated plants. Gene expression in leaves was analyzed by real-time RT-PCR and expression
TRANSGENIC ANIMALS. transient. stable. - Two methods to produce transgenic animals:
 Only for teaching purposes - not for reproduction or sale CELL TRANSFECTION transient stable TRANSGENIC ANIMALS - Two methods to produce transgenic animals: 1- DNA microinjection 2- embryonic stem cell-mediated
Supplementary Information
 Supplementary Information Super-resolution imaging of fluorescently labeled, endogenous RNA Polymerase II in living cells with CRISPR/Cas9-mediated gene editing Won-Ki Cho 1, Namrata Jayanth 1, Susan Mullen
Supplementary Figure 1.
 Supplementary Figure 1. (A) UCSC Genome Browser view of region immediately downstream of the NEUROG3 start codon. All candidate grna target sites which meet the G(N 19 )NGG constraint are aligned to illustrate
Percent survival. Supplementary fig. S3 A.
 Supplementary fig. S3 A. B. 100 Percent survival 80 60 40 20 Ml 0 0 100 C. Fig. S3 Comparison of leukaemia incidence rate in the triple targeted chimaeric mice and germline-transmission translocator mice
(a) Scheme depicting the strategy used to generate the ko and conditional alleles. (b) RT-PCR for
 Scheme depicting the strategy used to generate the ko and conditional alleles. (b) RT-PCR for") Supplementary Figure 1 Generation of Diaph3 ko mice. (a) Scheme depicting the strategy used to generate the ko and conditional alleles. (b) RT-PCR for different regions of Diaph3 mrna from WT, heterozygote
Supplementary Figure 1 Generation of Diaph3 ko mice. (a) Scheme depicting the strategy used to generate the ko and conditional alleles. (b) RT-PCR for different regions of Diaph3 mrna from WT, heterozygote
Schematic representation of the endogenous PALB2 locus and gene-disruption constructs
 Supplementary Figures Supplementary Figure 1. Generation of PALB2 -/- and BRCA2 -/- /PALB2 -/- DT40 cells. (A) Schematic representation of the endogenous PALB2 locus and gene-disruption constructs carrying
Supplemental Data. Cui et al. (2012). Plant Cell /tpc a b c d. Stem UBC32 ACTIN
. Plant Cell /tpc a b c d. Stem UBC32 ACTIN") A Root Stem Leaf Flower Silique Senescence leaf B a b c d UBC32 ACTIN C * Supplemental Figure 1. Expression Pattern and Protein Sequence of UBC32 Homologues in Yeast, Human, and Arabidopsis. (A) Expression
A Root Stem Leaf Flower Silique Senescence leaf B a b c d UBC32 ACTIN C * Supplemental Figure 1. Expression Pattern and Protein Sequence of UBC32 Homologues in Yeast, Human, and Arabidopsis. (A) Expression
SUPPLEMENTARY INFORMATION
 AS-NMD modulates FLM-dependent thermosensory flowering response in Arabidopsis NATURE PLANTS www.nature.com/natureplants 1 Supplementary Figure 1. Genomic sequence of FLM along with the splice sites. Sequencing
UTR Reporter Vectors and Viruses
 UTR Reporter Vectors and Viruses 3 UTR, 5 UTR, Promoter Reporter (Version 1) Applied Biological Materials Inc. #1-3671 Viking Way Richmond, BC V6V 2J5 Canada Notice to Purchaser All abm products are for
Supplementary Figure 1. jmj30-2 and jmj32-1 produce null mutants. (a) Schematic drawing of JMJ30 and JMJ32 genome structure showing regions amplified
 Schematic drawing of JMJ30 and JMJ32 genome structure showing regions amplified") Supplementary Figure 1. jmj30-2 and jmj32-1 produce null mutants. (a) Schematic drawing of JMJ30 and JMJ32 genome structure showing regions amplified by primers used for mrna expression analysis. Gray
Supplementary Figure 1. jmj30-2 and jmj32-1 produce null mutants. (a) Schematic drawing of JMJ30 and JMJ32 genome structure showing regions amplified by primers used for mrna expression analysis. Gray
T H E J O U R N A L O F C E L L B I O L O G Y
 Supplemental material Wang et al., http://www.jcb.org/cgi/content/full/jcb.201405026/dc1 T H E J O U R N A L O F C E L L B I O L O G Y Figure S1. Generation and characterization of unc-40 alleles. (A and
To investigate the heredity of the WFP gene, we selected plants that were homozygous
 Supplementary information Supplementary Note ST-12 WFP allele is semi-dominant To investigate the heredity of the WFP gene, we selected plants that were homozygous for chromosome 1 of Nipponbare and heterozygous
Supplementary Methods
 Supplementary Methods Reverse transcribed Quantitative PCR. Total RNA was isolated from bone marrow derived macrophages using RNeasy Mini Kit (Qiagen), DNase-treated (Promega RQ1), and reverse transcribed
Supplemental Data. Wu and Xue (2010). Plant Cell /tpc
. Plant Cell /tpc") Supplemental Data. Wu and Xue (21). Plant Cell 1.115/tpc.11.75564 A P1-S P1-A P2-S P2-A P3-S P3-A P4-S P4-A B Relative expression Relative expression C 5. 4.5 4. 3.5 3. 2.5 2. 1.5 1..5 5. 4.5 4. 3.5 3.
Supplemental Data. Wu and Xue (21). Plant Cell 1.115/tpc.11.75564 A P1-S P1-A P2-S P2-A P3-S P3-A P4-S P4-A B Relative expression Relative expression C 5. 4.5 4. 3.5 3. 2.5 2. 1.5 1..5 5. 4.5 4. 3.5 3.
To assess the localization of Citrine fusion proteins, we performed antibody staining to
 Trinh et al 1 SUPPLEMENTAL MATERIAL FlipTraps recapitulate endogenous protein localization To assess the localization of Citrine fusion proteins, we performed antibody staining to compare the expression
Cell proliferation was measured with Cell Counting Kit-8 (Dojindo Laboratories, Kumamoto, Japan).
.") 1 2 3 4 5 6 7 8 Supplemental Materials and Methods Cell proliferation assay Cell proliferation was measured with Cell Counting Kit-8 (Dojindo Laboratories, Kumamoto, Japan). GCs were plated at 96-well
1 2 3 4 5 6 7 8 Supplemental Materials and Methods Cell proliferation assay Cell proliferation was measured with Cell Counting Kit-8 (Dojindo Laboratories, Kumamoto, Japan). GCs were plated at 96-well
Revised: RG-RV2 by Fukuhara et al.
 Supplemental Figure 1 The generation of Spns2 conditional knockout mice. (A) Schematic representation of the wild type Spns2 locus (Spns2 + ), the targeted allele, the floxed allele (Spns2 f ) and the
Table S1. Primers used in the study
 Table S1. Primers used in the study Primer name Application Sequence I1F16 Genotyping GGCAAGTGAGTGAGTGCCTA I1R11 Genotyping CCCACTCGTATTGACGCTCT V19 Genotyping GGGTCTCAAAGTCAGGGTCA D18Mit184-F Genotyping
Summary MicroRNAs (mirnas) are genomically encoded small RNAs used by organisms to regulate the expression of proteins generated from messenger RNA
 are genomically encoded small RNAs used by organisms to regulate the expression of proteins generated from messenger RNA") Summary MicroRNAs (mirnas) are genomically encoded small RNAs used by organisms to regulate the expression of proteins generated from messenger RNA transcripts. The in vivo requirement of specific mirnas
Summary MicroRNAs (mirnas) are genomically encoded small RNAs used by organisms to regulate the expression of proteins generated from messenger RNA transcripts. The in vivo requirement of specific mirnas
Supplementary Table, Figures and Videos
 Supplementary Table, Figures and Videos Table S1. Oligonucleotides used for different approaches. (A) RT-qPCR study. (B) qpcr study after ChIP assay. (C) Probes used for EMSA. Figure S1. Notch activation
embryos. Asterisk represents loss of or reduced expression. Brackets represent
 Supplemental Figures Supplemental Figure 1. tfec expression is highly enriched in tail endothelial cells (A- B) ISH of tfec at 15 and 16hpf in WT embryos. (C- D) ISH of tfec at 36 and 38hpf in WT embryos.
Hyper sensitive protein detection by Tandem-HTRF reveals Cyclin D1
 Hyper sensitive protein detection by Tandem-HTRF reveals Cyclin D1 dynamics in adult mouse Alexandre Zampieri, Julien Champagne, Baptiste Auzemery, Ivanna Fuentes, Benjamin Maurel and Frédéric Bienvenu
A Survey of Genetic Methods
 IBS 8102 Cell, Molecular, and Developmental Biology A Survey of Genetic Methods January 24, 2008 DNA RNA Hybridization ** * radioactive probe reverse transcriptase polymerase chain reaction RT PCR DNA
SUPPLEMENTARY INFORMATION SUPPLEMENTARY FIGURES
 SUPPLEMENTARY INFORMATION SUPPLEMENTARY FIGURES Supplementary Figure 1. Generation of inducible BICD2 knock-out mice. A) The mouse BICD2 locus and gene targeting constructs. To generate an inducible Bicd2
Sperm cells are passive cargo of the pollen tube in plant fertilization
 In the format provided by the authors and unedited. SUPPLEMENTARY INFORMATION VOLUME: 3 ARTICLE NUMBER: 17079 Sperm cells are passive cargo of the pollen tube in plant fertilization Jun Zhang 1, Qingpei
A CRISPR/Cas9 Vector System for Tissue-Specific Gene Disruption in Zebrafish
 Developmental Cell Supplemental Information A CRISPR/Cas9 Vector System for Tissue-Specific Gene Disruption in Zebrafish Julien Ablain, Ellen M. Durand, Song Yang, Yi Zhou, and Leonard I. Zon % larvae
7.012 Problem Set 5. Question 1
 Name Section 7.012 Problem Set 5 Question 1 While studying the problem of infertility, you attempt to isolate a hypothetical rabbit gene that accounts for the prolific reproduction of rabbits. After much
BS 50 Genetics and Genomics Week of Oct 24
 BS 50 Genetics and Genomics Week of Oct 24 Additional Practice Problems for Section Question 1: The following table contains a list of statements that apply to replication, transcription, both, or neither.
SUPPLEMENTARY INFORMATION
 Ca 2+ /calmodulin Regulates Salicylic Acid-mediated Plant Immunity Liqun Du, Gul S. Ali, Kayla A. Simons, Jingguo Hou, Tianbao Yang, A.S.N. Reddy and B. W. Poovaiah * *To whom correspondence should be
Supplemental Figure 1. Immunoblot analysis of wild-type and mutant forms of JAZ3
 Supplemental Data. Chung and Howe (2009). A Critical Role for the TIFY Motif in Repression of Jasmonate Signaling by a Stabilized Splice Variant of the JASMONATE ZIM-domain protein JAZ10 in Arabidopsis.
Easi CRISPR for conditional and insertional alleles
 Easi CRISPR for conditional and insertional alleles C.B Gurumurthy, University Of Nebraska Medical Center Omaha, NE cgurumurthy@unmc.edu Types of Genome edits Gene disruption/inactivation Types of Genome
DRG Pituitary Cerebral Cortex
 Liver Spinal cord Pons Atg5 -/- Atg5 +/+ DRG Pituitary Cerebral Cortex WT KO Supplementary Figure S1 Ubiquitin-positive IBs accumulate in Atg5 -/- tissues. Atg5 -/- neonatal tissues were fixed and decalcified.
Supplemental Data. Na Xu et al. (2016). Plant Cell /tpc
. Plant Cell /tpc") Supplemental Figure 1. The weak fluorescence phenotype is not caused by the mutation in At3g60240. (A) A mutation mapped to the gene At3g60240. Map-based cloning strategy was used to map the mutated site
Supplemental Figure 1. The weak fluorescence phenotype is not caused by the mutation in At3g60240. (A) A mutation mapped to the gene At3g60240. Map-based cloning strategy was used to map the mutated site
Supplemental Data. Borg et al. Plant Cell (2014) /tpc
 /tpc") Supplementary Figure 1 - Alignment of selected angiosperm DAZ1 and DAZ2 homologs Multiple sequence alignment of selected DAZ1 and DAZ2 homologs. A consensus sequence built using default parameters is shown
Supplementary Figure 1 - Alignment of selected angiosperm DAZ1 and DAZ2 homologs Multiple sequence alignment of selected DAZ1 and DAZ2 homologs. A consensus sequence built using default parameters is shown
Experimental Tools and Resources Available in Arabidopsis. Manish Raizada, University of Guelph, Canada
 Experimental Tools and Resources Available in Arabidopsis Manish Raizada, University of Guelph, Canada Community website: The Arabidopsis Information Resource (TAIR) at http://www.arabidopsis.org Can order
Figure S1. Figure S2. Figure S3 HB Anti-FSP27 (COOH-terminal peptide) Ab. Anti-GST-FSP27(45-127) Ab.
 Ab. Anti-GST-FSP27(45-127) Ab.") / 36B4 mrna ratio Figure S1 * 2. 1.6 1.2.8 *.4 control TNFα BRL49653 Figure S2 Su bw AT p iw Anti- (COOH-terminal peptide) Ab Blot : Anti-GST-(45-127) Ab β-actin Figure S3 HB2 HW AT BA T Figure S4 A TAG
/ 36B4 mrna ratio Figure S1 * 2. 1.6 1.2.8 *.4 control TNFα BRL49653 Figure S2 Su bw AT p iw Anti- (COOH-terminal peptide) Ab Blot : Anti-GST-(45-127) Ab β-actin Figure S3 HB2 HW AT BA T Figure S4 A TAG
Genetics - Problem Drill 19: Dissection of Gene Function: Mutational Analysis of Model Organisms
 Genetics - Problem Drill 19: Dissection of Gene Function: Mutational Analysis of Model Organisms No. 1 of 10 1. The mouse gene knockout is based on. (A) Homologous recombination (B) Site-specific recombination
Supplementary Figure 1. Nature Structural & Molecular Biology: doi: /nsmb.3494
 Supplementary Figure 1 Pol structure-function analysis (a) Inactivating polymerase and helicase mutations do not alter the stability of Pol. Flag epitopes were introduced using CRISPR/Cas9 gene targeting
Supplemental Data. Benstein et al. (2013). Plant Cell /tpc
. Plant Cell /tpc") Supplemental Figure 1. Purification of the heterologously expressed PGDH1, PGDH2 and PGDH3 enzymes by Ni-NTA affinity chromatography. Protein extracts (2 µl) of different fractions (lane 1 = total extract,
Supplemental Figure 1. Purification of the heterologously expressed PGDH1, PGDH2 and PGDH3 enzymes by Ni-NTA affinity chromatography. Protein extracts (2 µl) of different fractions (lane 1 = total extract,
SUPPLEMENTAL MATERIAL
 SUPPLEMENTAL MATERIAL MATERIALS AND METHODS Generation of TSPOΔ/Δ murine embryonic fibroblasts Embryos were harvested from 13.5-day pregnant TSPOfl/fl mice. After dissection to eviscerate and remove the
Generation of App knock-in mice reveals deletion mutations protective against Alzheimer s. disease-like pathology. Nagata et al.
 Generation of App knock-in mice reveals deletion mutations protective against Alzheimer s disease-like pathology Nagata et al. Supplementary Fig 1. Previous App knock-in model did not show Aβ accumulation
Experimental genetics - 2 Partha Roy
 Partha Roy Experimental genetics - 2 Making genetically altered animal 1) Gene knock-out k from: a) the entire animal b) selected cell-type/ tissue c) selected cell-type/tissue at certain time 2) Transgenic
 Figure S1. Generation of HspA4 -/- mice. (A) Structures of the wild-type (Wt) HspA4 -/- allele, targeting vector and targeted allele are shown together with the relevant restriction sites. The filled rectangles
Supplementary Table 1. Sequences for BTG2 and BRCA1 sirnas.
 Supplementary Table 1. Sequences for BTG2 and BRCA1 sirnas. Target Gene Non-target / Control BTG2 BRCA1 NFE2L2 Target Sequence ON-TARGET plus Non-targeting sirna # 1 (Cat# D-001810-01-05) sirna1: GAACCGACAUGCUCCCGGA
To generate the luciferase fusion to the human 3 UTRs, we sub-cloned the 3 UTR
 Plasmids To generate the luciferase fusion to the human 3 UTRs, we sub-cloned the 3 UTR fragments downstream of firefly luciferase (luc) in pgl3 control (Promega). pgl3- CDK6 was made by amplifying a 2,886
Supplemental data. Zhao et al. (2009). The Wuschel-related homeobox gene WOX11 is required to activate shoot-borne crown root development in rice.
. The Wuschel-related homeobox gene WOX11 is required to activate shoot-borne crown root development in rice.") Supplemental data. Zhao et al. (2009). The Wuschel-related homeobox gene WOX11 is required to activate shoot-borne crown root development in rice. A B Supplemental Figure 1. Expression of WOX11p-GUS WOX11-GFP
Supplemental data. Zhao et al. (2009). The Wuschel-related homeobox gene WOX11 is required to activate shoot-borne crown root development in rice. A B Supplemental Figure 1. Expression of WOX11p-GUS WOX11-GFP
LRBA is Essential for Allogeneic Responses in Bone Marrow Transplantation
 LRBA is Essential for Allogeneic Responses in Bone Marrow Transplantation Mi Young Park, 1# Raki Sudan, 1# Neetu Srivastava, 1 Sudha Neelam, 1 Christie Youngs, 1 Jia- Wang Wang, 4 Robert W. Engelman, 5,6,7
Pei et al. Supplementary Figure S1
 Pei et al. Supplementary Figure S1 C H-CUL9: + + + + + Myc-ROC1: - - + + + U2OS/pcDN3 U2OS/H-CUL9 U2OS/ + H-CUL9 IP: -H -myc input -H -myc 1 2 3 4 5 H-CUL9 Myc-ROC1 -H -H -H -H H-CUL9: wt RR myc-roc1:
Supplemental Figure 1
 Supplemental Figure 1 Supplemental figure 1. Generation of gene targeted mice expressing an anti-id BCR. (A,B) Generation of the VDJ aid H KI mouse. (A) Targeting Construct. Top: Targeting construct for
Supplemental Figure 1 HDA18 has an HDAC domain and therefore has concentration dependent and TSA inhibited histone deacetylase activity.
 Supplemental Figure 1 HDA18 has an HDAC domain and therefore has concentration dependent and TSA inhibited histone deacetylase activity. (A) Amino acid alignment of HDA5, HDA15 and HDA18. The blue line
Supplementary Figure 1 PARP1 is involved in regulating the stability of mrnas from pro-inflammatory cytokine/chemokine mediators.
 Supplementary Figure 1 PARP1 is involved in regulating the stability of mrnas from pro-inflammatory cytokine/chemokine mediators. (a) A graphic depiction of the approach to determining the stability of
Supplementary Figure 1 Activities of ABEs using extended sgrnas in HEK293T cells.
 Supplementary Figure 1 Activities of ABEs using extended sgrnas in HEK293T cells. Base editing efficiencies of ABEs with extended sgrnas at Site 18 (a), Site 19 (b), the HBB-E2 site (c), and the HBB-E3
Peter Dy, Weihuan Wang, Pallavi Bhattaram, Qiuqing Wang, Lai Wang, R. Tracy Ballock, and Véronique Lefebvre
 Developmental Cell, Volume 22 Supplemental Information Sox9 Directs Hypertrophic Maturation and Blocks Osteoblast Differentiation of Growth Plate Chondrocytes Peter Dy, Weihuan Wang, Pallavi Bhattaram,
Fig. S1. Effect of p120-catenin overexpression on the interaction of SCUBE2 with E-cadherin. The expression plasmid encoding FLAG.
 Fig. S1. Effect of p120-catenin overexpression on the interaction of SCUBE2 with E-cadherin. The expression plasmid encoding FLAG.SCUBE2, E-cadherin.Myc, or HA.p120-catenin was transfected in a combination
Supplementary Fig. 1
 a FL (1-2266) NL (1-1190) CL (1191-2266) HA-ICE1: - HA-ICE1: - - - FLAG-ICE2: + + + + FLAG-ELL: + + + + + + IP: anti-ha FLAG-ICE2 HA-ICE1-FL HA-ICE1-NL HA-ICE1-CL FLAG-ICE2 b IP: anti-ha FL (1-2266) NL
Supplementary Figure S1: (A) Schematic representation of the Jarid2 Flox/Flox
 Schematic representation of the Jarid2 Flox/Flox") Supplementary Figure S1: (A) Schematic representation of the Flox/Flox locus and the strategy used to visualize the wt and the Flox/Flox mrna by PCR from cdna. An example of the genotyping strategy is
Supplementary Figure S1: (A) Schematic representation of the Flox/Flox locus and the strategy used to visualize the wt and the Flox/Flox mrna by PCR from cdna. An example of the genotyping strategy is
Fatchiyah
 Fatchiyah Email: fatchiya@yahoo.co.id RNAs: mrna trna rrna RNAi DNAs: Protein: genome DNA cdna mikro-makro mono-poly single-multi Analysis: Identification human and animal disease Finger printing Sexing
Nature Methods: doi: /nmeth Supplementary Figure 1. Schematics of SAM, dcas9-suntag and dcas9-vpr.
 Supplementary Figure 1 Schematics of SAM, dcas9-suntag and dcas9-vpr. (a) Schematics of SAM. SAM consists of two chimeric proteins, dcas9 fused with VP64 and MS2-coat protein fused with p65 and HSF1 activator
Supplementary Figure S1. N-terminal fragments of LRRK1 bind to Grb2.
 Myc- HA-Grb2 Mr(K) 105 IP HA 75 25 105 1-1163 1-595 - + - + - + 1164-1989 Blot Myc HA total lysate 75 25 Myc HA Supplementary Figure S1. N-terminal fragments of bind to Grb2. COS7 cells were cotransfected
transcription and the promoter occupancy of Smad proteins. (A) HepG2 cells were co-transfected with the wwp-luc reporter, and FLAG-tagged FHL1,
 HepG2 cells were co-transfected with the wwp-luc reporter, and FLAG-tagged FHL1,") Supplementary Data Supplementary Figure Legends Supplementary Figure 1 FHL-mediated TGFβ-responsive reporter transcription and the promoter occupancy of Smad proteins. (A) HepG2 cells were co-transfected
Supplementary Data Supplementary Figure Legends Supplementary Figure 1 FHL-mediated TGFβ-responsive reporter transcription and the promoter occupancy of Smad proteins. (A) HepG2 cells were co-transfected
Two classes of silencing RNAs move between Caenorhabditis elegans tissues.
 Two classes of silencing RNAs move between Caenorhabditis elegans tissues. Antony M Jose, Giancarlo A Garcia, and Craig P Hunter. Supplementary Figures, Figure Legends, and Tables. Supplementary Figure
8Br-cAMP was purchased from Sigma (St. Louis, MO). Silencer Negative Control sirna #1 and
. Silencer Negative Control sirna #1 and") 1 Supplemental information 2 3 Materials and Methods 4 Reagents and animals 5 8Br-cAMP was purchased from Sigma (St. Louis, MO). Silencer Negative Control sirna #1 and 6 Silencer Select Pre-designed sirna
1 Supplemental information 2 3 Materials and Methods 4 Reagents and animals 5 8Br-cAMP was purchased from Sigma (St. Louis, MO). Silencer Negative Control sirna #1 and 6 Silencer Select Pre-designed sirna
Map-Based Cloning of Qualitative Plant Genes
 Map-Based Cloning of Qualitative Plant Genes Map-based cloning using the genetic relationship between a gene and a marker as the basis for beginning a search for a gene Chromosome walking moving toward
1. Primers for PCR to amplify hairpin stem-loop precursor mir-145 plus different flanking sequence from human genomic DNA.
 Supplemental data: 1. Primers for PCR to amplify hairpin stem-loop precursor mir-145 plus different flanking sequence from human genomic DNA. Strategy#1: 20nt at both sides: #1_BglII-Fd primer : 5 -gga
Growth factor, augmenter of liver regeneration
 Supplemental Table 1: Human and mouse PC1 sequence equivalencies Human Mouse Domain Clinical significance; Score* PolyPhen prediction; PSIC score difference C210G C210G WSC Highly likely pathogenic; 15
SUPPLEMENTARY INFORMATION
 doi:10.1038/nature10810 Supplementary Fig. 1: Mutation of the loqs gene leads to shortened lifespan and adult-onset brain degeneration. a. Northern blot of control and loqs f00791 mutant flies. loqs f00791
Table 1. Primers, annealing temperatures, and product sizes for PCR amplification.
 Table 1. Primers, annealing temperatures, and product sizes for PCR amplification. Gene Direction Primer sequence (5 3 ) Annealing Temperature Size (bp) BRCA1 Forward TTGCGGGAGGAAAATGGGTAGTTA 50 o C 292
Nature Immunology: doi: /ni.3694
 Supplementary Figure 1 Expression of Bhlhe41 and Bhlhe40 in B cell development and mature B cell subsets. (a) Scatter plot showing differential expression of genes between splenic B-1a cells and follicular
Test Bank for Molecular Cell Biology 7th Edition by Lodish
 Test Bank for Molecular Cell Biology 7th Edition by Lodish Link download full: http://testbankair.com/download/test-bank-formolecular-cell-biology-7th-edition-by-lodish/ Chapter 5 Molecular Genetic Techniques
Human Molecular Genetics Assignment 3 (Week 3)
") Human Molecular Genetics Assignment 3 (Week 3) Q1. Which one of the following is an effect of a genetic mutation? a. Prevent the synthesis of a normal protein. b. Alters the function of the resulting protein
Human Molecular Genetics Assignment 3 (Week 3) Q1. Which one of the following is an effect of a genetic mutation? a. Prevent the synthesis of a normal protein. b. Alters the function of the resulting protein
Supplementary Figure Legends
 Supplementary Figure Legends Figure S1 gene targeting strategy for disruption of chicken gene, related to Figure 1 (f)-(i). (a) The locus and the targeting constructs showing HpaI restriction sites. The
File name: Supplementary Information Description: Supplementary figures and supplementary tables. File name: Peer review file Description:
 File name: Supplementary Information Description: Supplementary figures and supplementary tables. File name: Peer review file Description: Supplementary Figure 1. dcas9-mq1 fusion protein induces de novo
Enzyme that uses RNA as a template to synthesize a complementary DNA
 Biology 105: Introduction to Genetics PRACTICE FINAL EXAM 2006 Part I: Definitions Homology: Comparison of two or more protein or DNA sequence to ascertain similarities in sequences. If two genes have
Supplementary Figure 1 An overview of pirna biogenesis during fetal mouse reprogramming. (a) (b)
 (b)") Supplementary Figure 1 An overview of pirna biogenesis during fetal mouse reprogramming. (a) A schematic overview of the production and amplification of a single pirna from a transposon transcript. The
Supplementary Figure 1 An overview of pirna biogenesis during fetal mouse reprogramming. (a) A schematic overview of the production and amplification of a single pirna from a transposon transcript. The
- PDI5. - Actin A 300-UTR5. PDI5 lines WT. Arabidopsis Chromosome 1. PDI5 (At1g21750) SALK_ SALK_ SALK_015253
 SALK_ SALK_ SALK_015253") Supplemental Data. Ondzighi et al. (2008). Arabidopsis Protein Disulfide Isomerase-5 Inhibits ysteine Proteases During Trafficking to Vacuoles Prior to Programmed ell Death of the dothelium in Developing
Supplemental Data. Ondzighi et al. (2008). Arabidopsis Protein Disulfide Isomerase-5 Inhibits ysteine Proteases During Trafficking to Vacuoles Prior to Programmed ell Death of the dothelium in Developing
Chapter 20 Recombinant DNA Technology. Copyright 2009 Pearson Education, Inc.
 Chapter 20 Recombinant DNA Technology Copyright 2009 Pearson Education, Inc. 20.1 Recombinant DNA Technology Began with Two Key Tools: Restriction Enzymes and DNA Cloning Vectors Recombinant DNA refers
Figure S1. Verification of ihog Mutation by Protein Immunoblotting Figure S2. Verification of ihog and boi
 Figure S1. Verification of ihog Mutation by Protein Immunoblotting Extracts from S2R+ cells, embryos, and adults were analyzed by immunoprecipitation and immunoblotting with anti-ihog antibody. The Ihog
Supplemental Data. Farmer et al. (2010) Plant Cell /tpc
 Plant Cell /tpc") Supplemental Figure 1. Amino acid sequence comparison of RAD23 proteins. Identical and similar residues are shown in the black and gray boxes, respectively. Dots denote gaps. The sequence of plant Ub is
Supplemental Figure 1. Amino acid sequence comparison of RAD23 proteins. Identical and similar residues are shown in the black and gray boxes, respectively. Dots denote gaps. The sequence of plant Ub is
Supplemental Data. Seo et al. (2014). Plant Cell /tpc
. Plant Cell /tpc") Supplemental Figure 1. Protein alignment of ABD1 from other model organisms. The alignment was performed with H. sapiens DCAF8, M. musculus DCAF8 and O. sativa Os10g0544500. The WD40 domains are underlined.
Supplemental Figure 1. Protein alignment of ABD1 from other model organisms. The alignment was performed with H. sapiens DCAF8, M. musculus DCAF8 and O. sativa Os10g0544500. The WD40 domains are underlined.
Supplemental Figure 1 (Figure S1), related to Figure 1 Figure S1 provides evidence to demonstrate Nfatc1Cre is a mouse line that directed gene
, related to Figure 1 Figure S1 provides evidence to demonstrate Nfatc1Cre is a mouse line that directed gene") Developmental Cell, Volume 25 Supplemental Information Brg1 Governs a Positive Feedback Circuit in the Hair Follicle for Tissue Regeneration and Repair Yiqin Xiong, Wei Li, Ching Shang, Richard M. Chen,
Developmental Cell, Volume 25 Supplemental Information Brg1 Governs a Positive Feedback Circuit in the Hair Follicle for Tissue Regeneration and Repair Yiqin Xiong, Wei Li, Ching Shang, Richard M. Chen,
Supplementary Fig. 1 Proteomic analysis of ATR-interacting proteins. ATR, ARID1A and
 Supplementary Figure Legend: Supplementary Fig. 1 Proteomic analysis of ATR-interacting proteins. ATR, ARID1A and ATRIP protein peptides identified from our mass spectrum analysis were shown. Supplementary
SUPPLEMENTARY INFORMATION
 doi:10.1038/nature11094 Supplementary Figures Supplementary Figure 1: Analysis of GFP expression in P0 wild type and mutant ( E1-4) Fezf2-Gfp BAC transgenic mice. Epifluorescent images of sagittal forebrain
Nature Biotechnology: doi: /nbt Supplementary Figure 1. Design and sequence of system 1 for targeted demethylation.
 Supplementary Figure 1 Design and sequence of system 1 for targeted demethylation. (a) Design of system 1 for targeted demethylation. TET1CD was fused to a catalytic inactive Cas9 nuclease (dcas9) and
Fig. S1. Molecular phylogenetic analysis of AtHD-ZIP IV family. A phylogenetic tree was constructed using Bayesian analysis with Markov Chain Monte
 Fig. S1. Molecular phylogenetic analysis of AtHD-ZIP IV family. A phylogenetic tree was constructed using Bayesian analysis with Markov Chain Monte Carlo algorithm for one million generations to obtain
A Nucleus-Encoded Chloroplast Protein YL1 Is Involved in Chloroplast. Development and Efficient Biogenesis of Chloroplast ATP Synthase in Rice
 A Nucleus-Encoded Chloroplast Protein YL1 Is Involved in Chloroplast Development and Efficient Biogenesis of Chloroplast ATP Synthase in Rice Fei Chen 1,*, Guojun Dong 2,*, Limin Wu 1, Fang Wang 3, Xingzheng
Supplementary Table 1. Primers used to construct full-length or various truncated mutants of ISG12b2.
 Supplementary Table 1. Primers used to construct full-length or various truncated mutants of ISG12b2. Construct name ISG12b2 (No tag) HA-ISG12b2 (N-HA) ISG12b2-HA (C-HA; FL-HA) 94-283-HA (FL-GFP) 93-GFP
SUPPLEMENTARY INFORMATION
 6 Relative levels of ma3 RNA 5 4 3 2 1 LN MG SG PG Spl Thy ma3 ß actin Lymph node Mammary gland Prostate gland Salivary gland Spleen Thymus MMTV target tissues Fig. S1: MMTV target tissues express ma3.
Integrated Omics Study Delineates the Dynamics of Lipid Droplets in Rhodococcus Opacus PD630
 School of Natural Sciences and Mathematics 2013-10-22 Integrated Omics Study Delineates the Dynamics of Lipid Droplets in Rhodococcus Opacus PD630 UTD AUTHOR(S): Michael Qiwei Zhang 2013 The Authors This
Supplemental Table S1. RT-PCR primers used in this study
 Supplemental Table S1. RT-PCR primers used in this study -----------------------------------------------------------------------------------------------------------------------------------------------
Supplementary Figure 1
 Supplementary Figure 1 Supplementary Figure 1. Activation capacity of tettale-ad compared to tet trans-activator (ttas) using different teto variants. (A) HeLa cells were co-transfected with activation
MeCP2. MeCP2/α-tubulin. GFP mir1-1 mir132
 Conservation Figure S1. Schematic showing 3 UTR (top; thick black line), mir132 MRE (arrow) and nucleotide sequence conservation (vertical black lines; http://genome.ucsc.edu). a GFP mir1-1 mir132 b GFP
Supplementary Figures and Figure legends
 Supplementary Figures and Figure legends 3 Supplementary Figure 1. Conditional targeting construct for the murine Satb1 locus with a modified FLEX switch. Schematic of the wild type Satb1 locus; the conditional
Biology 4361 Developmental Biology Lecture 4. The Genetic Core of Development
 Biology 4361 Developmental Biology Lecture 4. The Genetic Core of Development The only way to get from genotype to phenotype is through developmental processes. - Remember the analogy that the zygote contains