Introduction to ChIP Seq data analyses. Acknowledgement: slides taken from Dr. H
|
|
|
- Ashley Walsh
- 6 years ago
- Views:
Transcription
1 Introduction to ChIP Seq data analyses Acknowledgement: slides taken from Dr. H
2 ChIP seq: Chromatin ImmunoPrecipitation it ti + sequencing Same biological motivation as ChIP chip: measure specific biological modifications along the genome: Detect binding sites of DNA binding proteins (transcription factors, pol2, etc.). quantify strengths of chromatin modifications q y g (e.g., histone modifications).
3 Experimental procedures SameasChIP chip as except the laststep: step: sequencing is used to replace microarray. Crosslink: fix proteins on Isolate genomic DNA. Sonication: cut DNA in small pieces of ~200bp. IP: use antibody to capture DNA segments with specific proteins. Reverse crosslink: remove protein from DNA. Sequence the DNA segments.
4 Hongkai Ji, Hopkins Biostat
5 Advantages of ChIP seq over ChIP chip Not limited by arraydesign design, especially useful for species without commercially available arrays. Higher spatialresolution. Better signal to noise ratio and dynamic ranges. Less starting materials.
6 ChIP seq data analyses Alignment Peak Detection Annotation Visualization Sequence Analysis Motif Analysis Hongkai Ji, Hopkins Biostat
7 ChIP seq peak detection Peaks: protein binding or histone modification sites. Data from ChIP seq: raw data: sequence reads. After alignments: genome coordinates (chromosome/position) of the start of each read. Usually, aligned reads are summarized into counts of equal sized bins genome wide: 1. segment genome into small bins of equal sizes (50bps). 2. Count number of reads started at each bin. The bin counts are inputs for many peak calling algorithms. Similar to probe signals in ChIP chip. Difference: discrete (seq) vs. continuous (microarray) data.
8 Normalization issues The most common normalization needed is to adjust for total counts. Divided by total counts is conservative, because ChIP sample contains reads mapped to background and peaks, but control sample have reads mapped to background only. Should normalize using the number of total reads in backgrounds. Two pass algorithm: Roughly find peaks, and exclude those regions. Computetotal total reads in theleftover regions andnormalizenormalize based on that. Other normalizations (GC contents, MA plot based) available, but don t seems to help much.
9 Before peak detection: what do we know about ChIP seq? SonicatedDNA sequences are selected so that the resulting sequence fragments are approximately 200bp. In the immunoprecipitated (IP) sample, more sequence reads should be presented around the TF binding sites. However, other artifacts need to be considered. DNA sequence: can affect amplification process or sequencing process Chromatin structure (e.g., open chromatin region or not): may affect the DNA sonication process. A control sample is necessary to correct artifacts.
10 Control sample is important
11 Reads aligned to different strands Number of Reads aligned to different strands form two distinct i peaks around the true binding sites. This information can be used to help peak detection. Valouev et al. (2008) Nature Method
12 Mappability For each basepair position in the genome, whether a 35 bp (or other length now) sequence tag starting from this position can be uniquely mapped to a genome location. Regions withlowmappability (highly repetitive) cannot have high counts, thus affect the ability to detect peaks.
13 Peak detection software MACS Cisgenome QuEST Hpeak PICS PeakSeq MOSAiCS
14 Peak detection methods Counts fromneighboring windows need to be combined to make inference. To combine counts: Smoothing based: moving average (MACS, Cisgeenome), HMM (Hpeak). Model clustering of reads starting position (PICS). Other consideration: mappability of the genome (PeakSeq, MOSAiCS).
15 MACS (Model based Analysis of ChIP Seq) Zhang et al. 2008, GB Estimate shift size of reads d from the distance of two modes from + and strands. Shift all reads toward 3 end by d/2. Use a dynamic Possion model to scan genome and score peaks. Counts in a window are assumed to following Poisson distribution with rate: local = max( BG, [ 1k,] 5k, 10k) The dynamic rate capture the local fluctuation of counts. FDR estimates from sample swapping: flip the IP and control samples and call peaks. Number of peaks detected under each p value cutoff will be used as null and used to compute FDR.
16 Cisgenome (Ji et al. 2008, NBT) ) Implemented with Windows GUI. Use a Binomial model to score peaks. k 1i k 2i n i =k 1i + k 2i k 1i n i ~ Binom(n i, p 0 )
17 FLJ20699 Consider mappability: PeakSeq Rozowsky et al. (2009) NBT First round analysis: detect possible peak regions by identifying threshold considering mappability: Cut genome into segment (L=1Mb). Within each segment, the same number of reads are permuted in a region of f Length, where f is the proportion of mappable bases in the segment. 1. Constructing signal maps Tags Extend mapped tags to DNA fr agment Map of number of DNA fragments at each nucleotide position Signal map 2. First pass: determining potential binding regions b y comparison to simulation f Length Length Simulate each segment Determine a threshold satisfying the desired initial false discovery rate Use the threshold to identify potential target sites Simulation Simulated target sites Threshold Potential target sites Threshold Mappability map GTSE1 TRMU GRAMD4 TBC1D22A f CELSR1 CERK
18 Second round analysis: Normalize data by counts in background regions. Test significance of the peaks identified in first round by comparing the total count in peak region with control data, using binomial p value, with Benjamini Hochberg correction. ChIP-seq sam mple 3. Normalizing control to ChIP-seq sample P f = Slope = Correlation = P f = Slope = Correlation = Input DNA Input DNA 4. Second pass: scoring enriched target regions relativ e to control For potential binding sites calculate the f old enrichment Compute a P-value from the binomial distribution Correct for multiple hypothesis testing and deter mine enriched target sites ChIP-seq sam mple Select fraction of potential peaks to e xclude (parameter P f ) Count tags in bins along chromosome f or ChIP-seq sample and control Determine slope of least squares linear reg ression Potential target sites ChIP-seq sample Normalized input DNA Enriched target sites
19 Bioconductor packages for ChIP seq There are some packages: chipseq, ChIPseqR, BayesPeak, PICS, etc., but not very popular. Most people p use command line driven software like MACS or CisGenome GUI.
20 Comparing ChIP seq and ChIP chip: Ji et al. (2008) Nature Biotechnology NRSF ChIP chip: hi 2 ChIP + 2 Mock IP in Jurkat cells, profiled using Affymetrix Human Tiling 2.0R arrays. NRSF ChIP seq: ChIP + Negative Control in Jurkat cells, sequenced with the next generation sequencer made by Illumina/Solexa.
21 Overlaps in peaks Before post processing After post processing
22 Correlation in signals


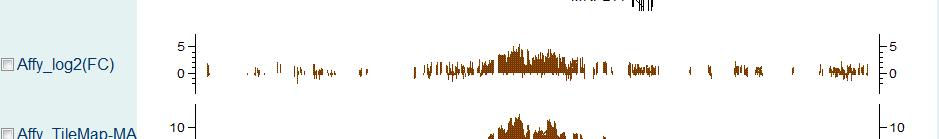
23 ChIP seq provide better signals
24 Review ChIP seq is used to detect interesting regions in the genome, same as tiling arrays. The enriched DNA segments is sequenced directly, instead of relying li on hbidi hybridization in tiling arrays. Number of aligned reads are input data. More reads in a region indicate stronger signals (for TF binding, etc.). Single dataset peak detection is similar to that in ChIP chip. Data in neighboring regions need to be combined. Joint analysis from multiple datasets if of great interests.
Introduction to ChIP- Seq data analyses
 Introduction to ChIP- Seq data analyses Outline Introduction to ChIP- seq experiment. Biological motivation. Experimental procedure. Method and software for ChIP- seq peak calling. Protein binding ChIP-
Introduc)on to ChIP- Seq data analyses
on to ChIP- Seq data analyses") Introduc)on to ChIP- Seq data analyses 7 th BBBC, February 2014 Outline Introduc8on to ChIP- seq experiment: Biological mo8va8on. Experimental procedure. Method and sohware for ChIP- seq peak calling:
Introduc)on to ChIP- Seq data analyses 7 th BBBC, February 2014 Outline Introduc8on to ChIP- seq experiment: Biological mo8va8on. Experimental procedure. Method and sohware for ChIP- seq peak calling:
PeakSeq enables systematic scoring of ChIP-seq experiments relative to controls
 PeakSeq enables systematic scoring of ChIP-seq experiments relative to controls Joel Rozowsky, Ghia Euskirchen 2, Raymond K Auerbach 3, Zhengdong D Zhang, Theodore Gibson, Robert Bjornson 4, Nicholas Carriero
ChIP-Seq Data Analysis. J Fass UCD Genome Center Bioinformatics Core Wednesday 15 June 2015
 ChIP-Seq Data Analysis J Fass UCD Genome Center Bioinformatics Core Wednesday 15 June 2015 What s the Question? Where do Transcription Factors (TFs) bind genomic DNA 1? (Where do other things bind DNA
The ChIP-Seq project. Giovanna Ambrosini, Philipp Bucher. April 19, 2010 Lausanne. EPFL-SV Bucher Group
 The ChIP-Seq project Giovanna Ambrosini, Philipp Bucher EPFL-SV Bucher Group April 19, 2010 Lausanne Overview Focus on technical aspects Description of applications (C programs) Where to find binaries,
Mentor: Dr. Bino John
 MAT Shiksha Mantri Mentor: Dr. Bino John Model-based Analysis y of Tiling-arrays g y for ChIP-chip X. Shirley Liu et al., PNAS (2006) vol. 103 no. 33 12457 12462 Tiling Arrays Subtype of microarray chips
ChIP-seq data analysis
 hip-seq data analysis Harri Lähdesmäki Department of omputer Science Aalto University January 8, 2015 Motivation: transcription factor binding site (TBS) prediction Last time we studied computational methods
Chapter 1 Analysis of ChIP-Seq Data with Partek Genomics Suite 6.6
 Chapter 1 Analysis of ChIP-Seq Data with Partek Genomics Suite 6.6 Overview ChIP-Sequencing technology (ChIP-Seq) uses high-throughput DNA sequencing to map protein-dna interactions across the entire genome.
Computation for ChIP-seq and RNA-seq studies
 Computation for ChIP-seq and RNA-seq studies Shirley Pepke 1, Barbara Wold 2 & Ali Mortazavi 2 Genome-wide measurements of protein-dna interactions and transcriptomes are increasingly done by deep DNA
Decoding Chromatin States with Epigenome Data Advanced Topics in Computa8onal Genomics
 Decoding Chromatin States with Epigenome Data 02-715 Advanced Topics in Computa8onal Genomics HMMs for Decoding Chromatin States Epigene8c modifica8ons of the genome have been associated with Establishing
Introduction to Bioinformatics and Gene Expression Technologies
 Introduction to Bioinformatics and Gene Expression Technologies Utah State University Fall 2017 Statistical Bioinformatics (Biomedical Big Data) Notes 1 1 Vocabulary Gene: hereditary DNA sequence at a
Introduction to genome biology
 Introduction to genome biology Lisa Stubbs We ve found most genes; but what about the rest of the genome? Genome size* 12 Mb 95 Mb 170 Mb 1500 Mb 2700 Mb 3200 Mb #coding genes ~7000 ~20000 ~14000 ~26000
Leveraging biological replicates to improve analysis in ChIP-seq experiments
 , http://dx.doi.org/10.5936/csbj.201401002 CSBJ Leveraging biological replicates to improve analysis in ChIP-seq experiments Yajie Yang a,b, Justin Fear a,b, Jianhong Hu c, Irina Haecker d, Lei Zhou a,
Whole Transcriptome Analysis of Illumina RNA- Seq Data. Ryan Peters Field Application Specialist
 Whole Transcriptome Analysis of Illumina RNA- Seq Data Ryan Peters Field Application Specialist Partek GS in your NGS Pipeline Your Start-to-Finish Solution for Analysis of Next Generation Sequencing Data
Introduction to gene expression microarray data analysis
 Introduction to gene expression microarray data analysis Outline Brief introduction: Technology and data. Statistical challenges in data analysis. Preprocessing data normalization and transformation. Useful
PIP-seq. Cells. Permanganate ChIP-Seq
 PIP-seq ells Formaldehyde Permanganate 5 Harvest Lyse Sonicate First dapter Ligation 3 3 5 hip Elute Reverse rosslinks Piperidine cleavage 5 3 3 5 Primer Extension Second dapter Ligation 5 3 3 5 Deep Sequencing
Nature Biotechnology: doi: /nbt Supplementary Figure 1
 Supplementary Figure 1 An extended version of Figure 2a, depicting multi-model training and reverse-complement mode To use the GPU s full computational power, we train several independent models in parallel
Perm-seq: Mapping Protein-DNA Interactions in Segmental Duplication and Highly Repetitive Regions of Genomes with Prior- Enhanced Read Mapping
 RESEARCH ARTICLE Perm-seq: Mapping Protein-DNA Interactions in Segmental Duplication and Highly Repetitive Regions of Genomes with Prior- Enhanced Read Mapping Xin Zeng 1,BoLi 2, Rene Welch 1, Constanza
Gene Expression Data Analysis (I)
") Gene Expression Data Analysis (I) Bing Zhang Department of Biomedical Informatics Vanderbilt University bing.zhang@vanderbilt.edu Bioinformatics tasks Biological question Experiment design Microarray experiment
Gene Expression Data Analysis (I) Bing Zhang Department of Biomedical Informatics Vanderbilt University bing.zhang@vanderbilt.edu Bioinformatics tasks Biological question Experiment design Microarray experiment
Supplementary Data for DNA sequence+shape kernel enables alignment-free modeling of transcription factor binding.
 Supplementary Data for DNA sequence+shape kernel enables alignment-free modeling of transcription factor binding. Wenxiu Ma 1, Lin Yang 2, Remo Rohs 2, and William Stafford Noble 3 1 Department of Statistics,
less sensitive than RNA-seq but more robust analysis pipelines expensive but quantitiatve standard but typically not high throughput
 Chapter 11: Gene Expression The availability of an annotated genome sequence enables massively parallel analysis of gene expression. The expression of all genes in an organism can be measured in one experiment.
Analysis of Microarray Data
 Analysis of Microarray Data Lecture 3: Visualization and Functional Analysis George Bell, Ph.D. Senior Bioinformatics Scientist Bioinformatics and Research Computing Whitehead Institute Outline Review
: Genomic Regions Enrichment of Annotations Tool
 http://great.stanford.edu/ : Genomic Regions Enrichment of Annotations Tool Gill Bejerano Dept. of Developmental Biology & Dept. of Computer Science Stanford University 1 Human Gene Regulation 10 13 different
EECS730: Introduction to Bioinformatics
 EECS730: Introduction to Bioinformatics Lecture 14: Microarray Some slides were adapted from Dr. Luke Huan (University of Kansas), Dr. Shaojie Zhang (University of Central Florida), and Dr. Dong Xu and
Learning a Weighted Sequence Model of the Nucleosome Core and Linker Yields More Accurate Predictions in Saccharomyces cerevisiae and Homo sapiens
 Learning a Weighted Sequence Model of the Nucleosome Core and Linker Yields More Accurate Predictions in Saccharomyces cerevisiae and Homo sapiens Sheila M. Reynolds 1, Jeff A. Bilmes 1,2, William Stafford
The Next Generation of Transcription Factor Binding Site Prediction
 The Next Generation of Transcription Factor Binding Site Prediction Anthony Mathelier*, Wyeth W. Wasserman* Centre for Molecular Medicine and Therapeutics at the Child and Family Research Institute, Department
Introduction to Bioinformatics. Fabian Hoti 6.10.
 Introduction to Bioinformatics Fabian Hoti 6.10. Analysis of Microarray Data Introduction Different types of microarrays Experiment Design Data Normalization Feature selection/extraction Clustering Introduction
Gene Expression Technology
 Gene Expression Technology Bing Zhang Department of Biomedical Informatics Vanderbilt University bing.zhang@vanderbilt.edu Gene expression Gene expression is the process by which information from a gene
Bioinformatics and Genomics: A New SP Frontier?
 Bioinformatics and Genomics: A New SP Frontier? A. O. Hero University of Michigan - Ann Arbor http://www.eecs.umich.edu/ hero Collaborators: G. Fleury, ESE - Paris S. Yoshida, A. Swaroop UM - Ann Arbor
Le proteine regolative variano nei vari tipi cellulari e in funzione degli stimoli ambientali
 Le proteine regolative variano nei vari tipi cellulari e in funzione degli stimoli ambientali Tipo cellulare 1 Tipo cellulare 2 Tipo cellulare 3 DNA-protein Crosslink Lisi Frammentazione Immunopurificazione
Intro to Microarray Analysis. Courtesy of Professor Dan Nettleton Iowa State University (with some edits)
") Intro to Microarray Analysis Courtesy of Professor Dan Nettleton Iowa State University (with some edits) Some Basic Biology Genes are DNA sequences that code for proteins. (e.g. gene lengths perhaps 1000
Intro to Microarray Analysis Courtesy of Professor Dan Nettleton Iowa State University (with some edits) Some Basic Biology Genes are DNA sequences that code for proteins. (e.g. gene lengths perhaps 1000
Regulation of eukaryotic transcription:
 Promoter definition by mass genome annotation data: in silico primer extension EMBNET course Bioinformatics of transcriptional regulation Jan 28 2008 Christoph Schmid Regulation of eukaryotic transcription:
ChIPnorm: A Statistical Method for Normalizing and Identifying Differential Regions in Histone Modification ChIP-seq Libraries
 ChIPnorm: A Statistical Method for Normalizing and Identifying Differential Regions in Histone Modification ChIP-seq Libraries Nishanth Ulhas Nair., Avinash Das Sahu 2., Philipp Bucher 3,4 *, Bernard M.
Agilent Genomic Workbench 7.0
 Agilent Genomic Workbench 7.0 Product Overview Guide Agilent Technologies Notices Agilent Technologies, Inc. 2012, 2015 No part of this manual may be reproduced in any form or by any means (including electronic
Methods of Biomaterials Testing Lesson 3-5. Biochemical Methods - Molecular Biology -
 Methods of Biomaterials Testing Lesson 3-5 Biochemical Methods - Molecular Biology - Chromosomes in the Cell Nucleus DNA in the Chromosome Deoxyribonucleic Acid (DNA) DNA has double-helix structure The
Intracellular receptors specify complex patterns of gene expression that are cell and gene
 SUPPLEMENTAL RESULTS AND DISCUSSION Some HPr-1AR ARE-containing Genes Are Unresponsive to Androgen Intracellular receptors specify complex patterns of gene expression that are cell and gene specific. For
Ensembl Funcgen: A Database and API for Epigenomics and Gene Regulation Data.
 Ensembl Funcgen: A Database and API for Epigenomics and Gene Regulation Data. Nathan Johnson Ensembl Regulation EBI is an Outstation of the European Molecular Biology Laboratory.! Workshop Overview http://www.ebi.ac.uk/~njohnson/courses/23.05.2013-
Green Center Computational Core ChIP- Seq Pipeline, Just a Click Away
 Green Center Computational Core ChIP- Seq Pipeline, Just a Click Away Venkat Malladi Computational Biologist Computational Core Cecil H. and Ida Green Center for Reproductive Biology Science Introduc
ChIP-seq analysis. adapted from J. van Helden, M. Defrance, C. Herrmann, D. Puthier, N. Servant
 ChIP-seq analysis adapted from J. van Helden, M. Defrance, C. Herrmann, D. Puthier, N. Servant http://biow.sb-roscoff.fr/ecole_bioinfo/training_material/chip-seq/documents/presentation_chipseq.pdf A model
RNA-Sequencing analysis
 RNA-Sequencing analysis Markus Kreuz 25. 04. 2012 Institut für Medizinische Informatik, Statistik und Epidemiologie Content: Biological background Overview transcriptomics RNA-Seq RNA-Seq technology Challenges
Functional Genomics Overview RORY STARK PRINCIPAL BIOINFORMATICS ANALYST CRUK CAMBRIDGE INSTITUTE 18 SEPTEMBER 2017
 Functional Genomics Overview RORY STARK PRINCIPAL BIOINFORMATICS ANALYST CRUK CAMBRIDGE INSTITUTE 18 SEPTEMBER 2017 Agenda What is Functional Genomics? RNA Transcription/Gene Expression Measuring Gene
Microarrays: since we use probes we obviously must know the sequences we are looking at!
 These background are needed: 1. - Basic Molecular Biology & Genetics DNA replication Transcription Post-transcriptional RNA processing Translation Post-translational protein modification Gene expression
Computational Methods for Analyzing and Modeling Gene Regulation Dynamics
 Computational Methods for Analyzing and Modeling Gene Regulation Dynamics Jason Ernst August 2008 CMU-ML-08-110 Computational Methods for Analyzing and Modeling Gene Regulation Dynamics Jason Ernst August
measuring gene expression December 5, 2017
 measuring gene expression December 5, 2017 transcription a usually short-lived RNA copy of the DNA is created through transcription RNA is exported to the cytoplasm to encode proteins some types of RNA
Introduction to Next Generation Sequencing (NGS) Data Analysis and Pathway Analysis. Jenny Wu
 Data Analysis and Pathway Analysis. Jenny Wu") Introduction to Next Generation Sequencing (NGS) Data Analysis and Pathway Analysis Jenny Wu Outline Introduction to NGS data analysis in Cancer Genomics NGS applications in cancer research Typical NGS
Introduction to Next Generation Sequencing (NGS) Data Analysis and Pathway Analysis Jenny Wu Outline Introduction to NGS data analysis in Cancer Genomics NGS applications in cancer research Typical NGS
Analysis of a Tiling Regulation Study in Partek Genomics Suite 6.6
 Analysis of a Tiling Regulation Study in Partek Genomics Suite 6.6 The example data set used in this tutorial consists of 6 technical replicates from the same human cell line, 3 are SP1 treated, and 3
Genome-Wide Localization of Protein-DNA Binding and Histone Modification by a Bayesian Change-Point Method with ChIP-seq Data
 Genome-Wide Localization of Protein-DNA Binding and Histone Modification by a Bayesian Change-Point Method with ChIP-seq Data Haipeng Xing 1. *, Yifan Mo 1,2., Will Liao 1,2., Michael Q. Zhang 2,3 1 Applied
Data and Metadata Models Recommendations Version 1.2 Developed by the IHEC Metadata Standards Workgroup
 Data and Metadata Models Recommendations Version 1.2 Developed by the IHEC Metadata Standards Workgroup 1. Introduction The data produced by IHEC is illustrated in Figure 1. Figure 1. The space of epigenomic
Probe-Level Data Normalisation: RMA and GC-RMA Sam Robson Images courtesy of Neil Ward, European Application Engineer, Agilent Technologies.
 Probe-Level Data Normalisation: RMA and GC-RMA Sam Robson Images courtesy of Neil Ward, European Application Engineer, Agilent Technologies. References Summaries of Affymetrix Genechip Probe Level Data,
Introduction to Bioinformatics and Gene Expression Technology
 Vocabulary Introduction to Bioinformatics and Gene Expression Technology Utah State University Spring 2014 STAT 5570: Statistical Bioinformatics Notes 1.1 Gene: Genetics: Genome: Genomics: hereditary DNA
Predicting Microarray Signals by Physical Modeling. Josh Deutsch. University of California. Santa Cruz
 Predicting Microarray Signals by Physical Modeling Josh Deutsch University of California Santa Cruz Predicting Microarray Signals by Physical Modeling p.1/39 Collaborators Shoudan Liang NASA Ames Onuttom
Identifying and mitigating bias in next-generation sequencing methods for chromatin biology
 STUDY DESIGNS Identifying and mitigating bias in next-generation sequencing methods for chromatin biology Clifford A. Meyer and X. Shirley Liu Abstract Next-generation sequencing (NGS) technologies have
Bayesian Variable Selection and Data Integration for Biological Regulatory Networks
 Bayesian Variable Selection and Data Integration for Biological Regulatory Networks Shane T. Jensen Department of Statistics The Wharton School, University of Pennsylvania stjensen@wharton.upenn.edu Gary
Humboldt Universität zu Berlin. Grundlagen der Bioinformatik SS Microarrays. Lecture
 Humboldt Universität zu Berlin Microarrays Grundlagen der Bioinformatik SS 2017 Lecture 6 09.06.2017 Agenda 1.mRNA: Genomic background 2.Overview: Microarray 3.Data-analysis: Quality control & normalization
Lecture 7: April 7, 2005
 Analysis of Gene Expression Data Spring Semester, 2005 Lecture 7: April 7, 2005 Lecturer: R.Shamir and C.Linhart Scribe: A.Mosseri, E.Hirsh and Z.Bronstein 1 7.1 Promoter Analysis 7.1.1 Introduction to
Figure S1: NUN preparation yields nascent, unadenylated RNA with a different profile from Total RNA.
 Summary of Supplemental Information Figure S1: NUN preparation yields nascent, unadenylated RNA with a different profile from Total RNA. Figure S2: rrna removal procedure is effective for clearing out
SUPPLEMENTAL MATERIALS AND METHODS
 SUPPLEMENTAL MATERIALS AND METHODS ChIP-Seq analysis ChIPed DNA sample libraries were analyzed using Illumina parallel sequencing. Peak detection of enriched binding regions was performed using FindPeaks
Bioinformatics of Transcriptional Regulation
 Bioinformatics of Transcriptional Regulation Carl Herrmann IPMB & DKFZ c.herrmann@dkfz.de Wechselwirkung von Maßnahmen und Auswirkungen Einflussmöglichkeiten in einem Dialog From genes to active compounds
Multiple Testing in RNA-Seq experiments
 Multiple Testing in RNA-Seq experiments O. Muralidharan et al. 2012. Detecting mutations in mixed sample sequencing data using empirical Bayes. Bernd Klaus Institut für Medizinische Informatik, Statistik
Exploration, Normalization, Summaries, and Software for Affymetrix Probe Level Data
 Exploration, Normalization, Summaries, and Software for Affymetrix Probe Level Data Rafael A. Irizarry Department of Biostatistics, JHU March 12, 2003 Outline Review of technology Why study probe level
Sanger Sequencing: Troubleshooting Guide
 If you need help analysing your Sanger sequencing output, this guide can help. CONTENTS 1 Introduction... 2 2 Sequence Data Evaluation... 2 3 Troubleshooting... 4 3.1 Reviewing the Sequence... 4 3.1.1
Genomics xxx (2011) xxx xxx. Contents lists available at SciVerse ScienceDirect. Genomics. journal homepage:
 xxx xxx. Contents lists available at SciVerse ScienceDirect. Genomics. journal homepage:") YGENO-08338; No. of pages: 11; 4C: 4, 5, 7 Genomics xxx (2011) xxx xxx Contents lists available at SciVerse ScienceDirect Genomics journal homepage: www.elsevier.com/locate/ygeno Distant cis-regulatory
YGENO-08338; No. of pages: 11; 4C: 4, 5, 7 Genomics xxx (2011) xxx xxx Contents lists available at SciVerse ScienceDirect Genomics journal homepage: www.elsevier.com/locate/ygeno Distant cis-regulatory
A pipeline for ChIP-seq data analysis (Prot 56)
") A pipeline for ChIP-seq data analysis (Prot 56) Ruhi Ali 1, Florence M.G. Cavalli 1, Juan M. Vaquerizas 1 and Nicholas M. Luscombe 2,3,4. 1. European Bioinformatics Institute. Wellcome Trust Genome Campus,
A pipeline for ChIP-seq data analysis (Prot 56) Ruhi Ali 1, Florence M.G. Cavalli 1, Juan M. Vaquerizas 1 and Nicholas M. Luscombe 2,3,4. 1. European Bioinformatics Institute. Wellcome Trust Genome Campus,
The ENCODE Encyclopedia. & Variant Annotation Using RegulomeDB and HaploReg
 The ENCODE Encyclopedia & Variant Annotation Using RegulomeDB and HaploReg Jill E. Moore Weng Lab University of Massachusetts Medical School October 10, 2015 Where s the Encyclopedia? ENCODE: Encyclopedia
Mapping strategies for sequence reads
 Mapping strategies for sequence reads Ernest Turro University of Cambridge 21 Oct 2013 Quantification A basic aim in genomics is working out the contents of a biological sample. 1. What distinct elements
Measuring transcriptomes with RNA-Seq
 Measuring transcriptomes with RNA-Seq BMI/CS 776 www.biostat.wisc.edu/bmi776/ Spring 2017 Anthony Gitter gitter@biostat.wisc.edu These slides, excluding third-party material, are licensed under CC BY-NC
Performance characteristics of the High Sensitivity DNA kit for the Agilent 2100 Bioanalyzer
 Performance characteristics of the High Sensitivity DNA kit for the Agilent 2100 Bioanalyzer Technical Note 10 Measured conc. [ng/µl] 1 Y intercept = 0.09 r 2 = 0.993 0.1 0.1 1 10 Reference concentration
Multi-omics in biology: integration of omics techniques
 31/07/17 Летняя школа по биоинформатике 2017 Multi-omics in biology: integration of omics techniques Konstantin Okonechnikov Division of Pediatric Neurooncology German Cancer Research Center (DKFZ) 2 Short
Human SNP haplotypes. Statistics 246, Spring 2002 Week 15, Lecture 1
 Human SNP haplotypes Statistics 246, Spring 2002 Week 15, Lecture 1 Human single nucleotide polymorphisms The majority of human sequence variation is due to substitutions that have occurred once in the
Quality Control Assessment in Genotyping Console
 Quality Control Assessment in Genotyping Console Introduction Prior to the release of Genotyping Console (GTC) 2.1, quality control (QC) assessment of the SNP Array 6.0 assay was performed using the Dynamic
Figure S4 A-H : Initiation site properties and evolutionary changes
 A 0.3 Figure S4 A-H : Initiation site properties and evolutionary changes G-correction not used 0.25 Fraction of total counts 0.2 0.5 0. tag 2 tags 3 tags 4 tags 5 tags 6 tags 7tags 8tags 9 tags >9 tags
Microarray Analysis of Gene Expression in Huntington's Disease Peripheral Blood - a Platform Comparison. CodeLink compatible
 Microarray Analysis of Gene Expression in Huntington's Disease Peripheral Blood - a Platform Comparison CodeLink compatible Microarray Analysis of Gene Expression in Huntington's Disease Peripheral Blood
Lecture #1. Introduction to microarray technology
 Lecture #1 Introduction to microarray technology Outline General purpose Microarray assay concept Basic microarray experimental process cdna/two channel arrays Oligonucleotide arrays Exon arrays Comparing
Machine Learning Methods for RNA-seq-based Transcriptome Reconstruction
 Machine Learning Methods for RNA-seq-based Transcriptome Reconstruction Gunnar Rätsch Friedrich Miescher Laboratory Max Planck Society, Tübingen, Germany NGS Bioinformatics Meeting, Paris (March 24, 2010)
Microarray Gene Expression Analysis at CNIO
 Microarray Gene Expression Analysis at CNIO Orlando Domínguez Genomics Unit Biotechnology Program, CNIO 8 May 2013 Workflow, from samples to Gene Expression data Experimental design user/gu/ubio Samples
Nature Structural & Molecular Biology: doi: /nsmb Supplementary Figure 1
 Supplementary Figure 1 Origin use and efficiency are similar among WT, rrm3, pif1-m2, and pif1-m2; rrm3 strains. A. Analysis of fork progression around confirmed and likely origins (from cerevisiae.oridb.org).
Identifying the binding sites and regulatory targets of a transcription
 Model-based analysis of tiling-arrays for ChIP-chip W. Evan Johnson*, Wei Li*, Clifford A. Meyer*, Raphael Gottardo, Jason S. Carroll, Myles Brown, and X. Shirley Liu* *Department of Biostatistics and
A Distribution Free Summarization Method for Affymetrix GeneChip Arrays
 A Distribution Free Summarization Method for Affymetrix GeneChip Arrays Zhongxue Chen 1,2, Monnie McGee 1,*, Qingzhong Liu 3, and Richard Scheuermann 2 1 Department of Statistical Science, Southern Methodist
DNA Microarray Data Oligonucleotide Arrays
 DNA Microarray Data Oligonucleotide Arrays Sandrine Dudoit, Robert Gentleman, Rafael Irizarry, and Yee Hwa Yang Bioconductor Short Course 2003 Copyright 2002, all rights reserved Biological question Experimental
qpcr Quantitative PCR or Real-time PCR Gives a measurement of PCR product at end of each cycle real time
 qpcr qpcr Quantitative PCR or Real-time PCR Gives a measurement of PCR product at end of each cycle real time Differs from endpoint PCR gel on last cycle Used to determines relative amount of template
Measuring transcriptomes with RNA-Seq. BMI/CS 776 Spring 2016 Anthony Gitter
 Measuring transcriptomes with RNA-Seq BMI/CS 776 www.biostat.wisc.edu/bmi776/ Spring 2016 Anthony Gitter gitter@biostat.wisc.edu Overview RNA-Seq technology The RNA-Seq quantification problem Generative
ab ChIP Kit Magnetic One-Step
 ab156907 ChIP Kit Magnetic One-Step Instructions for Use For selective enrichment of a chromatin fraction containing specific DNA sequences in a high throughput format using chromatin isolated from various
On the detection and refinement of transcription factor binding sites using ChIP-Seq data
 Nucleic Acids Research Advance Access published January 6, 2010 Nucleic Acids Research, 2009, 1 14 doi:10.1093/nar/gkp1180 On the detection and refinement of transcription factor binding sites using ChIP-Seq
Background Correction and Normalization. Lecture 3 Computational and Statistical Aspects of Microarray Analysis June 21, 2005 Bressanone, Italy
 Background Correction and Normalization Lecture 3 Computational and Statistical Aspects of Microarray Analysis June 21, 2005 Bressanone, Italy Feature Level Data Outline Affymetrix GeneChip arrays Two
Myers Lab ChIP-seq Protocol v Modified January 10, 2014
 Myers Lab ChIP-seq Protocol V011014 1 Contact information: Dr. Florencia Pauli Behn HudsonAlpha Institute for Biotechnology 601 Genome Way Huntsville, AL 35806 Telephone: 256-327-5229 Email: fpauli@hudsonalpha.org
Next-Generation Sequencing. Technologies
 Next-Generation Next-Generation Sequencing Technologies Sequencing Technologies Nicholas E. Navin, Ph.D. MD Anderson Cancer Center Dept. Genetics Dept. Bioinformatics Introduction to Bioinformatics GS011062
ChromaSig: A Probabilistic Approach to Finding Common Chromatin Signatures in the Human Genome
 : A Probabilistic Approach to Finding Common Chromatin Signatures in the Human Genome Gary Hon 1,2, Bing Ren 1,2,3 *, Wei Wang 1,4 * 1 Bioinformatics Program, University of California San Diego, La Jolla,
Many transcription factors! recognize DNA shape
 Many transcription factors! recognize DN shape Katie Pollard! Gladstone Institutes USF Division of Biostatistics, Institute for Human Genetics, and Institute for omputational Health Sciences ENODE Users
Exploration and Analysis of DNA Microarray Data
 Exploration and Analysis of DNA Microarray Data Dhammika Amaratunga Senior Research Fellow in Nonclinical Biostatistics Johnson & Johnson Pharmaceutical Research & Development Javier Cabrera Associate
RNA-Seq analysis using R: Differential expression and transcriptome assembly
 RNA-Seq analysis using R: Differential expression and transcriptome assembly Beibei Chen Ph.D BICF 12/7/2016 Agenda Brief about RNA-seq and experiment design Gene oriented analysis Gene quantification
Gene Regulation Solutions. Microarrays and Next-Generation Sequencing
 Gene Regulation Solutions Microarrays and Next-Generation Sequencing Gene Regulation Solutions The Microarrays Advantage Microarrays Lead the Industry in: Comprehensive Content SurePrint G3 Human Gene
Modern Epigenomics. Histone Code
 Modern Epigenomics Histone Code Ting Wang Department of Genetics Center for Genome Sciences and Systems Biology Washington University Dragon Star 2012 Changchun, China July 2, 2012 DNA methylation + Histone
Supporting Information
 Supporting Information Ho et al. 1.173/pnas.81288816 SI Methods Sequences of shrna hairpins: Brg shrna #1: ccggcggctcaagaaggaagttgaactcgagttcaacttccttcttgacgnttttg (TRCN71383; Open Biosystems). Brg shrna
ENCODE RBP Antibody Characterization Guidelines
 ENCODE RBP Antibody Characterization Guidelines Approved on November 18, 2016 Background An integral part of the ENCODE Project is to characterize the antibodies used in the experiments. This document
Introduction to BioMEMS & Medical Microdevices DNA Microarrays and Lab-on-a-Chip Methods
 Introduction to BioMEMS & Medical Microdevices DNA Microarrays and Lab-on-a-Chip Methods Companion lecture to the textbook: Fundamentals of BioMEMS and Medical Microdevices, by Prof., http://saliterman.umn.edu/
Atelier Chip-Seq. Stéphanie Le Gras, IGBMC Strasbourg Violaine Saint-André, Institut Curie Paris Morgane Thomas-Chollier, ENS Paris
 Atelier Chip-Seq Stéphanie Le Gras, IGBMC Strasbourg Violaine Saint-André, Institut Curie Paris Morgane Thomas-Chollier, ENS Paris École de bioinformatique AVIESAN-IFB 2017 Get connected to the server
Serial Analysis of Gene Expression
 Serial Analysis of Gene Expression Cloning of Tissue-Specific Genes Using SAGE and a Novel Computational Substraction Approach. Genomic (2001) Hung-Jui Shih Outline of Presentation SAGE EST Article TPE
Nima Hejazi. Division of Biostatistics University of California, Berkeley stat.berkeley.edu/~nhejazi. nimahejazi.org github/nhejazi
 Data-Adaptive Estimation and Inference in the Analysis of Differential Methylation for the annual retreat of the Center for Computational Biology, given 18 November 2017 Nima Hejazi Division of Biostatistics
Validation Study of FUJIFILM QuickGene System for Affymetrix GeneChip
 Validation Study of FUJIFILM QuickGene System for Affymetrix GeneChip Reproducibility of Extraction of Genomic DNA from Whole Blood samples in EDTA using FUJIFILM membrane technology on the QuickGene-810
MulCom: a Multiple Comparison statistical test for microarray data in Bioconductor.
 MulCom: a Multiple Comparison statistical test for microarray data in Bioconductor. Claudio Isella, Tommaso Renzulli, Davide Corà and Enzo Medico May 3, 2016 Abstract Many microarray experiments compare