Mayday and beyond: New Approaches for the Visualisation of Genomics and Transcriptomics Data
|
|
|
- Kelly Moore
- 6 years ago
- Views:
Transcription

1 Mayday and beyond: New Approaches for the Visualisation of Genomics and Transcriptomics Data Kay Nieselt Center for Bioinformatics Tübingen University of Tübingen
2 Genomics Genomics is the study of the genomes of organisms Today large projects that compare genomes within a species, such as 1000 genomes project (in human), 1001 genomes project (in A. thaliana), many many more 2
3 Genome Comparison Comparison often based on alignment of whole genomes or parts of genomes Whole-genome alignments elucidate similarity and diversity on different scales! Large-scale variations: genomic rearrangements (translocations, inversions) 3 Inversion Translocation Duplication
4 Genome Comparison Comparison often based on alignment of whole genomes or parts of genomes Whole-genome alignments elucidate similarity and diversity on different scales! Large-scale variations: genomic rearrangements (translocations, inversions)! Small-scale variations: mutations, insertions, deletions 4 ACGGTGCAGTTACCA! Deletion Mutation AC----CAGTCACCA!
5 Genome Comparison Comparison often based on alignment of whole genomes or parts of genomes Whole-genome alignments elucidate similarity and diversity on different scales! Large-scale variations: genomic rearrangements (translocations, inversions)! Small-scale variations: gene content, insertions, deletions 5 Genome variations and their analyses are often subject to visualization

6 GenomeRing: Visualizing genomic diversity Application of the SuperGenome to the visualization of aligned multiple genomes Outer Ring = Forward strand 6 SuperGenome is a common coordinate system of all aligned genomes, independent of a prechosen reference genome Alignments represented as blocks Color coding for genomes Paths represent genomic architecture Inner Ring = Reverse strand Herbig, Jäger, Battke, Nieselt, 2012, Bioinformatics
7 GenomeRing: some applications GenomeRing of 4 Campylobacter jejuni species 7
8 GenomeRing: some applications GenomeRing of 32 Staphylococcus aureus species 8

9 GenomeRing: some applications GenomeRing of 8 Yersinia pestis strains 9
10 From Genome to Transcriptomes Observation: dissimilarity of genomes not sufficient to explain difference in genotypes Add expression data In particular: study all the genes of a cell or tissue, at the DNA (genotype) and mrna (transcriptome) (or protein (proteome)) levels 10

11 The central dogma of molecular biology Biological events are controlled by gene expression: the process by which information from a gene is used in the synthesis of a functional gene product. 11 When and to which extent is each gene in a given cell expressed? mrna levels easier to measure than protein levels Regulation of gene expression can only be understood by studying the transcriptome Central_dogma_of_molecular_biology
12 Key research questions Catalogue all species of transcripts, e.g. RNAs of protein- as well as non-coding genes Compare abundance changes of genes between different conditions detection of differentially expressed genes Identification of genes expressed in the same process How are genes regulated (derive regulatory network) Determine the transcriptional structure of genes transcriptional start sites (TSS) 5 and 3 UTRs splicing patterns (eukaryotes) fusion genes Antisense transcription 12

 Two-dimensional grid of")

13 Technologies Most commonly employed method uses microarrays 13 Microarrays measure mrna concentration through hybridization to a probe immobilized on a carrier material ( chip ) Two-dimensional grid of features (mostly oligos) Usually arranged on a glass slide Typical microarray contains 100,000-1,000,000 microscopic DNA spots
14 Work flow for µ-array expression data 14 Normalization Reduce the technical variation to a minimum, make each array experiment comparable Filtering Identify transcripts with very little signal variation and filter out Analyze Expression levels Clustering Differential expression Pathway analysis
15 RNA-seq: Digital transcription profiling mrna are first converted into a library of fragmented cdna adaptors are added high-throughput sequencing yields short sequence reads with fast mapping algorithms reads are aligned to the reference sequence expression quantification yields a base-resolution digital count for each transcript 15 Figure from: Wang et al. 2009, Nature Reviews Genetics

16 Work flow for RNA-seq data 16 Raw read processing Map reads Aggregate and quantify Normalize Analyse Expression levels Novel genes Differential expression Alternative splicing

17 Expression profiling Measures expression (activity) of genes under certain conditions 17 expression profiling: when, where and to what extent is a gene expressed gene 1 gene 2
18 Challenges for visualisation Transcriptomics data (as other omics data) is high-dimensional: can be more than 50,000 transcripts in experiments noisy linear and non-linear correlations Contains patterns 18 Visualizations should help to detect important signals active genes be guided by Shneiderman s visual information seeking mantra: present an overview of the entire data, then zoom and filter, finally details on demand
19 Mayday Mayday short for Microarray Data Analysis Workbench for visualization, analysis and storage of expression data (originally derived with microarrays, latest version can analyze any type of abundance data) Written in JAVA programming language " Runs on all platforms supporting Java runtime environment 1.7 " Stand-alone or as Java Webstart version Open source software (GNU General Public License) Ongoing project with continuously added functionality 19 Battke, Symons, Nieselt, 2010, BMC Bioinformatics
20 Mayday s Features 20 Data Mining Methods Statistical Methods Processing Pipeline Dynamic Filtering Visualisations Partitioning Clustering (k- Means, QT,...) Hierarchical Clustering (NJ, UPGMA,...) Multi-class gene mining Machine learning (via WEKA) Gene Set Enrichment Analysis (GSEA) Student s t- test, WAD, SAM, Rank Product Information Gain, Gini Index, Quartet Mining,... Repetitive processing steps can be automated Processing modules can easily be combined into pipelines Image of a processing pipeline Filters are built from modules chained together Modules chains can be linked with AND, OR, NOT Scatterplots, Profile plots, Heatmap, Enhanced Heatmap Dendrogram Genome Browser
21 Visualisations in Mayday 21 Online Data Manipulation Interactivity Change the data only for one visualisation (z-scoring) Zooming, selections,... Connectivity Different visualisations of the same data are synchronized Enhancements Color for additional information Enhance plots using meta information Powerful Framework New plots are easy to implement with small amounts of code
22 Example Application Systems Biology for Microorganisms 22 Time series Transcriptome, Proteome and Metabolome data from submerged batch fermentations of wildtype and several mutant strains of Streptomyces coelicolor grown under different starvation conditions Transcriptomes: assessed with customdesigned Affymetrix GeneChip for Streptomyces coelicolor (protein- and noncoding genes)
23 Transcriptome Time Series wildtype 32 samples taken along growth curve 20-44h hourly; 46-60h 2-hourly Array data produced for all 32 samples from one 7.0 fermenter CDW [g/l] time after inoculation Goal: find differentially expressed genes and compare to proteome data Nieselt et al., BMC Genomics 2010, Battke et al., Software Tools and Algorithms for Biological Systems 2010, Thomas et al., Mol Cel. Prot. 2012
24 Bioinformatics pipeline All powered by Mayday: 1. Normalization of Affymetrix CEL files: using Mayday SeaSight RMA (Background correction, Quantile Normalization, Summarization), check quality 2. Differential expression: filtering by regularized variance 3. Unsupervised Clustering of sample expression profiles (Neighbor Joining, Euclidean) Time tree 4. Unsupervised Clustering of transcript expression profiles (QT, Pearson Correlation) 24 All assessed by visualizations in Mayday
25 1. Normalization: use SeaSight Import raw microarray data as well as mapped sequencing reads 25 Background correction RNA-seq: Computing expression values from mapped reads Normalization Summarization Linking microarray probes to genomic coordinates Combine transformations in a user-friendly graphical interface to quickly construct powerful normalization pipelines

26 SeaSight applied to CEL files 26
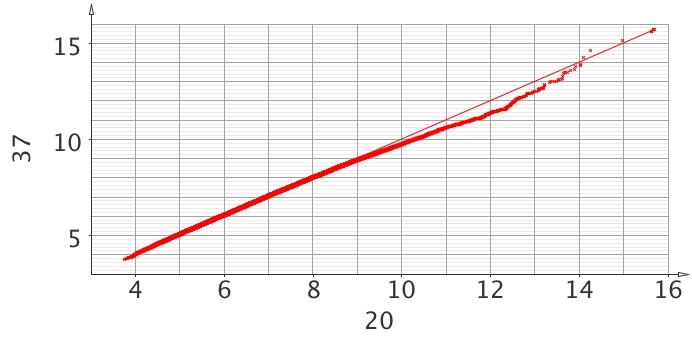
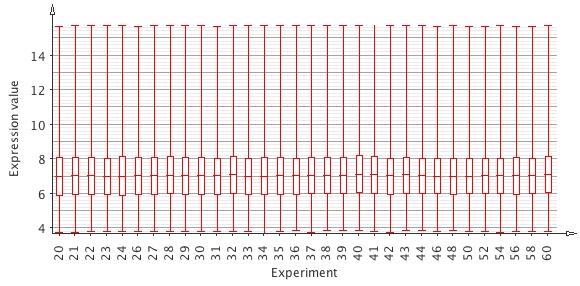
27 Check normalisation Boxplot 27 histogram qq-plot

28 2. Compute diff. expressed genes 28


29 2. Compute diff. expressed genes 29
30 3. Clustering: finding co-expressed transcripts Paradigm of expression profiling: similar profiles co-expression coregulation Clustering is the process of assigning transcripts with similar profiles into a common cluster Many different clustering algorithm (types): hierarchical: one transcript can be member of more than one cluster partitioning: each transcript is member of one cluster 30
31 Clustering of time points: Trees 31 Phosphate depletion
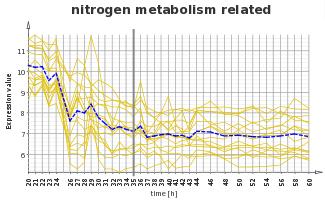
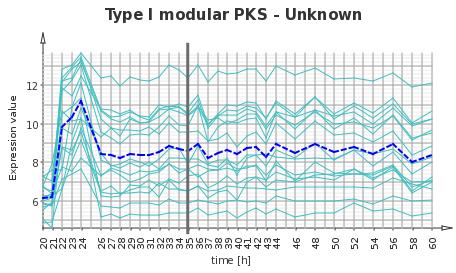
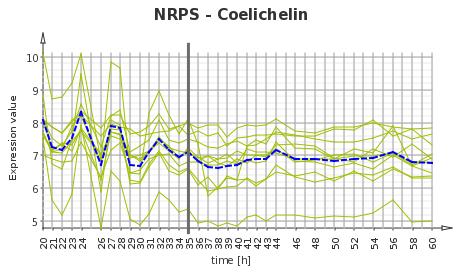
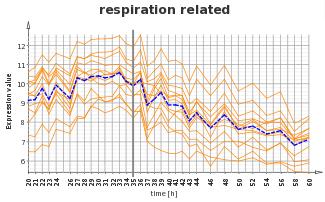
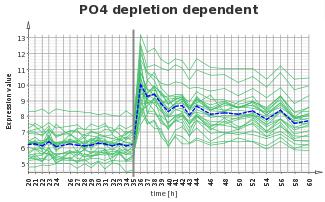
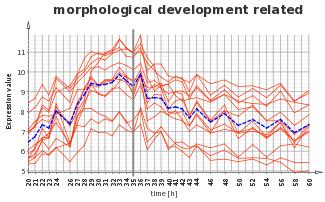
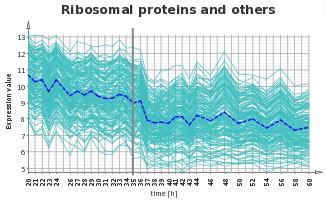


32 Visualisations: profile plots 32

33 Visualisations: profile plot 33
34 Visualisations: profile plot Linked visualisations 34
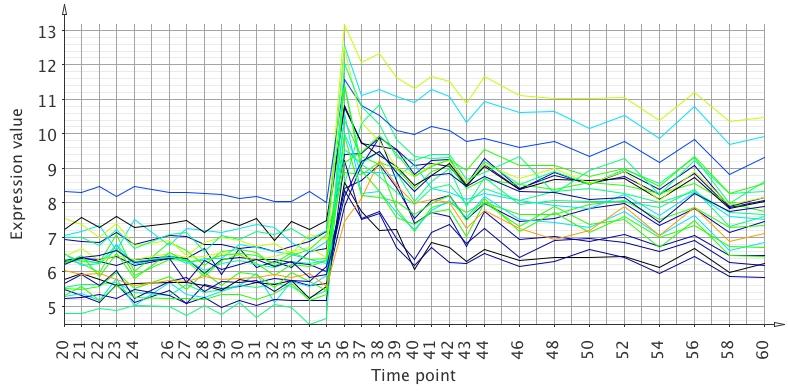
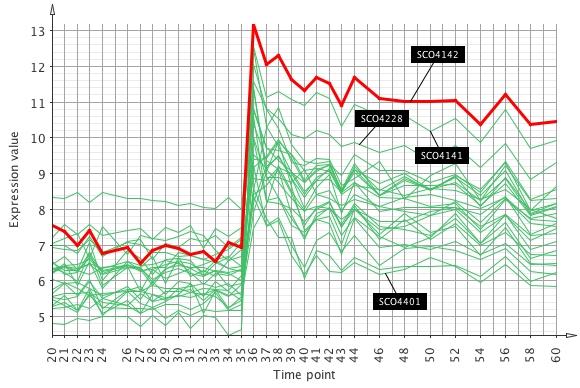
35 Visualisations: profile plot Colored by gene annotation 35
")
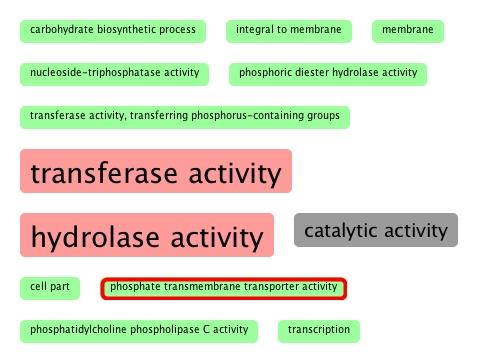
36 Visualisations: profile plot Additional column attached to data (concept developed in SpRay*) 36

37 SpRay: Visual Analytics of expression data 37 Dietzsch, Heinrich, Nieselt, Bartz, IEEE Symp. on VAST 2009.
 Sorting of rows also according to additional columns Gehlenborg et al. 2005, Inform Vis Battke et al.")
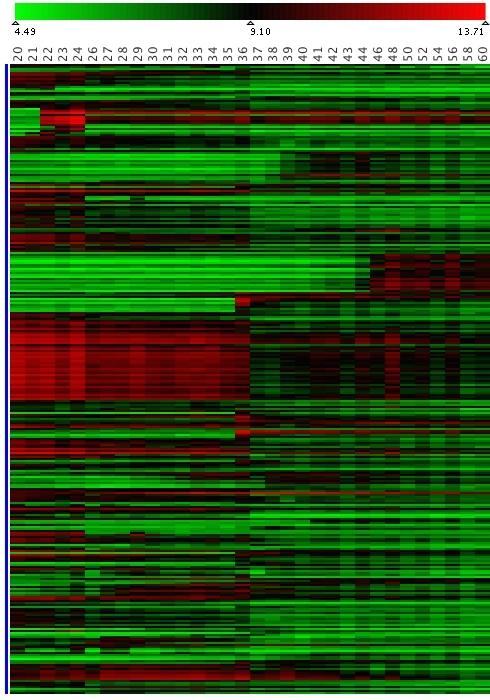
38 Enhanced Heatmap Add features to traditional heatmap: 38 Additional columns representing meta information: Meta information derived from annotation data or statistical computations (e.g. p-value of test) Sorting of rows also according to additional columns Gehlenborg et al. 2005, Inform Vis Battke et al. 2010, BMC Bioinformatics
39 TIALA - Time Series Alignment Analysis Powerful visual analytics approach for large scale expression data First and only tool for comparing two and more time series of expression data both analytically as well as visually 39 Jäger, Battke, Nieselt, IEEE Symposium on Biol. Data Visualization 2011.

40 TIALA - Time Series Alignment Analysis 40
41 Mayday as an -Omics tool Mayday is not limited to expression data Any matrix of numerical data can be analyzed or several ones Microarray, RNA-seq data 41 Proteom Data Metabolome Data qpcr results eqtl data...


42 Integrative Omics 42 Here comparing the proteome with the transcriptome across 8 time points of S. coelicolor wildtype.
43 Integrative Omics Combining Genomes and Expression 43 Expression in the genomic context: GenomeBrowser in Mayday
44 Genome Browser Continuous zoom from whole genome to single base resolution 44
45 Integrative Omics Combining Genomes and Expression 45 GenomeRing is integrated into Mayday and allows for linking of genome and for example differentially expressed genes

46 Genomics and Transcriptomics GenomeRing of 3 Helicobacter pylori strains with added expression track that shows up- and down-regulated genes in genome Linked with genome browser
47 Going even further Combining and integrating 47 Genomics (SNP genotypes) Transcriptomics (Expression phenotypes) and Clinical Phenotypes
48 48 Reveal - Visual eqtl Analytics
49 Genetic variation and disease association (Complex) Diseases can be better understood by studying genetic variation across the whole genome Genome-wide association studies (GWAS) examine genetic variants (mainly SNPs) in connection with traits, e.g. diseases 49


50 ihat: interactive Hierarchical Aggregation Table SNPs Meta-Information 50 aggregated view Subjects reference genotype SNP in one allele SNP in both alleles Blue-whitered color gradient for quantitative metainformation offers aggregation techniques to reveal hidden structure in the data
51 eqtl - expression Quantitative Trait Locus GWAS cannot specify the genes causal for the phenotype Biological events are controlled by gene expression: the process by which information from a gene is used in the synthesis of a functional gene product. eqtl are genomic loci regulating gene expression Goal: connect those genotypes with phenotypes such that causal associations are identified 51
52 Key challenges of eqtl experiments detect those significant genomic variations that affect expression levels identify the underlying mechanisms, typically large networks very large, heterogeneous and complex data: a typical complete data set would comprise O(10 6 ) loci, O(10 4 ) genes in O(10 2 ) tissues for O(10 3 ) subjects 52


53 Levels of complexity in eqtl studies 53 Level 1 Level 2 Level 3 Clinical Phenotype Clinical Phenotype Genotype (SNPs) Genotype (SNPs) GWAS Gene Expression Analysis Association Linkage Analysis Clinical Phenotype Genotype (SNPs) Gene Expression Gene Expression Gene Expression Increasing Complexity
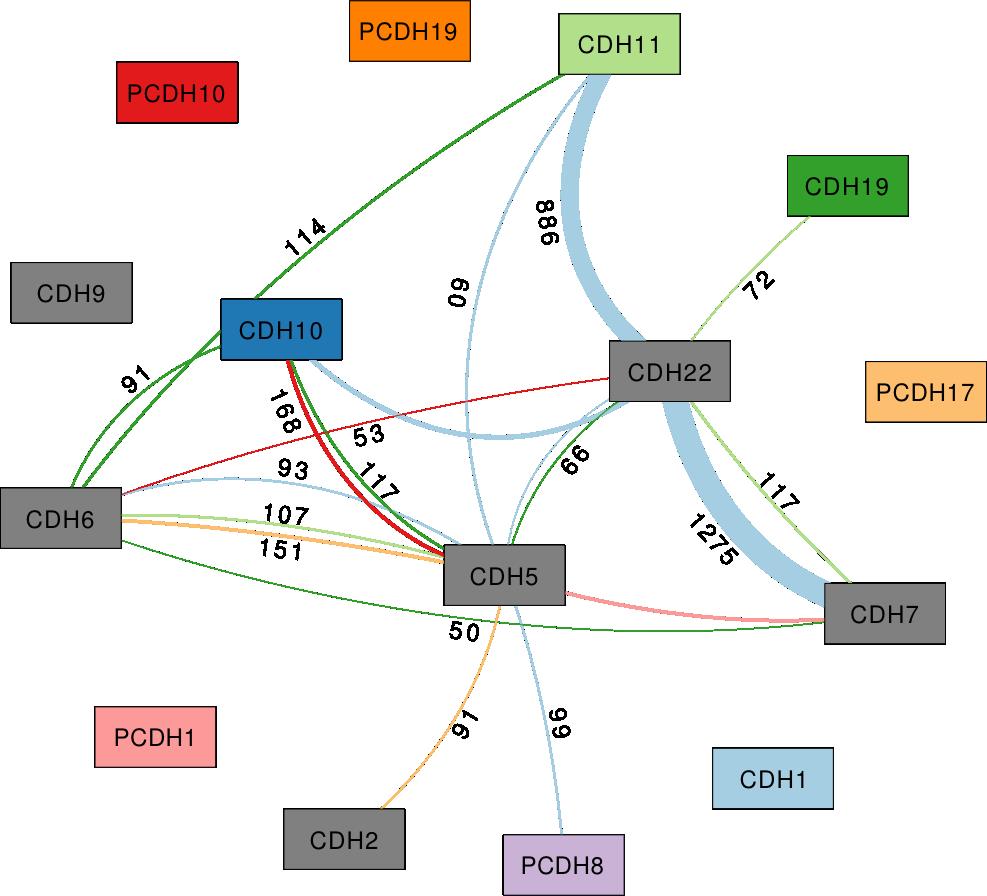
54 Reveal (part of Mayday) With Reveal we address these challenges and have introduced various different visualisations, one is the association graph: a node-link graph that visualizes relationship of SNPs and gene expression (phenotype), allows visualisation of trans as well as cis effects (for level 2) 54 Jäger, Battke, Nieselt, Bioinformatics 2012.
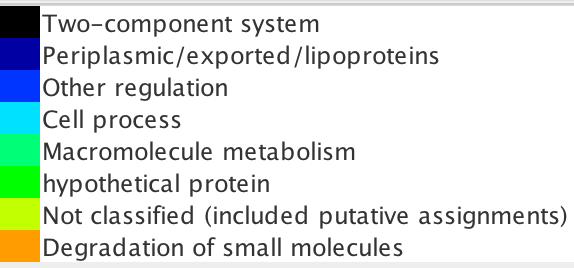
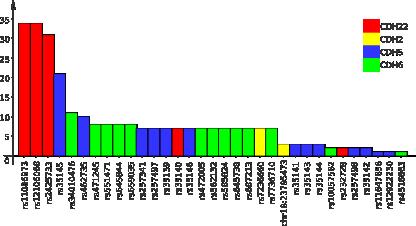
 55 for each SNP identify closest gene each gene is represented by a node give node a color if at least one SNP")

55 Association Graph Visualize the association of genotype and expression start with pairs of SNPs that commonly affect the expression of a gene (result of a statistical analysis) 55 for each SNP identify closest gene each gene is represented by a node give node a color if at least one SNP within a two-locus pair lies in that gene an edge is drawn if there exists a twolocus SNP pair edge gets color of node of gene that is affected by that SNP pair common edges are aggregated and weighted according to number of SNP pairs 1280 SNP pairs from CDH22 and CDH7 influence the expression of CDH10

56 Association Graph Example: genes, full graph based on 62,136 SNP pairs


57 Association Graph - edge weight filtering edges filtered: only edges with weights larger 50

58 Expression Heatmap rank genes by significant differential expression 58 Affected patients Unaffected patients aggregate
59 Integrating SNP - expression 59
60 Outlook Challenges of future applications Scalability: data becomes bigger and bigger 1000s of genomes and other omics data sets to analyze and visualize: powerful aggregation and innovative techniques are needed Full visual analytics methods Combine all levels of complexity of eqtl data: inphap* (includes also phased haplotype data) 60 *Jäger, Peltzer, Nieselt, BMC Bioinformatics 2014.
61 Acknowledgements My current and former doctoral students: Florian Battke Alexander Herbig Günter Jäger Aydin Polatkan Stephan Symons Collaboration partners: Michael Bonin (MFT Services, now IMGM Munich) Wolfgang Wohlleben (SysMO S. coelicolor, Univ. Tü) Karsten Borgwardt (Reveal, ETH Zürich) 61

62 62 Thank you for your attention! Questions? Download Mayday at:


63 63 : July 2015 Find out more at: Call for participation: Papers Feb 15 Posters May 29 Data contest - May 1 Design contest May 1
AGILENT S BIOINFORMATICS ANALYSIS SOFTWARE
 ACCELERATING PROGRESS IS IN OUR GENES AGILENT S BIOINFORMATICS ANALYSIS SOFTWARE GENESPRING GENE EXPRESSION (GX) MASS PROFILER PROFESSIONAL (MPP) PATHWAY ARCHITECT (PA) See Deeper. Reach Further. BIOINFORMATICS
Gene Expression Technology
 Gene Expression Technology Bing Zhang Department of Biomedical Informatics Vanderbilt University bing.zhang@vanderbilt.edu Gene expression Gene expression is the process by which information from a gene
Introduction to Microarray Analysis
 Introduction to Microarray Analysis Methods Course: Gene Expression Data Analysis -Day One Rainer Spang Microarrays Highly parallel measurement devices for gene expression levels 1. How does the microarray
From Variants to Pathways: Agilent GeneSpring GX s Variant Analysis Workflow
 From Variants to Pathways: Agilent GeneSpring GX s Variant Analysis Workflow Technical Overview Import VCF Introduction Next-generation sequencing (NGS) studies have created unanticipated challenges with
Agilent GeneSpring GX 10: Beyond. Pam Tangvoranuntakul Product Manager, GeneSpring October 1, 2008
 Agilent GeneSpring GX 10: Gene Expression and Beyond Pam Tangvoranuntakul Product Manager, GeneSpring October 1, 2008 GeneSpring GX 10 in the News Our Goals for GeneSpring GX 10 Goal 1: Bring back GeneSpring
Introduction to Bioinformatics and Gene Expression Technologies
 Introduction to Bioinformatics and Gene Expression Technologies Utah State University Fall 2017 Statistical Bioinformatics (Biomedical Big Data) Notes 1 1 Vocabulary Gene: hereditary DNA sequence at a
RNA-Sequencing analysis
 RNA-Sequencing analysis Markus Kreuz 25. 04. 2012 Institut für Medizinische Informatik, Statistik und Epidemiologie Content: Biological background Overview transcriptomics RNA-Seq RNA-Seq technology Challenges
SNPs - GWAS - eqtls. Sebastian Schmeier
 SNPs - GWAS - eqtls s.schmeier@gmail.com http://sschmeier.github.io/bioinf-workshop/ 17.08.2015 Overview Single nucleotide polymorphism (refresh) SNPs effect on genes (refresh) Genome-wide association
About Strand NGS. Strand Genomics, Inc All rights reserved.
 About Strand NGS Strand NGS-formerly known as Avadis NGS, is an integrated platform that provides analysis, management and visualization tools for next-generation sequencing data. It supports extensive
Introduction to Bioinformatics and Gene Expression Technology
 Vocabulary Introduction to Bioinformatics and Gene Expression Technology Utah State University Spring 2014 STAT 5570: Statistical Bioinformatics Notes 1.1 Gene: Genetics: Genome: Genomics: hereditary DNA
CS273B: Deep Learning in Genomics and Biomedicine. Recitation 1 30/9/2016
 CS273B: Deep Learning in Genomics and Biomedicine. Recitation 1 30/9/2016 Topics Genetic variation Population structure Linkage disequilibrium Natural disease variants Genome Wide Association Studies Gene
Analysis of Microarray Data
 Analysis of Microarray Data Lecture 3: Visualization and Functional Analysis George Bell, Ph.D. Senior Bioinformatics Scientist Bioinformatics and Research Computing Whitehead Institute Outline Review
Agilent Genomics Software Future Directions
 Agilent Genomics Software Future Directions Michael Rosenberg, PhD Director, Genomics Software Agilent: A Focused Measurement Company Serving Diverse End Markets Electronic Measurement 2008 Revenue: $3.6
TSSpredator User Guide v 1.00
 TSSpredator User Guide v 1.00 Alexander Herbig alexander.herbig@uni-tuebingen.de Kay Nieselt kay.nieselt@uni-tuebingen.de June 3, 2013 1 Getting Started TSSpredator is a tool for the comparative detection
BIOINFORMATICS AND SYSTEM BIOLOGY (INTERNATIONAL PROGRAM)
") BIOINFORMATICS AND SYSTEM BIOLOGY (INTERNATIONAL PROGRAM) PROGRAM TITLE DEGREE TITLE Master of Science Program in Bioinformatics and System Biology (International Program) Master of Science (Bioinformatics
BIOINFORMATICS AND SYSTEM BIOLOGY (INTERNATIONAL PROGRAM) PROGRAM TITLE DEGREE TITLE Master of Science Program in Bioinformatics and System Biology (International Program) Master of Science (Bioinformatics
Whole Transcriptome Analysis of Illumina RNA- Seq Data. Ryan Peters Field Application Specialist
 Whole Transcriptome Analysis of Illumina RNA- Seq Data Ryan Peters Field Application Specialist Partek GS in your NGS Pipeline Your Start-to-Finish Solution for Analysis of Next Generation Sequencing Data
Recent technology allow production of microarrays composed of 70-mers (essentially a hybrid of the two techniques)
") Microarrays and Transcript Profiling Gene expression patterns are traditionally studied using Northern blots (DNA-RNA hybridization assays). This approach involves separation of total or polya + RNA on
Microarrays and Transcript Profiling Gene expression patterns are traditionally studied using Northern blots (DNA-RNA hybridization assays). This approach involves separation of total or polya + RNA on
Outline. Array platform considerations: Comparison between the technologies available in microarrays
 Microarray overview Outline Array platform considerations: Comparison between the technologies available in microarrays Differences in array fabrication Differences in array organization Applications of
Gene Regulation Solutions. Microarrays and Next-Generation Sequencing
 Gene Regulation Solutions Microarrays and Next-Generation Sequencing Gene Regulation Solutions The Microarrays Advantage Microarrays Lead the Industry in: Comprehensive Content SurePrint G3 Human Gene
Knowledge-Guided Analysis with KnowEnG Lab
 Han Sinha Song Weinshilboum Knowledge-Guided Analysis with KnowEnG Lab KnowEnG Center Powerpoint by Charles Blatti Knowledge-Guided Analysis KnowEnG Center 2017 1 Exercise In this exercise we will be doing
Smart India Hackathon
 TM Persistent and Hackathons Smart India Hackathon 2017 i4c www.i4c.co.in Digital Transformation 25% of India between age of 16-25 Our country needs audacious digital transformation to reach its potential
Philippe Hupé 1,2. The R User Conference 2009 Rennes
 A suite of R packages for the analysis of DNA copy number microarray experiments Application in cancerology Philippe Hupé 1,2 1 UMR144 Institut Curie, CNRS 2 U900 Institut Curie, INSERM, Mines Paris Tech
Introduction to Bioinformatics. Fabian Hoti 6.10.
 Introduction to Bioinformatics Fabian Hoti 6.10. Analysis of Microarray Data Introduction Different types of microarrays Experiment Design Data Normalization Feature selection/extraction Clustering Introduction
The first and only fully-integrated microarray instrument for hands-free array processing
 The first and only fully-integrated microarray instrument for hands-free array processing GeneTitan Instrument Transform your lab with a GeneTitan Instrument and experience the unparalleled power of streamlining
Methods of Biomaterials Testing Lesson 3-5. Biochemical Methods - Molecular Biology -
 Methods of Biomaterials Testing Lesson 3-5 Biochemical Methods - Molecular Biology - Chromosomes in the Cell Nucleus DNA in the Chromosome Deoxyribonucleic Acid (DNA) DNA has double-helix structure The
Introduction to gene expression microarray data analysis
 Introduction to gene expression microarray data analysis Outline Brief introduction: Technology and data. Statistical challenges in data analysis. Preprocessing data normalization and transformation. Useful
Functional Genomics Overview RORY STARK PRINCIPAL BIOINFORMATICS ANALYST CRUK CAMBRIDGE INSTITUTE 18 SEPTEMBER 2017
 Functional Genomics Overview RORY STARK PRINCIPAL BIOINFORMATICS ANALYST CRUK CAMBRIDGE INSTITUTE 18 SEPTEMBER 2017 Agenda What is Functional Genomics? RNA Transcription/Gene Expression Measuring Gene
Microarray Technique. Some background. M. Nath
 Microarray Technique Some background M. Nath Outline Introduction Spotting Array Technique GeneChip Technique Data analysis Applications Conclusion Now Blind Guess? Functional Pathway Microarray Technique
Outline. Analysis of Microarray Data. Most important design question. General experimental issues
 Outline Analysis of Microarray Data Lecture 1: Experimental Design and Data Normalization Introduction to microarrays Experimental design Data normalization Other data transformation Exercises George Bell,
BTRY 7210: Topics in Quantitative Genomics and Genetics
 BTRY 7210: Topics in Quantitative Genomics and Genetics Jason Mezey Biological Statistics and Computational Biology (BSCB) Department of Genetic Medicine jgm45@cornell.edu January 29, 2015 Why you re here
Lecture #1. Introduction to microarray technology
 Lecture #1 Introduction to microarray technology Outline General purpose Microarray assay concept Basic microarray experimental process cdna/two channel arrays Oligonucleotide arrays Exon arrays Comparing
The 150+ Tomato Genome (re-)sequence Project; Lessons Learned and Potential
sequence Project; Lessons Learned and Potential") The 150+ Tomato Genome (re-)sequence Project; Lessons Learned and Potential Applications Richard Finkers Researcher Plant Breeding, Wageningen UR Plant Breeding, P.O. Box 16, 6700 AA, Wageningen, The Netherlands,
The 150+ Tomato Genome (re-)sequence Project; Lessons Learned and Potential Applications Richard Finkers Researcher Plant Breeding, Wageningen UR Plant Breeding, P.O. Box 16, 6700 AA, Wageningen, The Netherlands,
Microbial Metabolism Systems Microbiology
 1 Microbial Metabolism Systems Microbiology Ching-Tsan Huang ( 黃慶璨 ) Office: Agronomy Hall, Room 111 Tel: (02) 33664454 E-mail: cthuang@ntu.edu.tw MIT OCW Systems Microbiology aims to integrate basic biological
Analysis of Microarray Data
 Analysis of Microarray Data Lecture 1: Experimental Design and Data Normalization George Bell, Ph.D. Senior Bioinformatics Scientist Bioinformatics and Research Computing Whitehead Institute Outline Introduction
Introduction to BioMEMS & Medical Microdevices DNA Microarrays and Lab-on-a-Chip Methods
 Introduction to BioMEMS & Medical Microdevices DNA Microarrays and Lab-on-a-Chip Methods Companion lecture to the textbook: Fundamentals of BioMEMS and Medical Microdevices, by Prof., http://saliterman.umn.edu/
Humboldt Universität zu Berlin. Grundlagen der Bioinformatik SS Microarrays. Lecture
 Humboldt Universität zu Berlin Microarrays Grundlagen der Bioinformatik SS 2017 Lecture 6 09.06.2017 Agenda 1.mRNA: Genomic background 2.Overview: Microarray 3.Data-analysis: Quality control & normalization
Lecture 2: Biology Basics Continued
 Lecture 2: Biology Basics Continued Central Dogma DNA: The Code of Life The structure and the four genomic letters code for all living organisms Adenine, Guanine, Thymine, and Cytosine which pair A-T and
Runs of Homozygosity Analysis Tutorial
 Runs of Homozygosity Analysis Tutorial Release 8.7.0 Golden Helix, Inc. March 22, 2017 Contents 1. Overview of the Project 2 2. Identify Runs of Homozygosity 6 Illustrative Example...............................................
Mapping strategies for sequence reads
 Mapping strategies for sequence reads Ernest Turro University of Cambridge 21 Oct 2013 Quantification A basic aim in genomics is working out the contents of a biological sample. 1. What distinct elements
Enhancers mutations that make the original mutant phenotype more extreme. Suppressors mutations that make the original mutant phenotype less extreme
 Interactomics and Proteomics 1. Interactomics The field of interactomics is concerned with interactions between genes or proteins. They can be genetic interactions, in which two genes are involved in the
Welcome to the NGS webinar series
 Welcome to the NGS webinar series Webinar 1 NGS: Introduction to technology, and applications NGS Technology Webinar 2 Targeted NGS for Cancer Research NGS in cancer Webinar 3 NGS: Data analysis for genetic
less sensitive than RNA-seq but more robust analysis pipelines expensive but quantitiatve standard but typically not high throughput
 Chapter 11: Gene Expression The availability of an annotated genome sequence enables massively parallel analysis of gene expression. The expression of all genes in an organism can be measured in one experiment.
Agilent Genomic Workbench 7.0
 Agilent Genomic Workbench 7.0 Product Overview Guide Agilent Technologies Notices Agilent Technologies, Inc. 2012, 2015 No part of this manual may be reproduced in any form or by any means (including electronic
Feature Selection of Gene Expression Data for Cancer Classification: A Review
 Available online at www.sciencedirect.com ScienceDirect Procedia Computer Science 50 (2015 ) 52 57 2nd International Symposium on Big Data and Cloud Computing (ISBCC 15) Feature Selection of Gene Expression
Linking Genetic Variation to Important Phenotypes
 Linking Genetic Variation to Important Phenotypes BMI/CS 776 www.biostat.wisc.edu/bmi776/ Spring 2018 Anthony Gitter gitter@biostat.wisc.edu These slides, excluding third-party material, are licensed under
Next-Generation Sequencing Gene Expression Analysis Using Agilent GeneSpring GX
 Next-Generation Sequencing Gene Expression Analysis Using Agilent GeneSpring GX Technical Overview Introduction RNA Sequencing (RNA-Seq) is one of the most commonly used next-generation sequencing (NGS)
Gene Signal Estimates from Exon Arrays
 Gene Signal Estimates from Exon Arrays I. Introduction: With exon arrays like the GeneChip Human Exon 1.0 ST Array, researchers can examine the transcriptional profile of an entire gene (Figure 1). Being
Introduction to Genome Wide Association Studies 2014 Sydney Brenner Institute for Molecular Bioscience/Wits Bioinformatics Shaun Aron
 Introduction to Genome Wide Association Studies 2014 Sydney Brenner Institute for Molecular Bioscience/Wits Bioinformatics Shaun Aron Genotype calling Genotyping methods for Affymetrix arrays Genotyping
Analysis of Microarray Data
 Analysis of Microarray Data Lecture 1: Experimental Design and Data Normalization George Bell, Ph.D. Senior Bioinformatics Scientist Bioinformatics and Research Computing Whitehead Institute Outline Introduction
SIMS2003. Instructors:Rus Yukhananov, Alex Loguinov BWH, Harvard Medical School. Introduction to Microarray Technology.
 SIMS2003 Instructors:Rus Yukhananov, Alex Loguinov BWH, Harvard Medical School Introduction to Microarray Technology. Lecture 1 I. EXPERIMENTAL DETAILS II. ARRAY CONSTRUCTION III. IMAGE ANALYSIS Lecture
Estimating Cell Cycle Phase Distribution of Yeast from Time Series Gene Expression Data
 2011 International Conference on Information and Electronics Engineering IPCSIT vol.6 (2011) (2011) IACSIT Press, Singapore Estimating Cell Cycle Phase Distribution of Yeast from Time Series Gene Expression
BABELOMICS: Microarray Data Analysis
 BABELOMICS: Microarray Data Analysis Madrid, 21 June 2010 Martina Marbà mmarba@cipf.es Bioinformatics and Genomics Department Centro de Investigación Príncipe Felipe (CIPF) (Valencia, Spain) DNA Microarrays
measuring gene expression December 5, 2017
 measuring gene expression December 5, 2017 transcription a usually short-lived RNA copy of the DNA is created through transcription RNA is exported to the cytoplasm to encode proteins some types of RNA
Analysis of a Tiling Regulation Study in Partek Genomics Suite 6.6
 Analysis of a Tiling Regulation Study in Partek Genomics Suite 6.6 The example data set used in this tutorial consists of 6 technical replicates from the same human cell line, 3 are SP1 treated, and 3
Serial Analysis of Gene Expression
 Serial Analysis of Gene Expression Cloning of Tissue-Specific Genes Using SAGE and a Novel Computational Substraction Approach. Genomic (2001) Hung-Jui Shih Outline of Presentation SAGE EST Article TPE
Machine Learning Methods for RNA-seq-based Transcriptome Reconstruction
 Machine Learning Methods for RNA-seq-based Transcriptome Reconstruction Gunnar Rätsch Friedrich Miescher Laboratory Max Planck Society, Tübingen, Germany NGS Bioinformatics Meeting, Paris (March 24, 2010)
SNP calling and VCF format
 SNP calling and VCF format Laurent Falquet, Oct 12 SNP? What is this? A type of genetic variation, among others: Family of Single Nucleotide Aberrations Single Nucleotide Polymorphisms (SNPs) Single Nucleotide
Applications and Uses. (adapted from Roche RealTime PCR Application Manual)
") What Can You Do With qpcr? Applications and Uses (adapted from Roche RealTime PCR Application Manual) What is qpcr? Real time PCR also known as quantitative PCR (qpcr) measures PCR amplification as it
What Can You Do With qpcr? Applications and Uses (adapted from Roche RealTime PCR Application Manual) What is qpcr? Real time PCR also known as quantitative PCR (qpcr) measures PCR amplification as it
Multiple Traits & Microarrays
 Multiple Traits & Microarrays 1. why study multiple traits together? 2-10 diabetes case study 2. design issues 11-13 selective phenotyping 3. why are traits correlated? 14-17 close linkage or pleiotropy?
Introduction to the UCSC genome browser
 Introduction to the UCSC genome browser Dominik Beck NHMRC Peter Doherty and CINSW ECR Fellow, Senior Lecturer Lowy Cancer Research Centre, UNSW and Centre for Health Technology, UTS SYDNEY NSW AUSTRALIA
RNA Sequencing Analyses & Mapping Uncertainty
 RNA Sequencing Analyses & Mapping Uncertainty Adam McDermaid 1/26 RNA-seq Pipelines Collection of tools for analyzing raw RNA-seq data Tier 1 Quality Check Data Trimming Tier 2 Read Alignment Assembly
Technical note: Molecular Index counting adjustment methods
 Technical note: Molecular Index counting adjustment methods By Jue Fan, Jennifer Tsai, Eleen Shum Introduction. Overview of BD Precise assays BD Precise assays are fast, high-throughput, next-generation
Mixed effects model for assessing RNA degradation in Affymetrix GeneChip experiments
 Mixed effects model for assessing RNA degradation in Affymetrix GeneChip experiments Kellie J. Archer, Ph.D. Suresh E. Joel Viswanathan Ramakrishnan,, Ph.D. Department of Biostatistics Virginia Commonwealth
Measuring transcriptomes with RNA-Seq
 Measuring transcriptomes with RNA-Seq BMI/CS 776 www.biostat.wisc.edu/bmi776/ Spring 2017 Anthony Gitter gitter@biostat.wisc.edu These slides, excluding third-party material, are licensed under CC BY-NC
Chapter 15 Gene Technologies and Human Applications
 Chapter Outline Chapter 15 Gene Technologies and Human Applications Section 1: The Human Genome KEY IDEAS > Why is the Human Genome Project so important? > How do genomics and gene technologies affect
QIAGEN s NGS Solutions for Biomarkers NGS & Bioinformatics team QIAGEN (Suzhou) Translational Medicine Co.,Ltd
 Translational Medicine Co.,Ltd") QIAGEN s NGS Solutions for Biomarkers NGS & Bioinformatics team QIAGEN (Suzhou) Translational Medicine Co.,Ltd 1 Our current NGS & Bioinformatics Platform 2 Our NGS workflow and applications 3 QIAGEN s
QIAGEN s NGS Solutions for Biomarkers NGS & Bioinformatics team QIAGEN (Suzhou) Translational Medicine Co.,Ltd 1 Our current NGS & Bioinformatics Platform 2 Our NGS workflow and applications 3 QIAGEN s
Outline and learning objectives. From Proteomics to Systems Biology. Integration of omics - information
 From to Systems Biology Outline and learning objectives Omics science provides global analysis tools to study entire systems How to obtain omics - What can we learn Limitations Integration of omics - In-class
Stefano Monti. Workshop Format
 Gad Getz Stefano Monti Michael Reich {gadgetz,smonti,mreich}@broad.mit.edu http://www.broad.mit.edu/~smonti/aws Broad Institute of MIT & Harvard October 18-20, 2006 Cambridge, MA Workshop Format Morning
Midterm 1 Results. Midterm 1 Akey/ Fields Median Number of Students. Exam Score
 Midterm 1 Results 10 Midterm 1 Akey/ Fields Median - 69 8 Number of Students 6 4 2 0 21 26 31 36 41 46 51 56 61 66 71 76 81 86 91 96 101 Exam Score Quick review of where we left off Parental type: the
Gene-Level Analysis of Exon Array Data using Partek Genomics Suite 6.6
 Gene-Level Analysis of Exon Array Data using Partek Genomics Suite 6.6 Overview This tutorial will demonstrate how to: Summarize core exon-level data to produce gene-level data Perform exploratory analysis
Goals of pharmacogenomics
 Goals of pharmacogenomics Use drugs better and use better drugs! People inherit/exhibit differences in drug: Absorption Metabolism and degradation of the drug Transport of drug to the target molecule Excretion
Advanced Bioinformatics Biostatistics & Medical Informatics 776 Computer Sciences 776 Spring 2018
 Advanced Bioinformatics Biostatistics & Medical Informatics 776 Computer Sciences 776 Spring 2018 Anthony Gitter gitter@biostat.wisc.edu www.biostat.wisc.edu/bmi776/ These slides, excluding third-party
Péter Antal Ádám Arany Bence Bolgár András Gézsi Gergely Hajós Gábor Hullám Péter Marx András Millinghoffer László Poppe Péter Sárközy BIOINFORMATICS
 Péter Antal Ádám Arany Bence Bolgár András Gézsi Gergely Hajós Gábor Hullám Péter Marx András Millinghoffer László Poppe Péter Sárközy BIOINFORMATICS The Bioinformatics book covers new topics in the rapidly
RNA-Seq with the Tuxedo Suite
 RNA-Seq with the Tuxedo Suite Monica Britton, Ph.D. Sr. Bioinformatics Analyst September 2015 Workshop The Basic Tuxedo Suite References Trapnell C, et al. 2009 TopHat: discovering splice junctions with
China National Grid --- BioNode. Jun Wang Beijing Genomics Institute
 China National Grid --- BioNode Jun Wang Beijing Genomics Institute Core of life science and bio-tech: Getting, Mining, Applying the basic life information Old China meets New China? Sequencing, sequencing,
Complementary Technologies for Precision Genetic Analysis
 Complementary NGS, CGH and Workflow Featured Publication Zhu, J. et al. Duplication of C7orf58, WNT16 and FAM3C in an obese female with a t(7;22)(q32.1;q11.2) chromosomal translocation and clinical features
Please purchase PDFcamp Printer on to remove this watermark. DNA microarray
 DNA microarray Example of an approximately 40,000 probe spotted oligo microarray with enlarged inset to show detail. A DNA microarray is a multiplex technology used in molecular biology. It consists of
Cancer Genetics Solutions
 Cancer Genetics Solutions Cancer Genetics Solutions Pushing the Boundaries in Cancer Genetics Cancer is a formidable foe that presents significant challenges. The complexity of this disease can be daunting
6. GENE EXPRESSION ANALYSIS MICROARRAYS
 6. GENE EXPRESSION ANALYSIS MICROARRAYS BIOINFORMATICS COURSE MTAT.03.239 16.10.2013 GENE EXPRESSION ANALYSIS MICROARRAYS Slides adapted from Konstantin Tretyakov s 2011/2012 and Priit Adlers 2010/2011
Introduction to Genome Wide Association Studies 2015 Sydney Brenner Institute for Molecular Bioscience Shaun Aron
 Introduction to Genome Wide Association Studies 2015 Sydney Brenner Institute for Molecular Bioscience Shaun Aron Many sources of technical bias in a genotyping experiment DNA sample quality and handling
Next Generation Sequencing. Target Enrichment
 Next Generation Sequencing Target Enrichment Next Generation Sequencing Your Partner in Every Step from Sample to Data NGS: Revolutionizing Genetic Analysis with Single-Molecule Resolution Next generation
You will need genotypes for up to 100 SNPs, and you must also have the Affymetrix CEL files available for import.
 SNP Cluster Plots Author: Greta Linse Peterson, Golden Helix, Inc. Overview This function creates scatter plots based on A and B allele intensities that can be split on SNP genotypes to create tri-colored
CS 5984: Application of Basic Clustering Algorithms to Find Expression Modules in Cancer
 CS 5984: Application of Basic Clustering Algorithms to Find Expression Modules in Cancer T. M. Murali January 31, 2006 Innovative Application of Hierarchical Clustering A module map showing conditional
Multi-omics in biology: integration of omics techniques
 31/07/17 Летняя школа по биоинформатике 2017 Multi-omics in biology: integration of omics techniques Konstantin Okonechnikov Division of Pediatric Neurooncology German Cancer Research Center (DKFZ) 2 Short
Next-Generation Sequencing. Technologies
 Next-Generation Next-Generation Sequencing Technologies Sequencing Technologies Nicholas E. Navin, Ph.D. MD Anderson Cancer Center Dept. Genetics Dept. Bioinformatics Introduction to Bioinformatics GS011062
DNA Microarray Data Oligonucleotide Arrays
 DNA Microarray Data Oligonucleotide Arrays Sandrine Dudoit, Robert Gentleman, Rafael Irizarry, and Yee Hwa Yang Bioconductor Short Course 2003 Copyright 2002, all rights reserved Biological question Experimental
DNA Arrays Affymetrix GeneChip System
 DNA Arrays Affymetrix GeneChip System chip scanner Affymetrix Inc. hybridization Affymetrix Inc. data analysis Affymetrix Inc. mrna 5' 3' TGTGATGGTGGGAATTGGGTCAGAAGGACTGTGGGCGCTGCC... GGAATTGGGTCAGAAGGACTGTGGC
From DNA to Protein: Genotype to Phenotype
 12 From DNA to Protein: Genotype to Phenotype 12.1 What Is the Evidence that Genes Code for Proteins? The gene-enzyme relationship is one-gene, one-polypeptide relationship. Example: In hemoglobin, each
Recombinant DNA Technology. The Role of Recombinant DNA Technology in Biotechnology. yeast. Biotechnology. Recombinant DNA technology.
 PowerPoint Lecture Presentations prepared by Mindy Miller-Kittrell, North Carolina State University C H A P T E R 8 Recombinant DNA Technology The Role of Recombinant DNA Technology in Biotechnology Biotechnology?
TEKS 5C describe the roles of DNA, ribonucleic acid (RNA), and environmental factors in cell differentiation
, and environmental factors in cell differentiation") TEKS 5C describe the roles of DNA, ribonucleic acid (RNA), and environmental factors in cell differentiation 1. Unicellular organisms carry out all the necessary life processes in one cell. In multicellular
TEKS 5C describe the roles of DNA, ribonucleic acid (RNA), and environmental factors in cell differentiation 1. Unicellular organisms carry out all the necessary life processes in one cell. In multicellular
Axiom mydesign Custom Array design guide for human genotyping applications
 TECHNICAL NOTE Axiom mydesign Custom Genotyping Arrays Axiom mydesign Custom Array design guide for human genotyping applications Overview In the past, custom genotyping arrays were expensive, required
What we ll do today. Types of stem cells. Do engineered ips and ES cells have. What genes are special in stem cells?
 Do engineered ips and ES cells have similar molecular signatures? What we ll do today Research questions in stem cell biology Comparing expression and epigenetics in stem cells asuring gene expression
Examination Assignments
 Bioinformatics Institute of India H-109, Ground Floor, Sector-63, Noida-201307, UP. INDIA Tel.: 0120-4320801 / 02, M. 09818473366, 09810535368 Email: info@bii.in, Website: www.bii.in INDUSTRY PROGRAM IN
Engineering Genetic Circuits
 Engineering Genetic Circuits I use the book and slides of Chris J. Myers Lecture 0: Preface Chris J. Myers (Lecture 0: Preface) Engineering Genetic Circuits 1 / 19 Samuel Florman Engineering is the art
Exploration, Normalization, Summaries, and Software for Affymetrix Probe Level Data
 Exploration, Normalization, Summaries, and Software for Affymetrix Probe Level Data Rafael A. Irizarry Department of Biostatistics, JHU March 12, 2003 Outline Review of technology Why study probe level
Nature Methods: doi: /nmeth.4396
 Supplementary Figure 1 Comparison of technical replicate consistency between and across the standard ATAC-seq method, DNase-seq, and Omni-ATAC. (a) Heatmap-based representation of ATAC-seq quality control
American Society of Cytopathology Core Curriculum in Molecular Biology
 American Society of Cytopathology Core Curriculum in Molecular Biology American Society of Cytopathology Core Curriculum in Molecular Biology Chapter 3 Molecular Techniques Separation and Detection, Part
Identifying Signaling Pathways. BMI/CS 776 Spring 2016 Anthony Gitter
 Identifying Signaling Pathways BMI/CS 776 www.biostat.wisc.edu/bmi776/ Spring 2016 Anthony Gitter gitter@biostat.wisc.edu Goals for lecture Challenges of integrating high-throughput assays Connecting relevant
Do engineered ips and ES cells have similar molecular signatures?
 Do engineered ips and ES cells have similar molecular signatures? Comparing expression and epigenetics in stem cells George Bell, Ph.D. Bioinformatics and Research Computing 2012 Spring Lecture Series