Capillary Electrophoresis of Proteins with Selective On-line Affinity Monoliths
|
|
|
- Camilla Turner
- 5 years ago
- Views:
Transcription

. All Theses and Dissertations. 819. https://scholarsarchive.byu.edu/etd/819 This Dissertation is brought to you for free and open access by BYU ScholarsArchive.")
1 Brigham Young University BYU ScholarsArchive All Theses and Dissertations Capillary Electrophoresis of Proteins with Selective On-line Affinity Monoliths Jenny Marcela Armenta Blanco Brigham Young University - Provo Follow this and additional works at: Part of the Biochemistry Commons, and the Chemistry Commons BYU ScholarsArchive Citation Armenta Blanco, Jenny Marcela, "Capillary Electrophoresis of Proteins with Selective On-line Affinity Monoliths" (2006). All Theses and Dissertations This Dissertation is brought to you for free and open access by BYU ScholarsArchive. It has been accepted for inclusion in All Theses and Dissertations by an authorized administrator of BYU ScholarsArchive. For more information, please contact scholarsarchive@byu.edu, ellen_amatangelo@byu.edu.
2 CAPILLARY ELECTROPHORESIS OF PROTEINS WITH SELECTIVE ON- LINE AFFINITY MONOLITHS by Jenny Marcela Armenta Blanco A dissertation submitted to the faculty of Brigham Young University In partial fulfillment of the requirements for the degree of Doctor of Philosophy Department of Chemistry and Biochemistry Brigham Young University December 2006
3 BRIGHAM YOUNG UNIVERSITY GRADUATE COMMITTEE APROVAL of a dissertation submitted by Jenny Marcela Armenta Blanco This dissertation has been read by each member of the following graduate committee and by majority vote has been found to be satisfactory. Date Milton L. Lee, Chair Date Paul B. Farnsworth Date Adam T. Woolley Date John D. Lamb Date Steven W. Graves
4 BRIGHAM YOUNG UNIVERSITY As chair of the candidate s graduate committee, I have read the dissertation of Jenny Marcela Armenta Blanco in its final form and have found that (1) its format, citation, and bibliographical style are consistent and acceptable and fulfill university and department style requirements; (2) its illustrated materials including figures, tables, and charts are in place; and (3) the final manuscript is satisfactory to the graduate committee and is ready for submission the university library. Date Milton L. Lee Chair, Graduate Committee Accepted for the Department David V. Dearden Graduate Coordinator Accepted for the College Thomas W. Sederberg Associate Dean, College of Physical and Mathematical Sciences
5 ABSTRACT CAPILLARY ELECTROPHORESIS OF PROTEINS WITH SELECTIVE ON- LINE AFFINITY MONOLITHS Jenny Marcela Armenta Blanco Department of Chemistry and Biochemistry Doctor of Philosophy The analysis of proteins in biological fluids by capillary electrophoresis (CE) is of interest in clinical chemistry. However, due to low analyte concentrations and poor concentration limits of detection (CLOD), protein analysis by this technique is frequently challenging. Coupling preconcentration techniques with CE greatly improves the CLOD. An on-line preconcentration-ce method that can selectively preconcentrate any protein for which an antibody is available would be very useful for the analysis of low abundance proteins and would establish CE as a major tool in biomarker discovery. To accomplish this, an on-line protein G monolithic preconcentrator CE system for enrichment and separation of proteins was developed. This system proved effective for on-line sample extraction, clean-up, preconcentration, and CE of IgG in human serum. IgG from diluted (500 and 65,000 times) human serum samples was successfully analyzed using this system. The approach can be applied to the on-line preconcentration and analysis of any protein for which an antibody is available. The desire to separate all proteins present in human tissues, cells and biological fluids has challenged the separation research community for many years. The difficulty
6 of this task resides in the complexity of the sample. Blood serum, for instance, may express up to 10,000 proteins with an estimated dynamic range of 9 orders of magnitude. Additionally, most of these proteins are present at very low concentrations (ng/ml). Identification and quantification of low abundance proteins is hindered by the presence of high abundance proteins, such as human serum albumin (HSA) and immunoglobulins (IgG). Therefore, in most cases, removal of the high abundance proteins or enrichment of low abundance proteins is necessary prior to the analysis of low abundance proteins. To address this, a coupled affinity-hydropobic monolithic column for the simultaneous removal of IgG, preconcentration of low abundance proteins, and separation by capillary zone electrophoresis was designed. The system proved to be very reproducible. The runto-run %RSD values for migration time and peak area were less than 5%, which is typical of CE. Finally, a new method was developed to prepare monoliths with anion exchange functionality. Polymer monoliths were prepared by in situ polymerization of methacrylate monomers. The monoliths were coated with a water soluble polymer and used for the analysis of proteins. Using this approach, a model monolith was prepared. Subsequent coating yielded a monolith with quaternary ammonium groups on the surface, which was confirmed by strong anodic electroosmotic flow. Analysis of standard proteins by ion exchange LC and CEC was demonstrated. This simple and rapid method for surface modification opened new avenues for the preparation of monoliths with a broad range of functionalities.
7 ACKNOWLEDGEMENTS I am really grateful that I had the opportunity to have Dr. Milton L. Lee as my PhD advisor. Working under his supervision has been an invaluable experience. His hard work, determination, commitment to the advancement of science, and kindness has been very inspiring to me. I thank him for his patience, encouragement, and clever suggestions during my five-year doctoral research. I am also very grateful to my graduate committee members, Dr. Graves, Dr. Farnsworth, Dr. Woolley, Dr. Lamb, and Dr. Thulin for their valuable recommendations. I would like to give especial thanks to Dr. Elena Stashenko, my undergraduate advisor in Colombia. Her mentoring, trust, encouragement, and kind support paved the way for my coming to this wonderful university. I highly appreciate Dr. Watt s friendship and generosity. His smile and kind comments filled my heart with great joy many times. Susan Tachka and Robert Hallock are acknowledged for their high quality service, support, and friendship. I am very pleased with my lab mates, Shu-lin Ling, Yansheng Liu, Li Zhou, Binghe Gu, Nosa Agbonkonkon, Miao Wang, Yan Fang, Yun Li, Yuanyuan Li, Jesse Contreras, Jacoline Murray, John Edwards, and Tai Van Truong. Their enthusiasm, happiness, good hearts, and commitment to research provide the lab with a nice environment, where anybody would feel welcome and prompted to work. I also thank my close friends (e.g., Hernan Fuentes) whose names are too many to list. Their friendship made my staying in this country, away from my family and loved ones, much more pleasant than it would have been without them. I very much appreciate the good influence that Aaron Nicholas Nackos has had in my life. His friendship, support, teachings, and companionship have
8 meant a lot to me. I was also supported by my mother, Myriam Blanco, my Father, Carlos Armenta, my second mother, Mabel Melo, my brothers and sisters, especially Monica, and many other loved ones in Colombia. Finally, I am indebted to the Department of Chemistry and Biochemistry at Brigham Young University for giving me the opportunity to pursue a PhD degree. The financial support from the National Institutes of Health is also gratefully acknowledged.
9 TABLE OF CONTENTS TABLE OF CONTENTS... VIII LIST OF FIGURES...XII LIST OF TABLES... XVI 1 INTRODUCTION PROTEOMICS PREFRACTIONATION AND SEPARATION TECHNOLOGY FOR PROTEOMICS BIOMARKER DISCOVERY CAPILLARY ELECTROPHORESIS AND ITS APPLICATION TO PROTEIN ANALYSIS Capillary Electrophoresis Fundamentals Capillary Electrophoresis for Protein Analysis AFFINITY CHROMATOGRAPHY IN PROTEOMICS ENZYMATIC ASSAYS FOR PROTEIN IDENTIFICATION POROUS MONOLITHS AND THEIR APPLICATION TO PROTEOMICS Monolith Generalities Monolith Application to Proteomics DETECTION TECHNIQUES CAPILLARY ELECTROPHORESIS-MASS SPECTROMETRY IN PROTEOMICS MODERN TRENDS IN PROTEOMICS DISSERTATION OVERVIEW REFERENCES DESIGN AND EVALUATION OF A COUPLED MONOLITHIC PRECONCENTRATOR- CAPILLARY ZONE ELECTROPHORESIS SYSTEM FOR THE EXTRACTION OF IGG FROM HUMAN SERUM INTRODUCTION EXPERIMENTAL...52 viii
10 2.2.1 Chemicals Capillary zone electrophoresis Monolithic preconcentrator design and evaluation Scanning electron microscopy (SEM) Porous properties Capillary liquid chromatography On-line preconcentration-cze of IgG On-line extraction and preconcentration of IgG from human serum RESULTS AND DISCUSSION Monolithic preconcentrator design and evaluation Method development for on-line preconcentration-ce of IgG Application of the monolithic preconcentrator to a human serum sample CONCLUSIONS REFERENCES COUPLED AFFINITY-HYDROPHOBIC MONOLITHIC COLUMN FOR ON-LINE REMOVAL OF IGG, PRECONCENTRATION OF LOW ABUNDANCE PROTEINS, AND SEPARATION BY CAPILLARY ZONE ELECTROPHORESIS INTRODUCTION EXPERIMENTAL Chemicals Capillary zone electrophoresis Fabrication of monolithic preconcentrators Scanning electron microscopy (SEM) On-line preconcentration-cze of standard proteins Fabrication of protein G monolithic columns for removal of IgG Coupling of protein G monolithic columns to hydrophobic monolithic preconcentrator-ce columns for on-line removal of IgG, followed by preconcentration of standard proteins and separation by CE...86 ix
11 3.3 RESULTS AND DISCUSSION Monolithic preconcentrator Concentration and elution of proteins Effect of the composition of sample buffer on preconcentration On-line preconcentration-cze of standard proteins Saturation curve for the monolithic preconcentrator Reproducibilities of migration times and peak areas of standard proteins Coupled protein G monolithic column-hydrophobic monolithic preconcentrator for removal of IgG, preconcentration of standard proteins, and separation by CE CONCLUSIONS REFERENCES POLYMERIC MONOLITHIC COLUMNS COATED WITH POLYELECTROLYTE LAYERS FOR PROTEIN ANALYSIS INTRODUCTION EXPERIMENTAL Chemicals Fabrication of coated polymeric monolithic columns Capillary electrochromatography Capillary liquid chromatography RESULTS AND DISCUSSION Fabrication of coated polymeric monolithic columns Strong anion exchange LC and CEC of protein standards CONCLUSIONS REFERENCES FUTURE RESEARCH POTENTIAL APPLICATION OF THE PROTEIN G MONOLITHIC PRECONCENTRATOR IN PROTEOMICS RESEARCH x
12 5.2 IMPROVEMENTS IN THE COUPLED MONOLITHIC SYSTEM FOR SIMULTANEOUS REMOVAL OF HIGH ABUNDANCE PROTEINS, PRECONCENTRATION OF LOW ABUNDANCE PROTEINS AND SEPARATION BY CAPILLARY ZONE ELECTROPHORESIS COATED POLYMERIC MONOLITHIC COLUMN FOR PROTEIN ANALYSIS REFERENCES xi
13 LIST OF FIGURES FIGURE 2.1 INFLUENCE OF MONOLITH FORMULATION ON BINDING CAPACITY. EXPERIMENTAL CONDITIONS: 20 CM (15 CM TO DETECTOR) X 75 µm I.D. FUSED SILICA CAPILLARY; 2 CM PROTEIN G MONOLITHIC PRECONCENTRATOR; 2 MM HCL (0.5 µl/min) ELUTION BUFFER; UV DETECTION AT 214 NM; 300 µg/ml IGG SAMPLE; 1 µl/min SAMPLE LOADING FLOW RATE; 15 MIN SAMPLE LOADING TIME. THE FORMULAS (1,2,3) FOR ALL OF THE MONOLITHS ARE LISTED IN TABLE FIGURE 2.2. PORE SIZE DISTRIBUTION OF GMA MONOLITHIC ROD 2 MEASURED BY MERCURY INTRUSION POROSIMETRY...65 FIGURE 2.3. SEM IMAGE OF A GMA MONOLITH INSIDE A CAPILLARY COLUMN...66 FIGURE 2.4. INFLUENCE OF SPEED OF SAMPLE APPLICATION ON PEAK AREA OF RETAINED IGG. EXPERIMENTAL CONDITIONS: 20 CM (15 CM TO DETECTOR) X 75 µm I.D. FUSED SILICA CAPILLARY; 2 CM PROTEIN G MONOLITHIC PRECONCENTRATOR; 20 MM HCL (0.5 µl/min) ELUTION BUFFER; UV DETECTION AT 214 NM; 300 µg/ml IGG SAMPLE; µl/min SAMPLE LOADING FLOW RATE; 15 µl SAMPLE VOLUME LOADED FIGURE 2.5. BASELINE MONITORING OF THE AFFINITY LC EXPERIMENT WITH IGG AS SAMPLE SOLUTION TO TEST THE NON-SPECIFIC ADSORPTION OF PROTEIN ON THE SURFACE DEACTIVATED FUSED SILICA CAPILLARY. EXPERIMENTAL CONDITIONS: 75 CM (64 CM TO DETECTOR) X 75 µm I.D. FUSED SILICA CAPILLARY; 2 CM PROTEIN G MONOLITHIC PRECONCENTRATOR. THE COLUMN WAS FLUSHED WITH THE BINDING BUFFER (PBS) FOR 10 MIN AT 1 BAR, AFTER WHICH A 100 µg/ml IGG SOLUTION WAS INJECTED FOR 20 MIN AT 1 BAR. AFTER INJECTION, THE COLUMN WAS FLUSHED CONSECUTIVELY WITH BINDING BUFFER (PBS), SEPARATION BUFFER AND AN ELUTION BUFFER FOR 10 MIN EACH AT 1 BAR. MONOLITHIC PRECONCENTRATOR WITHOUT PROTEIN G: (A) γ- MPTS TREATED CAPILLARY, (B) POLYBRENE COATED CAPILLARY FIGURE 2.6. ELECTROPHEROGRAM OF IGG DEMONSTRATING THE REVERSAL OF THE EOF UPON CASTING A GMA MONOLITH INSIDE A POLYBRENE COATED FUSED SILICA CAPILLARY. EXPERIMENTAL CONDITIONS: 70 CM (57 CM TO DETECTOR) X 75 µm I.D. FUSED SILICA CAPILLARY; NEUTRAL MARKER (DMSO) AS SAMPLE; 50 MM AMMONIUM FORMATE-FORMIC ACID (PH 7.6) SEPARATION BUFFER; UV xii
14 DETECTION AT 214 NM. (A) POLYBRENE COATED CAPILLARY, -15 KV APPLIED SEPARATION VOLTAGE, (B) 1.5 CM GMA MONOLITH CAST INSIDE A POLYBRENE COATED CAPILLARY, +15 KV APPLIED SEPARATION VOLTAGE...71 FIGURE 2.7. SCHEMATIC REPRESENTATION OF THE STEPS OF ON-LINE-PRECONCENTRATION-CE OF IGG. (A) SAMPLE INJECTION FOLLOWING PRECONDITIONING OF THE PROTEIN G-MONOLITHIC PRECONCENTRATOR CAPILLARY WITH 50 MM AMMONIUM FORMATE-FORMIC ACID (PH 7.6), (B) REMOVAL OF UNBOUND PROTEINS AND PRECONDITIONING OF THE PRECONCENTRATOR WITH 12.5 MM AMMONIUM FORMATE-FORMIC ACID (PH 7.6), (C) DESORPTION OF TRAPPED IGG WITH 50 MM FORMIC ACID, (D) INJECTION OF A PLUG OF 12.5 MM AMMONIUM FORMATE-FORMIC ACID (PH 7.6), (E) ELECTROPHORESIS. ( ) IGG, ( ) OTHER PROTEINS FIGURE 2.8. TYPICAL ELECTROPHEROGRAMS OF THE ON-LINE PRECONCENTRATION-CE OF IGG STANDARD. EXPERIMENTAL CONDITIONS: 64 CM (53 CM TO DETECTOR) X 75 µm I.D. FUSED SILICA CAPILLARY; 1.5 CM PROTEIN G MONOLITHIC PRECONCENTRATOR; 50 MM FORMIC ACID (1.0 BAR, 0.3 MIN) ELUTION BUFFER; 12.5 MM AMMONIUM FORMATE-FORMIC ACID (PH 7.6) SEPARATION BUFFER; +15 KV APPLIED SEPARATION VOLTAGE; UV DETECTION AT 214 NM. (A) 120 NM IGG SOLUTION, (B) 12 NM IGG SOLUTION FIGURE 2.9. ELECTROPHEROGRAMS DEMONSTRATING ON-LINE PRECONCENTRATION-CE OF IGG FROM HUMAN SERUM. EXPERIMENTAL CONDITIONS: 64 CM (53 CM TO DETECTOR) X 75 µm I.D. FUSED SILICA CAPILLARY; 1.5 CM PROTEIN G MONOLITHIC PRECONCENTRATOR; 50 MM FORMIC ACID (1.0 BAR, 0.3 MIN) ELUTION BUFFER; 12.5 MM AMMONIUM FORMATE-FORMIC ACID (PH 7.6) SEPARATION BUFFER; +15 KV APPLIED SEPARATION VOLTAGE; UV DETECTION AT 214 NM. (A) 500 TIMES DILUTED HUMAN SERUM (~ 6 µl VOLUME SAMPLED), (B) 65,000 TIMES DILUTED HUMAN SERUM (~ 28 µl VOLUME SAMPLED) FIGURE 3.1. SEM OF A BUMA-CO-EDMA MONOLITH IN A CAPILLARY COLUMN FIGURE 3.2. ELECTROPHEROGRAMS SHOWING THE EFFECT OF SAMPLE BUFFER COMPOSITION ON PRECONCENTRATION. EXPERIMENTAL CONDITIONS: 70 CM (59 CM TO DETECTOR) X 75 ΜM I.D. FUSED SILICA CAPILLARY; 1 CM BUMA-CO-EDMA MONOLITH; 70% ACN IN 0.1% TFA ELUTION BUFFER (700 MBAR, 0.1 MIN); 50 MM TRIS-PHOSPHATE (PH 3.0) SEPARATION BUFFER; + 25 KV APPLIED xiii
15 VOLTAGE; 120 NM LYSOZYME (~ 7 ΜL VOLUME SAMPLED). (A) H 2 O, (B) 50 MM AMMONIUM FORMATE-FORMIC ACID (PH 7.6), (C) 50 MM AMMONIUM FORMATE-FORMIC ACID (PH 7.6) AND 0.9 M AMMONIUM SULFATE...92 FIGURE 3.3. ON-LINE PRECONCENTRATION-CZE OF A 20 NM LYSOZYME SOLUTION. EXPERIMENTAL CONDITIONS: 70 CM (59 CM TO DETECTOR) X 75 µm I.D. FUSED SILICA CAPILLARY; 1 CM BUMA-CO- EDMA MONOLITH; 70% ACN IN 0.1% TFA ELUTION BUFFER (700 MBAR, 0.1 MIN); 50 MM TRIS- PHOSPHATE (PH 3.0) SEPARATION BUFFER; + 25 KV APPLIED VOLTAGE; 20 NM LYSOZYME (~ 24 ΜL VOLUME SAMPLED)...93 FIGURE 3.4. ON-LINE PRECONCENTRATION-CZE OF STANDARD PROTEINS. EXPERIMENTAL CONDITIONS: 70 CM X 75 μm I.D. FUSED SILICA CAPILLARY; 1 CM BUMA-CO-EDMA MONOLITH; 70% ACN IN 0.1% TFA ELUTION BUFFER (700 MBAR, 0.1 MIN); 50 MM TRIS-PHOSPHATE (PH 3.0) SEPARATION BUFFER; + 25 KV APPLIED VOLTAGE; 400 NM CYTOCHROME C, 35 NM LYSOZYME AND 250 NM TRYPSINOGEN A (~ 12 μl VOLUME SAMPLED). (1) CYTOCHROME C, (2) LYSOZYME, (3,4) TRYPSINOGEN A...94 FIGURE 3.5. SATURATION CURVE FOR THE MONOLITHIC PRECONCENTRATOR...96 FIGURE 3.6. AFFINITY LC EXPERIMENT TO TEST THE NON-SPECIFIC ADSORPTION OF PROTEINS OTHER THAN IGG ON THE PROTEIN G MONOLITHIC COLUMN. EXPERIMENTAL CONDITIONS: 70 CM (59 CM TO DETECTOR) X 75 μm I.D. FUSED SILICA CAPILLARY; 1 CM PROTEIN G MONOLITH. THE COLUMN WAS FLUSHED CONSECUTIVELY WITH BINDING BUFFER (1 BAR, 7 MIN), PROTEIN SOLUTION (1 BAR, 12 MIN), AND BINDING BUFFER (1 BAR, 7 MIN). A PLUG (1 BAR, 0.25 MIN) OF 50 MM FORMIC ACID (ELUTION BUFFER 1 TO DISRUPT THE PROTEIN G-IGG INTERACTION) WAS INJECTED FOLLOWED BY SEPARATION BUFFER (1 BAR, 6 MIN). A PLUG (1 BAR, 0.25 MIN) OF 70% ACN IN 0.1% TFA (ELUTION BUFFER 2 TO DISRUPT HYDROPHOBIC INTERACTIONS) WAS INJECTED FOLLOWED BY SEPARATION BUFFER (1 BAR, 6 MIN). (A) CYTOCHROME C, LYSOZYME AND TRYPSINOGEN A. (B) IGG, CYTOCHROME C, LYSOZYME AND TRYPSINOGEN A...99 FIGURE 3.7. SCHEMATIC OF THE COUPLED PROTEIN G MONOLITHIC COLUMN-HYDROPHOBIC MONOLITHIC PRECONCENTRATOR FOR REMOVAL OF IGG, PRECONCENTRATION OF STANDARD PROTEINS, AND SEPARATION BY CE xiv
16 FIGURE 3.8. ELECTROPHEROGRAM RESULTING FROM ON-LINE REMOVAL OF IGG, PRECONCENTRATION OF STANDARD PROTEINS, AND SEPARATION BY CE. EXPERIMENTAL CONDITIONS: 25 CM X 250 ΜM I.D. PROTEIN G MONOLITHIC COLUMN COUPLED TO 1 CM BUMA-CO-EDMA MONOLITH CAST IN A 70 CM (59 CM TO DETECTOR) X 75 μm I.D. FUSED SILICA CAPILLARY; 70% ACN IN 0.1% TFA ELUTION BUFFER (700 MBAR, 0.1 MIN); 50 MM TRIS-PHOSPHATE (PH 3.0) SEPARATION BUFFER; + 25 KV APPLIED VOLTAGE; 5 μg/ml CYTOCHROME C; 5 μg/ml LYSOZYME AND 100 μg/ml IGG. (1) CYTOCHROME C, (2) LYSOZYME FIGURE 4.1. SEM IMAGE OF A POLY(AMPS-CO-EDMA) MONOLITH IN A CAPILLARY COLUMN FIGURE 4.2. REVERSAL OF EOF AFTER MODIFYING THE SURFACE OF A MONOLITH WITH POLYBRENE. EXPERIMENTAL CONDITIONS: 60 CM (50 CM DETECTION WINDOW) X 75 µm I.D. FUSED SILICA CAPILLARY; DMSO NEUTRAL MARKER; -10 KV (0.07 MIN) ELECTROKINETIC INJECTION; 10 MM PHOSPHATE (PH 5.0) SEPARATION BUFFER; UV DETECTION AT 214 NM. (A) AMPS-CO-EDMA MONOLITH; + 25 KV APPLIED VOLTAGE. (B) AMPS-CO-EDMA MONOLITH COATED WITH POLYBRENE; -25 KV APPLIED VOLTAGE FIGURE 4.3. EOF VELOCITY VERSUS PH. EXPERIMENTAL CONDITIONS: 60 CM (50 CM DETECTION WINDOW) X 75 µm I.D. FUSED SILICA CAPILLARY; DMSO NEUTRAL MARKER; -10 KV (0.07 MIN) ELECTROKINETIC INJECTION; 10 MM PHOSPHATE (PH VARIED BETWEEN 3-6) SEPARATION BUFFER; -25 KV APPLIED VOLTAGE; UV DETECTION AT 214 NM. AMPS-CO-EDMA MONOLITH COATED WITH POLYBRENE FIGURE 4.4. ISOCRATIC CEC OF STANDARD OVALBUMIN. EXPERIMENTAL CONDITIONS: 60 CM (50 CM DETECTION WINDOW) X 75 µm I.D. FUSED SILICA CAPILLARY; 0.3 MG/ML OVALBUMIN; -10 KV (0.07 MIN) ELECTROKINETIC INJECTION; 50 MM SODIUM CHLORIDE IN 10 MM PHOSPHATE (PH 7.1) SEPARATION BUFFER; -25 KV APPLIED VOLTAGE; UV DETECTION AT 214 NM. AMPS-CO-EDMA MONOLITH COATED WITH POLYBRENE FIGURE 4.5. CHROMATOGRAM OF STANDARD PROTEINS. EXPERIMENTAL CONDITIONS: 20 CM (15 CM TO DETECTION WINDOW) X 75 µm I.D. FUSED SILICA CAPILLARY; EMDA-CO-AMPS POLYBRENE COATED MONOLITH; 0.2 μl/min FLOW RATE; LINEAR GRADIENT IN 5 MIN FROM 0 TO 100 MM SODIUM CHLORIDE IN 10 MM PHOSPHATE BUFFER (PH 7.1); UV DETECTION AT 214 NM. (1) MYOGLOBIN, (2) OVALBUMIN xv
17 LIST OF TABLES TABLE 2.1. COMPOSITIONS OF THE OPTIMIZED MONOLITHIC PRECONCENTRATOR FORMULATIONS USED IN THIS STUDY TO EVALUATE THE EFFECT OF MONOLITH FORMULATION ON BINDING CAPACITY. A...62 TABLE 3.1. REPRODUCIBILITIES OF MIGRATION TIMES AND PEAK AREAS OF STANDARD PROTEINS TABLE 4.1. COMPOSITIONS OF MONOLITH FORMULATIONS INVESTIGATED IN THIS STUDY A TABLE 4.2. REPRODUCIBILITIES OF MIGRATION TIMES AND PEAK AREAS OF DMSO FOR A POLYBRENE COATED MONOLITHIC COLUMN xvi
18 1 INTRODUCTION 1.1 Proteomics With completion of the Human Genome Project, the major bioanalytical focus has shifted to proteomics. Proteomics is a term that refers to the characterization of all proteins expressed by a group of active genes in a given cell or tissue. 1 Analyzing the proteome of human serum is a challenging task. A major difficulty is the complexity of the sample. It is estimated that thousands of proteins may be present in concentrations varying within at least 10 orders of magnitude. In addition, proteins may undergo posttranslational modifications (e.g., glycosylation and phosphorylation), further amplifying sample complexity. It is evident that no existing methodology is adequate to separate and detect this large number of proteins present in such a wide dynamic range of concentrations. Therefore, resolving the proteins in complex samples often necessitates the use of prefractionation and concentration techniques Prefractionation and Separation Technology for Proteomics The development of methods to simplify complex protein mixtures has become a major focus of numerous scientists. Various approaches, based on chromatographic, electrophoretic, or a combination of these methods, either on-line or off-line, have been developed to prefractionate and enrich low abundance proteins. 1,3 Fractionation methods exploit a particular physical or chemical property of the target compound. Frequently-used fractionation techniques for proteomics include ultracentrifugation, 4 gradiflow, 5,6 size-exclusion chromatography, 7 isoelectric 1
19 focusing, 8-10 hydrophobic interaction chromatography, 7 reversed-phase liquid chromatography, 1 ion-exchange chromatography, 7 affinity chromatography, surface enhanced laser desorption ionization-mass spectrometry, 15 and two dimensional gel electrophoresis. 16 Due to its high separation power (> 1000 proteins), two dimensional gel electrophoresis (2-DGE) has been the leading technique for proteomics. In 2-DGE, isoelectric focusing is used to separate proteins according to their isoelectric points in a first dimension. Then, in a second dimension, gel electrophoresis in the presence of sodium dodecyl sulfate (SDS) is used to further fractionate proteins according to their sizes. A typical protocol for proteomic analysis involves separation by 2-DGE with subsequent excision, extraction and digestion of the protein bands from the gel. Protein identification is then performed by mass spectrometric analysis of the resulting peptide mixture. In the field of biomarker discovery, 2-DGE has found widespread application since it affords direct comparison of protein expression levels in samples from healthy and diseased people. The potential of 2-DGE to investigate cancer and other diseases has been demonstrated by several authors Steel et al. 18 developed an approach to search for biomarkers in the serum proteome of patients undergoing hepatocellular carcinoma (HCC). Patients were divided into four categories according to the stage of the disease; namely, healthy, inactive chronic, active chronic, and chronic. Analysis of serum samples using 2-DGE followed by mass spectrometry (MS) indicated that the concentrations of complement C3 and apolipoprotein A1 were low in patients with HCC, suggesting that these protein levels could potentially be indicative of disease progress. 2
20 However, to confirm these results, further studies are needed with larger groups of people. In another investigation, He et al. 17 explored the serum proteome for hepatitis B virus (HBV) biomarkers. Serum samples from healthy and diseased people were subjected to 2-DGE, tryptic in-gel digestion and matrix assisted laser desorption ionization time of flight mass spectrometry (MALDI-TOF MS) analysis. Seven proteins (haptoglobin β chain, haptoglobin α 2 chain, apoliprotein A-1, apoliprotein A-IV, α 1 - antitrypsin, transthyretin and DNA topoisomerase ΙΙβ) were differently expressed in healthy patients and those undergoing HBV. Proteomic technology has also been used to search for renal cell carcinoma markers. 19 Early detection of physiological conditions would be very beneficial for the management of diseases. Since its introduction in 1975 by O Farrell for the separation of cellular proteins under denaturing conditions, much research has been focused on the improvement of 2- DGE. Modern approaches involve the use of narrow range immobilized ph gradient (IPG) strips instead of ampholyte solutions, and more sensitive staining methods using reagents such as Coomasie blue. 24 In spite of these improvements, some limitations still remain. 2-DGE is laborious and it suffers from difficulty in focusing very acidic or basic proteins and limited dynamic range; as well as poor reproducibility, sensitivity, quantitation, and solubility of hydrophobic and membrane proteins. 16,25 As a result of these limitations, researchers are continuously developing prefractionation techniques to enrich proteins and simplify sample complexity prior to 2- DGE. Typically, chromatographic methods have been adopted as a prelude to 2-DGE. 7 Various reports on the use of heparin chromatography before 2-DGE for the analysis of complex protein systems can be found in the literature. 3,20 Karlsson et al. 20 demonstrated 3
21 the utility of heparin columns to concentrate human fetal brain proteins. Eighteen new proteins were identified when heparin was used to reduce sample complexity before 2- DGE. Hydroxyapatite chromatography was used to simplify the proteome of Escherichia coli. Sample enrichment using this technique permitted detection of 130 new spots in 2- DGE. 26 Butt et al. 7 used anion exchage chromatography before 2-DGE to fractionate proteins from Escherichia coli. Proteins were enriched up to 13-fold. To improve detection of low abundance proteins, Badoc et al. 1 included a reversed-phase highperformance chromatographic step before 2-DGE of cell lysates. Identification and quantification of low abundance proteins is hindered by the presence of high abundance proteins, such as human serum albumin (HSA) and immunoglobulins (IgG), which together represent almost 75 % of the total proteins present in serum. 25,27-28 Therefore, in most cases, removal of the high abundance proteins or enrichment of the low abundance proteins is necessary prior to the analysis of low abundance proteins. 25,27,29 The use of a membrane based preparative electrophoresis method (gradiflow) for removal of albumin from human plasma has been reported. 6 Using this technique, plasma proteins were separated according to their pi values into two main fractions. The fraction containing albumin and other proteins with similar pi values to albumin were further fractionated by their differences in molecular weight. Albumin was then separated from other low molecular weight proteins based on a size exclusion mechanism. For the depleted albumin plasma samples, more proteins were visualized in the 2-DE gels. By removing this high abundance protein, more sample could be loaded on the gels without causing protein precipitation. Colantonio et al. 30 implemented a chemical-based extraction method for albumin removal. The protocol involved 4
22 incubation and centrifugation of serum samples following treatments with 0.1 M NaCl, 42% EtOH, and 0.8 M sodium acetate, ph 4.0. This approach, compared to conventional methods, such as separation on Cibacron Blue F3G-A columns and ammonium sulfate precipitation, proved to be more effective for the selective removal of albumin. Georgiou et al. 4 investigated ultracentrifugation as an alternative method for albumin removal from human plasma. Their results demonstrated that this technique is not effective in removing this high abundance protein. Affinity chromatography has been implemented as a prefractionation technique for removal of high abundance serum proteins prior to 2-DGE. 31,32 Ahmed et al. 31 compared two different commercially available kits for albumin and immunoglobulin removal (Affi-Gel Blue and Aurum). Their study showed that protein visualization increased after treatment using either method. As an alternative to 2-DGE, multidimensional separation methods in combination with highly sensitive and selective detection techniques, such as MS and laser induced fluorescence (LIF) have been implemented by several groups. 16,33-37 Chen et al. 8 developed an approach to couple capillary isoelectric focusing (CIEF) to reversed phase liquid chromatography (RPLC) by means of a microinjector. Enrichment factors of times were achieved for the proteomic study of Drosophila salivary glands. In-gel IEF-LC-MS/MS has been described for proteomic analysis. 9 Giorgianni et al. 9 utilized isoelectric focusing to separate human pituitary proteins. Following in-gel digestion of the protein bands, the peptide mixtures were separated and identified by LC-MS/MS. Interestingly, none of these techniques can provide the resolving power of 2-DGE. 5
23 It is evident that in the field of proteomics, there is an urgent need for the development of new sample preparation, concentration and separation techniques that would allow higher resolution than attainable by 2-DGE, and that would be sensitive enough to detect the low-abundance proteins. This dissertation was centered on this need. 1.3 Biomarker Discovery A highly competitive research area in proteomics is the discovery of biomarkers (proteins that change in concentration or state indicative of a specific physiological state or disease). 25 The proteome of human sera is a good source for biomarker investigation. Identifying and quantifying novel cancer biomarkers is challenging due to the very low concentrations at which these proteins are usually present (ng/ml). These low concentrations require the use of very sensitive and selective analytical tools. Routine analytical methods to screen for biomarkers in serum or plasma samples involve radio immuno assay and enzyme-linked immunosorbent assay. However, these timeconsuming methods are tedious, difficult to reproduce, and prone to generate false positives. Therefore, innovative techniques for analysis of specific biomarkers need to be developed. 31,38 Because of its high separation efficiency, speed, and low sample and buffer consumption, capillary electrophoresis (CE) should become more valuable in the field of proteomics. 38 6
24 1.4 Capillary Electrophoresis and Its Application to Protein Analysis Capillary Electrophoresis Fundamentals Capillary electrophoresis is a relatively modern analytical separation technique that has found extensive use in clinical chemistry Typical applications include analysis of peptides, proteins, drugs, drug metabolites, carbohydrates, biological extracts and small molecules. Capillary electrophoresis can be divided into six main groups according to the separation mode; namely capillary isoelectric focusing (CIEF), micellar electrokinetic chromatography (MEKC), capillary electrochromatography (CEC), capillary gel electrophoresis (CGE), capillary isotachophoresis (CITP) and capillary zone electrophoresis (CZE). All these are electrically driven techniques, meaning that applied voltage rather than pressure is the driving force for separation Capillary Isoelectric Focusing. In this technique, analytes separate according to their isoelectric points. A typical CIEF experiment is performed as follows. The capillary is filled with the sample solution containing ampholytes (compounds that can act as either acid or base) having a range of pi values. One end of the capillary is immersed in an acidic solution, and the other in a basic solution (anode and cathode, respectively). After voltage is applied, ampholytes start to migrate and form a ph gradient within the capillary. Analytes migrate in this ph gradient and focus at the positions where their pi equals the ph. Once all the analytes reach their equilibrium positions, focused analytes are moved along the capillary and detected by applying an external hydrodynamic force Micellar Electrokinetic Chromatography. This separation method relies on partitioning of the analytes between the buffer solution and the micelles (also called 7
25 pseudostationary phase) that form part of the separation buffer. Interaction of analytes with the micelles occurs via hydrophobic, ionic, or hydrogen bond forces. This technique has been applied to the separation of both neutral and charged compounds. In the case of neutral compounds, separation is based on partitioning solely, while for charged compounds, separation is determined by partitioning as well as electrophoretic mobility Capillary Electrochromatography. This technique is considered a hybrid of LC and CZE, combining the separation efficiency of CZE and the selectivity of LC. Voltage, rather than pressure, is used as the driving force for the mobile phase, which benefits the separation efficiency. Like micellar electrokinetic chromatography, the separation mechanism for neutral compounds is due to analyte partitioning between the mobile phase and the stationary phase, whereas for charged compounds, an additional parameter (electrophoretic mobility) must be taken into account. Both packed columns and coated columns can be used Capillary Gel Electrophoresis. This technique is carried out in a capillary filled with a gel, which may or may not be covalently bound to the capillary. Analytes separate due to a sieving mechanism. This method is widely applied to the separation of compounds having very similar charge/size ratio Capillary Isotachophoresis. This technique uses a discontinuous buffer system. The sample is sandwiched between a leading and a terminating electrolyte having higher and lower mobilities that the analytes, respectively. After voltage is applied, a nonuniform electric field is established in the capillary. Analytes and the leading and terminating electrolytes start to migrate at different velocities, eventually forming 8
26 focused zones. When equilibrium is reached, all zones move at the same velocity. The initial concentration of the analyte determines the length of the focused zone. 1-3,42-47 Capillary Zone Electrophoresis. This is probably the most commonly used separation mode in capillary electrophoresis. In this high resolution analytical separation technique, analytes are separated according to their electrophoretic mobilities when subjected to the influence of an electric field established in a separation capillary filled with a buffer solution. CZE employs narrow bore ( µm i.d.) capillaries, which can be made of Teflon, glass or fused silica. A typical CZE experiment is carried out as follows. The separation capillary is immersed in two vials (inlet and outlet) containing a buffer solution. After the capillary is filled with this solution, the inlet vial is replaced by a sample vial. Following injection of the sample, the inlet vial is placed back, and voltage is then applied across the column. Analytes migrate along the capillary at different velocities, which are mainly determined by their charge-to size ratios The net or apparent velocity is given by ν app = ν ep + ν eo (1.1) where, ν ep is the analyte electrophoretic velocity and ν eo is the velocity of the electroosmotic flow. These two parameters can also be expressed in terms of mobility values as follows ν app = μ app E (1.2) μ app = μ ep + μ eo (1.3) where μ ep and μ eo represent the analyte electrophoretic mobility and the electroosmotic flow mobility, respectively. The μ eo controls the magnitude of the bulk flow due to the movement of buffer ions along the capillary in the presence of an electric field, and is 9
27 primarily determined by the charge density of the surface of the capillary wall. In the case of fused silica capillaries, this charge is a function of the ph of the buffer solution. For example, at low ph values (2-3), the silanol (SiOH) groups are protonated and therefore the surface charge and μ eo are negligible. As the ph of the buffer solution is raised, the silanol groups become ionized, leading to an increase in negative charges on the capillary wall. This negatively charged surface attracts ions of opposite charge in the buffer solution, forming two main layers. The first is called the fixed layer, and the second the mobile layer. It is the movement of this latter layer that gives rise to the electroosmotic flow. 42,43 The electroosmotic mobility is defined as μ eo = εξ/η (1.4) where ξ is the zeta potential (potential across the two layers), and ε and η are the dielectric constant and viscosity of the buffer solution, respectively. The zeta potential is given by ξ = 4πδσ/ε (1.5) where δ is the thickness of the diffuse double layer and σ is the charge per unit surface area. Unlike mechanically driven flows, the electroosmotic flow has a flat flow profile. This means that the velocity of the fluid is constant along the radial axis of the capillary, which is the main reason for the high separation efficiencies observed in CE. Because the electroosmotic flow has a great impact on separation, a number of strategies have been developed to control its magnitude and direction. This will be discussed in Section The electrophoretic mobility is an intrinsic property of the analytes and is given by μ ep = q/6πr (1.6) 10
28 where q is the charge of the analyte and 6πr is its size. The observed mobility can be calculated from experimental data using the following equation μ app = L d /t m E (1.7) where L d is the effective length (distance from the inlet end of the capillary to the detection window), t m is the migration time, and E is the electric field. The ph, concentration and nature of the buffer solution, the presence of additives or modifiers (i.e., organic solvents, surfactants, and urea) in the separation buffer, the material as well as method used to modify the surface of the capillary wall, the applied separation voltage, the capillary dimensions (internal diameter and length), and the injection volume and mode (hydrodynamic versus electrokinetic) play major roles in the quality of the separation. Therefore, all of these parameters should be carefully tailored when developing a CZE method. 42,43 High efficiencies are achieved when analyte adsorption is prevented. Typically, the use of high or low ph buffers with high ionic strength favors separation when using bare fused silica capillaries. For coated capillaries, the use of neutral ph buffers is possible. The inclusion of additives in the buffer solution may alter the mobilities of analytes and improve solubility. In addition, they may also modify the capillary surface. 42,43 As a general trend, high separation voltages and long capillaries with small internal diameters should provide high separation efficiencies. However, care must be exercised when applying high voltages to not generate Joule heating (heat produced by high currents). Joule heating results in temperature gradients along the capillary and bubble formation, which is detrimental to the separation efficiency. 42,43 The volume of sample 11
29 injected is determined by the injection mode employed. For hydrodynamic injection, the volume is given by V = Δpd 4 πt/128ηl (1.8) where Δp is the pressure difference across the capillary, d is the capillary inner diameter, t is the injection time, η is the buffer viscosity, and L is the capillary length. For electrokinetic injection, the amount of sample injected is given by Q = [πr 2 C s (μ ep + μ eo ) Etλ b ]/λ s (1.9) where, Q is the amount of sample injected, r is the radius of the capillary, C s is the sample concentration, λ b is the conductivity of the buffer and λ s is the conductivity of the sample. 42,43 Notice that, with this injection mode, the analyte electrophoretic mobility impacts the volume of sample injected. Therefore, unlike hydrodynamic injection, electrokinetic injection discriminates according to electrophoretic mobilities. When the sample is dissolved in a low ionic strength solution such as water, electrokinetic injection is preferred over hydrodynamic injection, since it typically results in higher separation efficiencies as a consequence of stacking effects (see Section for a more detailed discussion). Injection volumes should be maintained within 0.2% of the capillary volume to prevent band-broadening due to column overloading. 42, Capillary Electrophoresis for Protein Analysis Recently, the application of CE to proteomics research has increased in popularity. An advantage of CE over traditional 2-DGE methods is that it offers the possibility of concentrating dilute samples on-column prior to separation. This is attractive for proteomics, in which high sensitivity is essential. In addition, integration of sample 12
30 preparation, separation and detection is feasible. The fewer the manipulations required to process a sample, the less the loss of analyte. 33,48 In order to make CE more attractive for real bioanalytical applications, however, some drawbacks still need to be addressed. One of the most striking drawbacks is the small allowable sample volume (1-10 nl) that can be injected into the capillary to avoid band broadening. 49 This, coupled with the short path length for optical detection, leads to poor concentration limits of detection (CLOD). For proteins, CE analysis is usually limited to the micromolar range when using UV absorption detectors. 18 To compensate for this, different capillary geometries, novel optical designs, and sample preconcentration methods have been developed. 49 The use of more sensitive detectors such as laser-induced fluorescence is also an alternative for sensitivity enhancement. Capillary Surface Passivation. In addition to poor CLOD, protein analysis by CE is also challenged by undesirable analyte adsorption on the surface of the capillary wall. Nonspecific interactions (i.e., van der Waals, hydrophobic and electrostatic) between proteins and surfaces always exist. The surface chemistry of fused silica (the most commonly used material for CE) provides interaction sites, which imposes difficulties when the analysis of proteins is desired. 50 In CE, these interactions alter the zetapotential over the length of the capillary, ultimately leading to band broadening and irreproducible migration times. Because the magnitude of these interactions is dependent on the surface characteristics, surface passivation of the separation capillary prior to protein analysis by CE is of paramount importance. 38,51-53 Surface modification of the capillary walls is also necessary to control the magnitude and direction of the electroosmotic flow. 13
31 Significant contributions to help solve this problem have been made by several authors, and various strategies to deal with protein adsorption can be found in the literature One strategy is to work at extreme ph values, where the silanol groups on the capillary are either ionized or fully protonated. The success of this approach was demonstrated by Lauer and McManigill. 56 Standard proteins (lysozyme, cytochrome c, ribonuclease A, myoglobin, conalbumin, carbonic anhydrase, ovalbumin and β- lactoglobulin) were separated on bare fused silica capillaries. The ph of the separation buffer was set at values higher than the isoelectric points (pi) of the proteins. CE separations were carried out at high ph values (8-11). Under these conditions, the surface of the fused silica capillary bears a negative charge, and since both proteins and capillary wall are negatively charged, protein adsorption is prevented. For the proteins analyzed, good separation effieciencies (1 x 10 6 theoretical plates) were obtained. Silica dissolution at high ph values and protein instability, however, limit the applicability of this approach. 57,58 Another strategy is to dynamically coat the surface of the capillary with modifiers (ions, zwitterions, polymers, denaturant agents, etc.) that are added to the running buffer. 51,52,58-61 Constant replenishment of the coating for optimal operation, however, is required. 51 Dynamic coating has been accomplished by the use of poly(vinyl alcohol), 52 PEO, 59 and polyelectrolyte multilayers. 62 The other strategy involves permanent coating of the surface of the capillary with molecules (generally polymers) that are either covalently bonded or physically adsorbed to the surface Even though this could be the most effective strategy, coating lifetime is a concern. 12,38,58,67 Permanent coating has been accomplished using polymers such as carbowax 20, 58 polyethylene imine, 68 14
32 methylcellulose, 58 polyethylene glycol, 58 dextran, 67 maltose, 58 linear and cross-linked polyacrylamide, 60,69 poly(vinylpyrrolidone), 51 cellulose acetate, 70 and successive multiple ionic polymer layers Even though the surface chemistry of silica is well established and understood, there is not a single coating that will work for all protein analysis. Therefore, the selection of the coating material and method largely depends on the particular application. Preconcentration Techniques in CE. Interestingly, in CE, the small capillary dimensions that provide high efficiency separation (1 x 10 6 theoretical plates) also limit the amount of sample that can be injected, as well as the optical path length for detection. This in turn increases the concentration detection limits attainable, making the analysis of samples at low concentrations a challenge An approach to circumvent poor concentration detection limits in CE is to use a more sensitive detector, such as electrochemical, mass spectrometry, or laser induced fluorescence. Laser induced fluorescence, however, still encounters difficulties when labeling of analytes at low concentrations is needed. Another approach is to increase the sample loadability by using sophisticated stacking techniques such as sample stacking, field-amplified stacking and transient isotachophoresis. The principle behind these focusing methods is based on velocity changes that analytes experience when subjected to a non-uniform electric field in the separation capillary, generated as a result of the use of discontinuous buffer systems. Sample stacking occurs when a sample is dissolved in a solvent (usually water) having a lower conductivity than the background electrolyte. Analytes in the sample zone experience a high electric field, due to the low conductivity of this zone, and quickly 15
33 migrate towards the boundary between the sample zone and the background electrolyte zone, where they slow down due to the low electric field in that region. Optimal stacking conditions occur when the analyte electrophoretic mobility is greater and in opposite direction to that of the electroosmotic flow. 80,81 Field amplified sample stacking (FASS) is in a way similar to sample stacking except for, in FASS, analyte separation is performed with a voltage polarity opposite to that used during the focusing step. FASS enables injection of larger sample volumes than sample stacking, which favors sensitivity enhancement. 80,81 In isotachophoresis, the sample is sandwiched between leading and terminating electrolytes having larger and lower mobilities than the analyte, respectively. The nature and concentrations of the leading and terminating electrolytes, as well as the lengths of the stacking zone have a great impact on preconcentration. After voltage is applied, a non-uniform electric field is established in the capillary. Analyte, leading and terminating electrolytes start to migrate at different velocities, forming focused zones. Once the analytes focus at their equilibrium positions, all bands migrate at the same velocity. Separation can then be performed either in the same capillary where the isotachophoresis process takes place or in a different capillary coupled on-line. These methods are known as transient isotachophoresis (titp), and coupled-capillary isotachophoresis (citp), respectively ,80-82 Another important tool for increasing sensitivity in capillary electrophoresis is ph junction. The principle behind this technique is based on changes in velocity as well as migration direction of analytes, as a result of changes in the ionization state of the analytes induced by a ph discontinuity between the sample zone and the background 16
34 electrolyte. 83 This method was first applied by Aebersold and Morrison in 1990 to the focusing of peptides. Currently, two approaches have been introduced: In one, the background electrolyte has a ph value below the isoelectric points (pi) of the analytes, while the sample zone has a ph value above. 80 In the other, 83 the ph of the background electrolyte is higher than the pi values of the analytes and the sample zone. 84 Wang et al. 84 introduced a method for protein preconcentration by ph junction. Lysozyme, myoglobin, carbonic anhydrase and α-lactalbumin were preconcentrated using a discontinuous ph buffer system consisting of tri-propanoate. The approach was extended to the analysis of tryptic digests. Concentration detection limits for these peptides were in the nm range. On-line concentration-cze separation of proteins has also been accomplished using polymer solutions. Tseng et al. 59 introduced an approach to enrich proteins prior to CZE using poly(ethylene oxide), PEO, solutions. Protein enrichment was accomplished by filling the capillary with Tris-borate buffer, ph 10.0, and injecting a long plug of sample, followed by the same buffer containing 0.6% PEO. The approach was demonstrated for both protein standards and urine samples. Discontinuity in salt content as well as organic solvent concentration has also been used to induce sensitivity enhancement in CE. Shihabi, 85 for example, demonstrated that the presence of both acetonitrile and sodium chloride in the sample matrix aids analyte stacking. Because of the low solubility of salts in organic solvents, the NaCl ions migrate away from the acetonitrile, creating zones with different conductivities, which gives rise to a discontinuous electric field. Peptides and other small molecules were concentrated using this method. Notice that these methods to increase sample loading are still limited 17
35 to injection volumes less than the total volume of the capillary (< 1 μl). 5,86 In addition, these methods are problematic when high conductivity matrices are used, since the focusing mechanism is based on conductivity differences between sample and buffer zones. Therefore, applicability of these methods is limited to samples with low salt content. Evidently, when the analysis of samples having high salt concentrations like biological fluids is desired, a clean-up procedure becomes necessary, and alternative preconcentration methods must be used. A powerful method to analyze components at low concentrations in complex matrices is to preconcentrate the analytes either on-line or off-line prior to separation. Even though they are more flexible, off-line preconcentration methods have the disadvantage that sample handling may lead to analyte losses to the exposed surface (e.g., vials, tips, and pipets). 87 Minimal sample handling can be achieved by the use of on-line preconcentration methods. 86 Much effort has been directed toward the development of on-line sample preconcentration in CE, and several papers can be found dealing with the preconcentration of trace components present in human specimens prior to separation. 88,89 Since the pioneering work of Guzman, several on-line preconcentration devices for CE have been designed, in which a solid support (i.e., polymeric or silica based particles) is either directly positioned in a small section of the electrophoresis capillary 78,90-93 or forms part of an external device that is coupled to the electrophoresis capillary. 78,94,95 Clearly, these devices have higher sample loadabilities than sophisticated sample injection techniques such as field-amplified stacking and transient isotachophoresis, since the loading capacity is not limited by the total capillary volume
36 Preconcentration methods can be classified as non-selective or selective, depending on the affinity of the solid support for the analytes. 88 For selective analyte preconcentration, on-line immunoaffinity capillary electrophoresis has found widespread application. In immunoaffinity capillary electrophoresis, specific antibodies bound to the surface of a porous material (i.e., porous polymer, glass beads, silica beads, membrane, or the capillary wall itself) are used for the selective concentration of specific antigens. 75,86,89 Following capture, the antigens are eluted with a small plug of an elution buffer that disrupts the binding affinity. The desorbed antigens are then separated by CE. Cole and Kennedy 96 reported the development of a system for both on-line and off-line preconcentration of insulin. The system consisted of two columns: a packed column with a perfused protein G chromatographic support and a coated capillary column for CZE. For on-line preconcentration-cze, the two columns were coupled via a flow-gate interface. The protein G column was first saturated with antibody, and then the antigen (insulin) was loaded. Antigen and antibody were eluted with a low ph buffer, and subsequently separated along the CE column. Dalluge and Sander 88 developed a technique termed precolumn affinity capillary electrophoresis. Monoclonal anti-cardiac troponin I antibodies were covalently immobilized on 10 μm porous silica particles, and this material was used to pack a 5 mm long section of a 75 μm i.d. CE capillary column. Analysis of human cardiac troponin I (ctni) in serum was demonstrated with this technique. Another example of immunoaffinity capillary zone electrophoresis was presented by Guzman, 89 who fabricated a preconcentrator for the analysis of immunoreactive gonadotropin-releasing hormone in serum and urine by capillary electrophoresis coupled 19
37 to mass spectrometry. F(ab) fragments of polyclonal antibodies directed against gonadotropin-releasing hormone were immobilized on controlled-porosity glass beads. This chromatographic support was then packed inside a fused silica capillary (10 mm x 150 μm i.d.) to form an analyte concentrator chamber, which was then connected to two separation capillaries via a Teflon sleeve. The system proved to be effective for the determination of this clinically relevant hormone. Furthermore, coupling of the system to mass spectrometry lowered the concentration limits of detection to 1 ng/ml. A number of examples of non-selective preconcentration have been introduced. Swartz and Merion 97 developed a method to preconcentrate pharmaceuticals prior to CE analysis. Using commercially available concentrator capillaries having 1.0 mm polymeric reversed-phased beds supported with glass frits, these authors demonstrated the preconcentration of doxepin and propanolol standards. The approach was then extended to analysis of urine samples spiked with doxepin. Sensitivity enhancements of at least 2 orders of magnitude were demonstrated. Hoyt et al. 92 reported the fabrication of an on-line preconcentrator for capillary electrophoresis. In their approach, 1-3 mm beds packed with borosilicate glass microspheres were placed at the inlet end of the separation capillary and used for preconcentrating NDA-Gly, a tryptic digest of bovine cytochrome C, and adrenal medullary cell samples. Strausbauch et al. 5 designed a solid phase extraction-ce system for on-line concentration-cze separation of peptides. C 8 or C 18 cartridges were connected in-line with fused silica capillary columns via a polyethylene sleeve. In addition to the formation of bubbles, a major disadvantage of these designs is the increased backpressure generated by the use of frits, which disrupts the electroosmotic flow (EOF) and eventually induces blockage of the capillary. 20
38 To alleviate issues associated with the use of frits, a variety of strategies have been adopted. One approach involves the use of a magnet instead of frits to hold the solid packing in place. Rashkovetsky et al. 91 used commercially available CE preconcentrator capillaries consisting of a 2-3 mm plug of magnetic beads having immobilized antibodies raised against mouse monoclonal antibodies. The beads were kept in place by an external magnet. The technique was applied to preconcentration and enzymatic assays. An advantage of this design is that the chromatographic support can be disposed of after each analysis, which prevents cross-contamination. Another approach is to replace the solid phase preconcentrator by an open tubular preconcentrator. Cai and El Rassi, 95 for instance, connected a fused-silica capillary bearing iminodiacetic acid metal chelating functionality to a CE capillary column by means of a polytetrafluoroethylene (PTFE) tube. Using this system, the CLOD of bovine carbonic anhydrase was lowered at least 25 times. The main problem with this approach is the low binding capacity of the preconcentrator as a result of the low accessible surface area, which diminishes the preconcentration factors attainable. In an effort to overcome this limitation, the use of a bundle of capillaries has been proposed. Guzman, 94 for example, investigated two different analyte preconcentrator designs: an array of multiple capillaries and a glass rod with multiple pass-through holes. Anti-IgE antibodies were immobilized on the walls, and this cartridge was coupled to a CE separation capillary. Ease of fabrication, reproducibility of EOF, and improved stability were among the advantages offered by the second design. Polymeric materials have also been proposed as absorptive phases. Several groups have reported the use of membranes for preconcentration in CE. 41,86,98,99 This technique 21
39 is termed on-line membrane preconcentration-ce, and it is based on the use of a polymeric membrane that is sandwiched in between two capillaries. Rohde et al. 98 inserted a small membrane plug into a PTEF tube, to which two pieces of fused silica capillary were subsequently attached. This system was further connected to a CE separation capillary. Membrane materials with an ample range of functionalities (cationexchange, R-SO 3 H; and hydrophobic, C 2, C 8, C 18, and styrene divinyl benzene) were evaluated for on-line preconcentration-ce separation of standard proteins. A limitation to this approach is the need to couple the preconcentrator and separation capillaries. An advantage, however, is that because the preconcentrator capillary can be separated from the separation capillary during sample loading, there is more flexibility in buffer selection. In addition, buffer and sample introduction becomes easy. Another added advantage is the wide variety of functional groups available in polymers, which amplifies the range of applications for this type of preconcentrator. Guzman 90 described an improved analyte preconcentrator for capillary electrophoresis. The design consisted of a cruciform configuration, connecting four capillaries: two of which (large bore) were used for sample preconcentration, and the other two (small bore) for CZE. Controlled porosity glass beads having specific antibodies attached were positioned inside the small cavity of the cruciform and kept in place by membranes located on all four sides of the cruciform. By operating the separation and concentration capillaries independently, contamination of the separation capillary wall during sample preconcentration was avoided. This resulted in systems with increased lifetime, which is the main advantage of this design. 22
40 Hollow fibers have also been used as a means of signal enhancement in capillary electrophoresis. Zhang and Hjertén 100 proposed a method for concentrating proteins using hollow fibers. In this approach, concentration takes place as water molecules evaporate out of the fiber. Different mechanisms were explored to concentrate analytes. Phycoerythrin samples, as well as β-lactoglobulin A and B, α-lactalbumin and hemoglobin Ao (HB) were successfully preconcentrated using this technique. The approach was also applied to the enrichment of low molecular weight compounds such as K 2 CrO 4. This technique proved to be very effective for performing protein preconcentration, as well as for removing salts from the sample matrix. A potential limitation of this approach is that it still requires significant manual handling. In addition, the risk of contamination during sample handling is a concern. Wu et al. 101 investigated the on-line coupling of hollow fibers to capillary electrophoresis for protein preconcentration. In their set up, a semipermeable hollow fiber was integrated with an untreated fused silica capillary column. Cytochrome c, lysozyme, ribonuclease A and α-chymotrypsinogen A were used as model proteins to evaluate the system. Small ions passed through the fiber, while proteins preconcentrated at the fiber when an electric field was applied between the inlet end of the capillary and the hollow fiber. Separation was achieved when the applied electric field was between the fiber and the other end of the capillary. Up to 1000-fold preconcentration factors were attained with this method, but this preconcentration method discriminates according to electrophoretic mobilities. High electrophoretic mobility proteins concentrate more at the fiber than low electrophoretic mobility ones. 23
41 A unique approach for protein preconcentration that does not rely on chromatographic principles, but rather on an electric field was introduced by Wei and Yeung. 102 In their approach, a cm conductive porous region was generated on a bare fused silica capillary (40 cm x 75 μm i.d.) 10 cm away from the inlet end by etching with hydrofluoric acid. This region allowed the passage of ions and small molecules, but not proteins. In the presence of an electric field generated by applying a voltage between the inlet end of the capillary and the porous region, proteins moved along the capillary, and accumulated at this junction. When the voltage was switched between the junction and the other end of the capillary, concentrated proteins were separated along the remaining 30 cm of the capillary and detected by UV. In a more recent application, Yang et al. 103 presented a novel method for protein preconcentration in CE using porous membranes. A cellulose acetate-based porous membrane located at the inlet end of a bare fused silica capillary served as a size exclusion support for protein enrichment. Sample was electrokinetically loaded. Owing to a size exclusion mechanism, proteins were retained and preconcentrated in the membrane, while small ions passed through. By switching the polarity of the applied voltage, trapped proteins were separated by CZE. Preconcentration of bovine serum albumin and ovalbumin was demonstrated. An advantage of this design is that preconcentration and separation take place in a single capillary. A disadvantage, however, is that the lifetime of this system is limited by protein adsorption at the capillary wall since surface deactivation was not performed. More recently, the potential of methacrylate based monoliths for on-line preconcentration in capillary electrophoresis has been demonstrated by several 24
42 authors. 93, The nature of monoliths is a subject that will be discussed later in Section Using UV initiated polymerization, Baryla and Toltl 93 prepared a 1 cm methacrylate monolith at the inlet end of a capillary column. On-line sample enrichment- CZE separation of standard propanolol was demonstrated with this system, and the detection limits were in the nanomolar range. Hilder et al. 104 reported the use of methacrylate monoliths for preconcentration and CE separation of antidepressant drugs. Hutchinson et al. 105 synthesized porous butyl methacrylate-co-ethylene glycol dimethacrylate-co-2-acryloylamido-2-methyl propane sulfonic acid (BuMA-co-EDMAco-AMPS) monoliths inside 250 μm capillaries. After coating of the monolith with 65 nm quaternary ammonium latex particles, the monolithic capillary was connected to a separation capillary coated with either a cationic polymer or cationic latex particles. The coated monolith was used for preconcentration and CE separation of ions. Using photoinitiated polymerization, Lee s group 106 prepared a poly(glycidyl methacrylate-cotrimethylolpropane trimethacrylate) monolith inside the inlet end of a polybrene coated capillary. Protein G was then covalently bonded onto this monolith. The system proved effective for on-line sample extraction, clean-up, preconcentration, and CE of IgG in human serum. IgG from diluted (500 and 65,000 times) human serum samples was analyzed using this system. In spite of the effort that has been devoted to the development of on-line preconcentrators for protein analysis by CE, no device proposed so far can be considered ideal. Therefore, innovative designs must be found to overcome the limitations of previously reported preconcentrators. The design, characterization and evaluation of online monolithic preconcentrator-ce systems for the enrichment and separation of low 25
43 abundance proteins is emphasized in this dissertation. Such a preconcentrator could have a tremendous potential for biomarker discovery. 1.5 Affinity Chromatography in Proteomics Affinity chromatography is a technique in which separation occurs as a consequence of specific interactions between immobilized receptors and target analytes. Affinity chromatography combined with mass spectrometry has been used for performing studies involving protein-protein interaction, concentrating peptides, exploring posttranslational modifications, and performing quantitative analysis of proteins via isotope coded affinity tags (ICAT). Affinity chromatography has also served as a sample preparation tool before 2-DGE and CZE. The reader is referred to Sections 1.2 and for some applications utilizing these latter techniques When the immobilized receptor is an antibody, the technique is referred to as immunoaffinity chromatography. An antibody is a glycoprotein generated in response to an antigen. Antibodies belong to the family of immunoglobulins. IgG antibodies, for example, consist of four polypeptide domains (two of which are called heavy chains, and the other two are called light chains) connected together via disulfide bonds in a Y or T- shaped configuration. The heavy chains contain a constant amino acid composition, whereas the light chains contain a variable region which is responsible for antigen recognition. An IgG molecule should, in theory, be able to bind two antigen molecules. Two types of antibodies have been produced, namely, polyclonal and monoclonal antibodies. Polyclonal antibodies are generated by animals in response to immunization with foreign agents. These antibodies are heterogeneous in nature and, as a consequence, bind antigens with different strengths. Monoclonal antibodies, on the contrary, are raised 26
44 in the laboratory by a single clone of cells. These antibodies are more attractive since they do not require the use of animals and have more consistent properties. Both, polyclonal and monoclonal antibodies have been employed to prepare immunoaffinity supports Some parameters that must be controlled when developing immunoaffinity supports include the properties of the chromatographic support, the amount of antibody linked to it, and the percentage of antibody that remains active after coupling to the support. Desirable chromatographic supports should be chemically as well as mechanically stable, and should have a high porosity. The amount of immobilized antibody can be controlled by optimizing the coupling reaction conditions. The ph of the reaction media, the presence of salts or other additives as well as the temperature and reaction time are important parameters to control. Adequate reaction conditions include the use of aqueous media (ph 4-9, depending on the pi of the affinity molecule to be immobilized), 4-25 C and up to 16 h reaction time. 111 The percentage of active immobilized antibody is what ultimately determines the efficiency of the affinity support, and it is affected by multi-site attachment, random orientation and steric hindrance. The chemistry involved during the coupling process largely influences the antibody activity. Covalent bonding of the affinity ligand may be accomplished by reacting the free amine groups of the ligand with epoxy or aldehyde groups present on the surface of the support. Free amine groups in the ligand can also be reacted with N,N-carbonyl diimidazole, cyanogen bromide, N-hydroxysuccinimide and tresyl chloride/tosyl chloride activated supports. With this strategy, random orientation of the affinity ligand, however, results. This is somewhat undesirable since the accessibility of the binding site may be 27
45 affected, leading to a lower binding capacity than theoretically predicted. To avoid this, oriented immobilization has been proposed. 109,110 One way to accomplish oriented immobilization is to use the F(ab) fragments of the antibody produced in a controlled reaction such as digestion with papain or pepsin enzymes. (Fab) fragments are produced upon digestion of the antibody with papain, whereas (Fab) 2 fragments are generated when pepsin is used. These fragments provide one or two binding sites, respectively. An alternative method involves the use of intermediate molecules such as protein G, protein A, or avidin. Protein G and protein A specifically bind the Fc region of IgG, leaving the two binding sites available for antigen recognition. 109 The ultimate goal is to obtain high performance immunoaffinity supports with high binding capacity and specificity toward the target analyte. Because of their high porosity and low flow resistance, monoliths have been employed as sorbents for the preparation of immunoaffinity supports. 109,110 This will be discussed in Section Enzymatic Assays for Protein Identification Enzymatic digestion is a fundamental tool in proteomics. One of the most reliable methods for the identification of proteins and the determination of posttranslational modifications is protein digestion, followed by peptide mapping by either matrix assisted laser desorption ionization (MALDI) or electrospray ionization (ESI) MS of the resulting peptide mixture. The peptide map generated is unique for each protein and allows unambiguous assignment through searching of existing databases in many cases. 86,112,113 Conventional enzymatic digestions are carried out in solution, where the enzyme and the substrate are mixed in appropriate ratios and maintained at optimum ph and 28
46 temperature. The use of enzymes in solution, however, results in autodigestion, complicating the fragmented pattern. Unwanted autodigestion can be eliminated by the use of enzymes immobilized on a solid support. Immobilized enzymes are more resistant to inhibitors, as well as to unfolding of their native structure. Consequently, immobilized enzymes are more stable and retain their catalytic activities over longer periods of time than free enzymes. In addition to leading to more reproducible hydrolysis, immobilized enzymes are suitable for the analysis of small amounts of substrate solutions, which is often the case for biological fluids. 112,113 Immobilization of an enzyme can only occur on surfaces that are accessible to the enzyme and that will not hinder access of the substrate to active sites. Obviously, the larger the surface area of the support, the more enzyme can be immobilized. Accordingly, porous supports are favored. Several methods of immobilizing enzymes have been reported. Among these methods, enzyme immobilization through a biotinavidin couple affords very strong noncovalent bonding of an enzyme to a support. Two values, the Michaelis constant (K m ) and maximum velocity (V max ), characterize the activity of an enzyme. K m represents the substrate concentration required to give a reaction velocity that is half its maximum value. The contact time of the substrate with the immobilized enzyme, the substrate concentration, and the ph and temperature of the reaction are some parameters that can be tailored to achieve maximum protein digestion. Trypsin, with its unique property of hydrolyzing selectively at the C-terminal sites of lysine and arginine residues, generates relatively simple tryptic digests. Consequently, trypsin has been the proteolytic enzyme of choice for many applications
47 Over the years, enzymatic hydrolysis has proven to be a powerful technique for the identification and characterization of proteins. Therefore, it is not surprising that the number of publications on this type of reaction continues to increase. 112,113 Currently, various strategies to overcome some of the limitations of peptide mass mapping, such as manual sample handling steps and extended reaction times for proteolytic digestion have been developed. Typical approaches include miniaturization of the enzymatic reactor to increase reaction kinetics, and the coupling of the reactor to separation techniques and MALDI or ESIMS Evidently, as the demand for high-resolution bioanalytical tools capable of performing rapid identification and quantification of protein analytes in complex mixtures continues to grow, the search for innovative enzyme reactors integrated on-line with concentration and separation techniques as well as mass spectrometric detection becomes essential. This integrated analytical platform would clearly provide automated sample handling, enhanced detection sentitivity and dynamic range, which are particularly attractive for the analysis of complex protein mixtures, such as plasma. 1.7 Porous Monoliths and Their Application to Proteomics Monolith Generalities A versatile chromatographic support termed a monolith was first introduced in 1989 by Hjertén et al. 114 A monolith is a continuous rod with canal-like large through-pores and nanometer-sized pores in the skeletal structure. 114 These supports are cast within the confines of a microchannel, capillary or tube that has been filled with a mixture of monomers. Two kinds of monoliths have been introduced to date, namely silica based monoliths and polymer based monoliths
48 Silica monoliths are prepared by gelation of a sol solution. 116 Compared to silicabased monoliths, polymer monoliths are stable over a wider range of ph values. 117 Polyacrylamide, polystyrene, and polymethylacrylate-based monoliths have been introduced. Polymer monoliths 118,119 are typically prepared by in situ polymerization of solutions composed of a monomer, crosslinker, porogen, and initiator. Polymerization can be initiated by a redox system or by a free radical initiator. For the latter, decomposition of the initiator can be induced either thermally or by UV light. UV photoinitiated polymerization can be faster than thermally induced polymerization, and it permits facile control of the length and shape of the monolith through the use of a suitable mask. To be useful as a porogen, an organic solvent must meet some requirements. For example, it must dissolve the monomers, cross linker and initiator so that a transparent monolithic precursor solution can be prepared. In addition, it must be UV transparent if photoinitiated polymerization is to be used. Basically, the mechanism for monolith formation involves a phase separation. At the initial state of polymerization, polymer chains begin to form. As polymerization proceeds, the polymer chains continue to grow and become insoluble, forming porous solid structures. Upon completion of the polymerization process, porogens and unreacted monomers are washed away, leaving behind the pores. 120 The highly porous structures of monolithic columns give them high mechanical strength, low flow resistance and high rates of mass transfer. Diffusion in monoliths is much faster than in conventional supports and is no longer a limiting factor for analyte 31
49 interaction. Consequently, the use of high flow rates is possible. Rapid separations are the result. 115,116,120,121 An attractive feature that makes monoliths amenable as chromatographic supports is that no frits are required, since the monolith rods are directly synthesized within the column. 119 Another characteristic is that the pore size distribution (macropore, mesopore and micropore) can be easily controlled by manipulating the reaction conditions (reaction time and temperature, nature of the radical initiator, nature of the porogen, and monomer to porogen ratio). 115 This is important in immunoaffinity chromatographic applications where careful control of the pore size is desirable, since it determines the surface area of the sorbent accessible for immobilization of the affinity ligands. Small pore sizes provide high surface areas, but steric hindrance may result. Large pore sizes offer better ligand accessibility, but afford smaller surface areas. Therefore, a compromise must be found. 115 Because of the flexibility in monomer choice, as well as surface functionalization methods available (copolymerization with a functional monomer, post-modification of a reactive monolith, and grafting) monoliths with a variety of surface chemistries can be prepared. 122,123 This extends the applicability of these chromatographic supports to basically any chromatographic separation mode (e.g., normal phase, reversed phase, ion exchange, affinity, and capillary electrochromatography). 32
50 1.7.2 Monolith Application to Proteomics This fascinating chromatographic support has found widespread application in protein analysis. Monoliths have been used for protein separation, digestion, and preconcentration. Both capillary and microchip formats have been explored. The potential of monoliths as stationary phases for biochromatography has been extensively demonstrated. Glycidyl methacrylate (GMA) based monoliths have been typically used as chromatographic support for affinity separations. Luo et al. 123 thermally polymerized glycidyl methacrylate-co-ethylenedimethacrylate (GMA-co-EDMA) monoliths inside chromatographic columns. Protein A or L-histidine was subsequently reacted on these monoliths. The columns were evaluated for affinity chromatography of IgG from human serum. In another application, Pan 124 prepared GMA-based monoliths within the confines of chromatographic columns. Following immobilization of protein A, the columns were used for liquid chromatography (LC) affinity purification of human IgG. Bedair and El Rassi 125 fabricated affinity monolithic capillary columns for isolation of mannose-binding proteins by nano-lc and CEC. Two types of monoliths were prepared: a GMA-co-EDMA based monolith for nano-lc and a GMA-co-EDMA-co-[2- (methacryloyloxy)ethyl]trimethyl ammonium chloride monolith for CEC. Conjugation of mannan to the epoxy group of glycidyl methacrylate based monoliths was accomplished using different methods. The monoliths showed strong affinity toward mannose-binding proteins. In-situ polymerization, rather than covalent attachment to a reactive monolith, of the affinity ligand is an alternative to preparing affinity monoliths. In this approach, the affinity ligand is linked to one of the monomers, after which polymerization is induced. Incorporation of the affinity ligand prior to polymerization 33
51 generates affinity supports with higher binding capacity than those obtained using conventional methods for ligand immobilization. Several authors have adopted this strategy. Hahn et al., 126 for example, developed a method to covalently link a small peptide, having affinity to lysozyme, to glycidyl methacrylate. The modified monomer was then copolymerized with ethylene dimethacrylate, forming an affinity monolith. Improved binding capacities were achieved using this method. Monolithic disks have also been applied to affinity chromatography Tennikova s group combined in series several affinity GMA-co-EDMA based monolithic disks inside a cartridge. The system was used to simultaneously purify different polyclonal antibodies from rabbit serum. Typically, monoliths have been applied to the separation of proteins using various chromatographic modes. Gu et al. 130 prepared a novel protein-compatible monolith [poly(polyethylene glycol methyl ether acrylate-co-polyethylene glycol diacrylate)] by UV initiated polymerization for use in alternative applications where inert materials are required. The monolith proved to be effective for size-exclusion separation of peptides, and it resisted protein adsorption as evidenced by protein recovery tests. The applicability of polymer monoliths as supports for rapid enzymatic conversion has currently been shown by several authors. The fabrication of monolithic enzymatic microreactors in capillary and microdevices has been reported. Peterson et al. 131 prepared a 25 mm long poly(butyl methacrylate-co-ethylene dimethacrylate) monolith inside a 50 μm i.d. capillary having a 9-12 μm pulled tip for coupling to mass spectrometry. Using photografting, a 20 mm section of this monolith was modified with poly(2-vinyl-4,4- dimethylazlactone) for subsequent attachment of trypsin. This resulted in a device 34
52 containing two different functionalities for simultaneous preconcentration and digestion. The function of this device was demonstrated using a myoglobin solution. The use of photografting techniques permits controlled functionalization of monoliths with appropriate chemistries. This is indeed beneficial for the fabrication of lab on a chip, miniaturized systems that incorporate sample preparation (clean-up, enrichment, and chemical reactions), separation and detection is a single device. 122 More recently, the use of methacrylate-based monoliths in capillary electrophoresis for selective and non-selective on-line preconcentration has been demonstrated by several authors 93, (see Section for a more detailed discussion). Preconcentration has been introduced in microchips. For example, Svec s and Fréchet s group 132 fabricated an on-chip solid-phase extraction and preconcentration device. Both hydrophobic (butylmethacrylate-co-ethylene dimethacrylate) and anion exchange (2-hydroxyethyl methacrylate-co-[2-(methacryloyloxy)ethyl]trimethylammonium chloride-co-ethylene dimethacrylate) monoliths were prepared by photoinitiated polymerization within the confines of a microfluidic device. Applicability of this device to on-line preconcentration was evaluated using standard solutions of Coumarin 519 and green fluorescent protein. 1.8 Detection Techniques The most frequently used methods for detection of proteins following separation by CE are UV absorbance, LIF and MS. Other less common detection techniques include amperometric and chemiluminescence. 133,134 UV absorbance is by far the most popular detection method, since no derivatization is required. It is simple, and it can be performed on-column. Detection is typically performed at 214 nm, although 254 and 280 nm can also be used. A major limitation of 35
53 UV absorbance is the relatively poor concentration detection limits (mm to μm). Detection cells, such as Z-shape and bubble shape, with increased path length have been developed to address this issue. However, these novel designs compromise analyte resolution. For applications in which high sensitivity is needed, LIF is preferred. Nevertheless, the need for a derivatization step, either pre-column, on-column, or postcolumn, imposes additional complexity in the analysis. In addition, derivatization of analytes at low concentrations is challenging. Native fluorescence detection relies on the fluorescence properties of aromatic groups such as tryptophan and tyrosine amino acids in peptides and proteins. Both one photon and two photon native fluorescence detection techniques have been developed. MS is the detection method of choice when both sensitivity and structural information are desired. 133, Capillary Electrophoresis-Mass Spectrometry in Proteomics The high separation efficiency, rapid analysis time and low sample and buffer consumption characteristics of CE, in combination with the high sensitivity and structural information afforded with MS, make CE-MS an attractive technology for proteomics. 135,136 Numerous reports involving the application of CE-MS to the analysis of biopolymers can be found in the literature. A challenge with coupling CE to MS is to conserve the separation quality attained with CE. 135 It is evident that the ionization method as well as the interface design are essential to success. 135, Currently, the electrospray ionization source appears to be the most appropriate for on-line CE-MS. In electrospray ionization, ions are directly produced from a liquid phase. Basically, the ionization process involves the spraying of an analyte solution from 36
54 a needle tip to form charged droplets. Under the influence of an electric field, these charged droplets then undergo shrinking by solvent evaporation to form pseudomolecular ions, which are further evaporated and sampled into vacuum to produce an ion beam. 141 Requirements of any CE-MS interface include compatibility with the low flow rates characteristic of CE and absence of induced pressure driven flow. A concern when coupling CE to MS is the volatility of the separation buffer. The use of volatile buffers such as ammonium acetate and formic acid is preferred to avoid issues regarding ion suppression, although applications involving the use of non-volatile buffers have been reported, especially for liquid sheath interfaces. Two types of interfaces (sheathless and liquid sheath) have been described. 140 In the sheath flow interface, a low flow of liquid (1-5 μl/min), the purpose of which is to generate electrical contact with the CE effluent and facilitate electrospraying of buffers, is introduced along the CE capillary. The liquid sheath is typically composed of organic solvents such as methanol and organic acids such as formic and acetic acid. A drawback of this strategy is that because the method is based on the introduction of an additional flow, sensitivity is sacrificed. Also, chemical noise due to the concomitant introduction of charged species from the liquid sheath is unavoidable. Consequently, interest in the development of interfaces (sheathless) that do not rely on the introduction of an additional liquid continues to grow. 137 The key factor in designing a sheathless interface is to create electrical contact of the CE capillary with the ESI tip. Methods have been developed for coupling CE to MS via sheathless interfaces. Electrical contact has been accomplished by coating the end of the separation capillary with a conductive material such as gold. Etching of a portion of the 37
55 CE capillary with HF offers an alternative to creating electrical contact. Currently, the sheathless interface is the most efficient interface, since analyte dilution does not occur. Better sensitivity is the result. Additionally, the flow rates (nl/min) are compatible with those in CE. Nevertheless, flexibility in the choice of the CE buffer electrolyte is less with this interface. 137 In addition, these interfaces might be more difficult to prepare as compared to liquid sheath interfaces. 135,138, It is interesting, however, that even with the low detection limits attainable with MS (i.e., picograms to femtograms), CE-MS still suffers from poor concentration limits of detection (μm). One of the main reasons for this limitation is the low sample injection volumes (nl) associated with CE. This has hampered the applicability of CE-MS to the analysis of biological samples. A solution to this problem is to incorporate a preconcentration step prior to CE-MS. 76,133,134,141,142 This approach has been described by several authors. When a selective preconcentration technique is coupled on-line to CE and hyphenated to MS, a very powerful multidimensional technique is created. Janini et al. 134 developed an on-line integrated membrane solid-phase extraction-ce-ms for the analysis of standard peptides and protein digests. Coupling was accomplished via a sheathless interface, which was prepared by etching a small section of the CE capillary with HF acid to create a porous junction for electrical contact. The spray tip formed part of the CE capillary, and it was created by reducing the external diameter of the capillary either by etching the end part of the capillary with HF or by heating the end of the capillary while pulling. Concentration limits of detection were lowered to the nm range. Tomlinson and Naylor 87 combined membrane preconcentration-ce-ms for applications involving peptide analysis. When a transient isotachophoresis step was incorporated after 38
56 peptide elution, remarkably high separation efficiencies (10 6 theoretical plates) were achieved. A common characteristic of these on-line preconcentration-ce-ms approaches is that contamination of the ESI-MS interface is avoided due to simultaneous sample clean-up during preconcentration Modern Trends in Proteomics A present trend in proteomics is to probe the differential expression of proteins. To accomplish this, miniaturization of the analytical system and integration of sample processing is critical. A striking advantage of miniaturization is enhanced sample throughput. Microfluidics interfaced with MS are currently being applied to proteins by several groups. Lab on a chip miniaturized systems that incorporate sample preparation (i.e., clean-up, enrichment, and chemical reactions), separation and detection in a single device, are continuously gaining interest in the area of proteomics research. Microfluidics offer the possibility for multitask processes ranging from cell lysing to enzymatic digestion and peptide labeling followed by separation and LIF or MS detection. 143,144 Various sample preparation and concentration techniques have been incorporated in microdevices. Basically, all existing electrophoretic methods have already been downscaled to microchips, and several two-dimensional separations have been accomplished in this format. Hyphenation of microchips with MS is still in its infancy, with many improvements in interface designs to be made. Surprisingly, sample preparation is probably the most neglected step in microfluidics. It is a fact that any success in proteomics research will largely depend on innovative advances in separation science. 143,144 39
57 As mentioned, sample preparation is lagging behind in microfluidics, and remains the major hurdle to fully miniaturize the complete proteomics platform. 143,144 There is clearly a need for implementation of versatile sample preparation and concentration methods in microdevices Dissertation Overview Chapters 2 and 3 present my progress on the design and evaluation of preconcentration systems for capillary zone electrophoresis using polymer methacrylate based monoliths. Application of these systems to the analysis of proteins in complex samples such as human serum is demonstrated. Chapter 2 is devoted to the development of a coupled monolithic preconcentratorcapillary zone electrophoresis system for the extraction of immunoglobulin G from human serum. Protein G was covalently bound to a glycidyl methacrylate monolith synthesized at the inlet end of a surface modified fused silica capillary column. The effectiveness of the system to rapidly extract and concentrate immunoglobulin G from diluted (65,000 times) human serum samples is demonstrated. Chapter 3 describes the design of a coupled affinity-hydrophobic monolithic column for on-line removal of IgG, preconcentration of low abundance proteins, and separation by capillary zone electrophoresis. Chapter 4 presents the fabrication of polymeric monolithic columns coated with polyelectrolyte layers for protein analysis. Polymer monoliths were prepared by in situ polymerization of methacrylate monomers. The monoliths were coated with a water soluble polymer, yielding quaternary ammonium functionality on the surface. Analysis 40
58 of standard proteins by ion exchange LC and CEC is demonstrated. Chapter 5 is a recompilation of recommendations for future work. 41
59 1.12 REFERENCES 1. V. Badoc, U. Steinhusen, K. Bommert, A. Otto, Electrophoresis 22 (2001) N.I. Govorukhina, A.K. Gunnink, A.G.J. van der Zee, S. de Jong, H.W.A. de Bruijn, R. Bischoff, J. Chromatogr. A 1009 (2003) K. Schefcheck, X. Yao, C. Fenselau, Anal. Chem. 22 (2003) H.M. Georgiou, G.E. Rice, M.S. Baker, Proteomics 1 (2001) M.A. Strausbauch, J.P. Landers, P.J. Wettstein, Anal. Chem. 68 (1996) D.L. Rothemund, V.L. Locke, A. Liew, T.M. Thomas, V. Wasinger, D.B. Rylatt, Proteomics 3 (2003) A. Butt, M.D. Davinson, G.J. Smith, J.A. Young, S.J. Gaskell, S.G. Oliver, R.J. Beynon, Proteomics 1 (2001) J. Chen, C.S. Lee, Y. Shen, R.D. Smith, E.H. Baehrecke, Electrophoresis 23 (2002) F. Giorgianni, D.M. Desiderio, S.B. Giorgianni, Electrophoresis 24 (2003) P.E. Michel, F. Reymond, I.L. Arnaud, J. Josserand, H.H. Girault, J.S. Rossier, Electrophoresis 21 (2003) L.J. Janis, F.E. Regnier, 61 (1989) M.N. Albarghouthi, T.M. Stein, A.E. Barron, Electrophoresis 24 (2003) A. Riggin, F.E. Regnier, Anal. Chem. 63 (1991) R. Pieper, Q. Su, C.L. Gatlin, S.T. Huang, N.L. Anderson, S. Steiner, Proteomics 3 (2003) P.G. Righetti, A. Castagna, P. Antonioli, E. Boschetti, Electrophoresis 26 (2005)
60 16. H.J. Issaq, T.P. Conrads, G.M. Janini, T.D. Veenstra, Electrophoresis 23 (2002) Q.Y. He, G.K.K, Lau, Y. Zhou, S.T. Yuen, M.C. Lin, H.F. Kung, J.F. Chiu, Proteomics 3 (2003) L.F. Steel, D. Shumpert, M. Trotter, S.H. Seeholzer, A.A. Evans, W.T. London, R. Dwek. T.M. Block, Proteomics 3 (2003) A. Harder, A. Ackemann, J. Beck, B. Muehlenweg, W. Brenner, S. Melchior, R. Kellner, F. Lottspeich, Proteomics 3 (2002) K. Karlsson, N. Cairns, G. Lubec, M. Fountoulakis, Electrophoresis 20 (1999) S. J. Cordwell, A. S. Nouwens, N. M. Verrills, D. J. Basseal, B. J. Walsh, Electrophoresis 21 (2000) F. Talamo, C. D Ambrosio, S. Arena, P. D. Vecchio, L. Ledda, G. Zehender, L. Ferrara, A. Scaloni, Proteomics 3 (2003) C. Navarre, H. Degand, K.L. Bennett, J.S. Crawford, E. Mørtz, M. Boutry, Proteomics 2 (2002) F. S. Schütt, J. Aström, I. Olsson, A. Eklund, J. Grunewald, B. Bjellqvist, Electrophoresis 21 (2000) J.N. Adkins, S.M. Varnum, K.J. Auberry, R.J. Moore, N.H. Angell, R.D. Smith, D.L. Springer, J.G. Pounds, Molecular & Cellular Proteomics, (2002) M. Fountoulakis, M.F. Takács, P. Berndt, H. Langen, B. Takács, Electrophoresis 20 (1999) K. Kubo, E., M. Imoto, Y. Morishima, Electrophoresis 21 (2001)
61 28. Y.Y. Wang, P.C.P. Cheng, D.W. Chan, Proteomics 3 (2003) Y.Y. Chen, S.Y. Lin, Y.Y. Yeh, H.H. Hsiao, C.Y. Wu, S.T. Chen, A.H.J. Wang, Electrophoresis 26 (2005) D. A. Colantonio, C. Dunkinson, D.E. Bovenkamp, J.E. Van Eyk, Proteomics 5 (2005) N. Ahmed, G. Barker, K. Oliva, D. Garfin, K. Talmadge, H. Georgiou, M. Quinn, G. Rice, Proteomics 3 (2003), D. Neri, Proteomics 6 (2006) T. Manabe, Electrophoresis 21 (2000) H.J. Issaq, Electrophoresis 22 (2001) Y. Shen, R.D. Smith, Electrophoresis 23 (2002) A.K. Ottens, F.H. Kobeissy, R.A. Wolper, W.E. Haskins, R.L. Hayes, N.D. Denslow, K.K.W. Wang, Anal. Chem. 77 (2005) M. Ramström, M. Palmblad, K.E. Markides, P. Håkansson, J. Bergquist, Proteomics 3 (2003) E.A.S. Doherty, R.J. Meagher, M.N. Albarghouthi, A.E. Barron, Electroctrophoresis 24 (2003) F.A. Chen, J. Chromatogr. 559 (1991) M.A. Jenkis, E. Kulinskaya, H.D. Martin, M.D. Guerin, J. Chromatogr. B 672 (1995) R. Lehmann, W. Voelter, H.M. Liebich, J. Chromatogr. B 697 (1997) S.C. Beale, Anal. Chem. 70 (1998) 279R. 43. V. Dolník, K.M. Hutterer, Electrophoresis 22 (2001)
62 44. W.W.C. Quigley, N.J. Dovichi, Anal. Chem. 76 (2004) H. Stutz, G. Bordin, A.R. Rodriguez, Electrophoresis 25 (2004) T. Hirokawa, A. Ohmori, Y. Kiso, J. Chromatogr. 634 (1993) P. Gebauer, P. Boček, Electrophoresis 23 (2000) I. Morita, J. Chromatogr. 641 (1993) J.A. Wells, H. Swerdlow, Anal. Chem. 75 (2003) M.R. Schure, A.M. Lenhoff, Anal. Chem. 65 (1993) K. Srinivasan, C. Pohl, N. Avdalovic, Anal. Chem. 69 (1997) M. Gilges, M.H. Kleemiss, G. Schomburg, Anal. Chem. 66 (1994) B. Verzola, C. Gelfi, P.G. Righetti, J. Chromatogr. A 874 (2000) D. Belder, A. Deege, H. Husmann, F. Kohler, M. Ludwig, Electrophoresis 22 (2001) J. Horvath, V. Dolnik, Electrophoresis 22 (2001) H.H. Lauer, D. McManigill, Anal. Chem. 58 (1986) R.S. Shah, Q. Wang, M.L. Lee, J. Chromatogr. A 952 (2002) A. Malik, Z. Zhao, M.L. Lee, J. Microcol. Sep. 5 (1993) W.L. Tseng, H.T. Chang, Anal. Chem. 72 (2000) M. Huang, W.P. Vorkink, M.L. Lee, J. Microcol. Sep. 4 (1992) A.M. MacDonald, M.A.W. Sheppard, C.A. Lucy, Electrophoresis 26 (2005) Y. Liu, J.C. Fanguy, J.M. Bledsoe, C.S. Henry, Anal. Chem. 72 (2000) D. Schmalzing, C.A. Piggee, F. Foret, E. Carrilho, B.L. Karger, J. Chromatogr. A 652 (1993)
63 64. M. Gilges, H. Husmann, M.H. Kleemiβ, S.R. Motsch, G. Schomburg, J. High. Resolut. Chromatogr. 15 (1992) K.A. Cobb, V. Dolnik, M. Novotny, Anal. Chem. 52 (1990) Z. Zhao, A. Malik, M.L. Lee, Anal. Chem. 65 (1993) J. Zhang, C. Horváth, Electrophoresis 24 (2003) N.H.H. Heegaard, S. Nilsson, N.A. Guzman, J. Chromatogr. B 715 (1998) Cifuentes, M. Frutos, J.M. Santos, J.C.D. Masa, J. Chromatogr. A 655 (1993) M.H.A. Busch, J.C. Kraak, H. Poppe, J. Chromatogr. A 695 (1995) H. Katayama, Y. Ishihama, N. Asakawa, Anal. Chem. 70 (1998) J.R. Catai, H.A. Tervahauta, G.J. Jong, G.W. Somsen, J. Chromatogr. A 1083 (2005) H. Katayama, Y. Ishiham, N. Asakawa, Anal. Chem. 70 (1998) J.P. Quirino, M.T. Dulay, R.N. Zare, Anal. Chem. 73 (2001) J.P. Quirino, M.T. Dulay, B.D. Bennett, R.N. Zare, Anal. Chem. 73 (2001) A.J. Tomlinson N.A. Guzman, S. Naylor, J. Cap. Elec. 6 (1995) D.M. Osbourn, D.J. Weiss, C.E. Lunte, Electrophoresis 21 (2000) J.C.M. Waterval, G. Hommels, J. Teeuwsen, A. Bult, H. Lingeman, W.J.M. Underberg, Electrophoresis 21 (2000) N.M. Vizioli, C.N. Carducci, C. Peña, N.A. Guzman, J. Cap. Elec. and Microchip Tech. (1999) M. Albin, P.D. Grossman, S.E. Moring, Anal. Chem. 65 (1993) 489A. 81. R.L. Chien, D.S. Burgi, Anal. Chem. 64 (1992) 489A. 46
64 82. T. Stroink, E. Paarlber, J.C.M. Waterval, A. Bult, W.J.M. Underberg, Electrophoresis 22 (2001) M. Rowena, N. Monton, K. Imami, M. Nakanishi, J.B. Kim, S. Terabe, J. Chromatogr. A 1079 (2005) S.J. Wang, W.L. Tseng, Y.W. Lin, H.T. Chang, J. Chromatogr. A 979 (2002) Z.K. Shihabi, J. Chromatogr. A 744 (1996) A.J. Tomlinson, L.M. Benson, N.A. Guzman, S. Naylor, J. Chromatogr. A 744 (1996) A.J. Tomlinson, S. Naylor, J. Cap. Elec. 5 (1995) J.J. Dalluge, L.C. Sander, Anal. Chem. 70 (1998) N.A. Guzman, J. Chromatogr. B 749 (2000) N.A. Guzman, Electrophoresis 24 (2003) L.G. Rashkovetsky, Y.V. Lyubarskaya, F. Foret, D.E. Hughes, B.L. Karger, J. Chromatogr. A 781 (1987) A.M. Hoyt, S.C. Beale, J.P. Larmann, J.W. Jorgenson, J. Microcol. Sep. 5 (1993) N.E. Baryla, N.P. Toltl, Analyts 128 (2003) N.A. Guzman, J. Liquid Chromatogr. 16 (1995) J. Cai, Z. El Rassi, J. Liq. Chromatogr. 16 (1993) L.J. Cole, R.T. Kennedy, Electrophoresis 16 (1995) M.E. Swartz, M. Merion, J. Chromatogr. 632 (1993) E. Rohde, A.J. Tomlinson, D.H. Johnson, S. Naylor, J. Chromatogr. B 713 (1998)
65 99. A.J. Tomlinson, S. Naylor, J. Chromatogr. B 697 (1997) Zhang, S. Hjertén, Anal. Chem. 69 (1997) X.Z. Wu, A. Hosaka, T. Hobo, Anal. Chem. 70 (1998) W. Wei, E.S. Yeung, Anal. Chem. 74 (2002) B. Yang, F. Zhang, H. Tian, Y. Guan, J. Chromatogr. A, 1117 (2006) D. Schaller, E.F. Hilder, P.R. Haddad, Anal. Chim. Acta 556 (2006) J.P. Hutchinson, P. Zakaria, A.R. Bowie, M. Macka, N. Avdalovic, P.R. Haddad, Anal. Chem. 77 (2005) J.M. Armenta, B. Gu, P.H. Humble, C.D. Thulin, M.L. Lee, J. Chromatogr (2005) N.V. Vizioli, M.L. Rusell, M.L. Carbajal, C.N. Carducci, M. Grasselli, lectrophoresis 26 (2005) M. Zhang, F. Wei, Y.F. Zhang, J. Nie, Y.W. Feng, J. Chromatogr. A ) W.C. Lee, K.H. Lee, Anal. Biochem. 324 (2004) D.S. Hage, J. Chromatogr. B 715 (1998) N. Delaunay, V. Pichon, M.C. Hennion, J. Chromatogr. B 745 (2000) W. Nashabeh, Z. El Rassi, J. Chromatogr. 596 (1992) L. Licklider, W.G. Kuhr, M.P. Lacey, T. Keough, M.P. Purdon, R.Takigiku, Anal. Chem. 67 (1995) S. Hjérten, J.L. Liao, R. Zhang, J. Chromatogr. 473 (1989) E.C. Peters, M. Petro, F. Svec, J.M.J. Fréchet, Anal. Chem. 70 (1998) D. Moravcová, P. Jandera, J. Urban, J. Planeta, J. Sep. Sci, 27 (2004)
66 117. S.L. Gac, J. Carlier, J.C. Camart, C. Cren-Olivé, C. Rolando, J. Chromatogr. 808 (2004) A. Palm, M.V. Novotny, Anal. Chem. 69 (1997) F. Svec, J. Sep. Sci. 27 (2004) K. Miyabe, G. Guiochon, J. Sep. Sci. 27 (2004) T. Rohr, E.F. Hilder, J.J. Donovan, F. Svec, J.M.J. Fréchet, Macromolecules 36 (2003) S. Xie, F. Svec, J.M.J. Fréchet, Chem. Mater. 10 (1998) Q. Luo, H. Zou, Q. Zhang, X. Xiao, J. Ni, Biotechnol Bioeng 80 (2002) Z. Pan, H. Zou, W. Mo, X. Huang, R. Wu, Anal. Chim. Acta 466 (2002) M. Bedair, Z. El Rassi, J. Chromatogr. A 1044 (2004) R. Hahn, A. Podgornik, M.Merhar, E. Schallaun, A. Jungbauer, Anal. Chem. 73 (2001) C. Kasper, L. Meringova, R. Freitag, T. Tennikova, J. Chromatogr. A 798 (1998) N.D. Ostryanina, G.P. Vlasov, T.B. Tennikova, J. Chromatogr. A 949 (2002) T.V. Gupalova, O.V. Lojkina, V.G. Pàlàgnuk, A.A. Totolian, T.B. Tennikova, J. Chromatogr. A 949 (2002) B. Gu, J.M. Armenta, M.L. Lee, J. Chromatogr. A 1079 (2005) D.S. Peterson, T. Rohr, F. Svec, J.M.J. Fréchet, Anal. Chem. 75 (2003) A. Yu, M.H. Davey, F. Svec, J.M.J. Fréchet, Anal. Chem. 73 (2001) K. Hutterer, V. Dolnik, Electrophoresis 24 (2003)
67 134. G.M. Janini, M. Zhou, L.R. Yu, J. Blonder, M. Gignac, T.P. Conrads, H.J. Issaq, T.V. Veenstra, Anal. Chem. 75 (2003) R.D. Smith, J.H. Wahl, D.R. Goodlett, S.A. Hofstadler, Anal. Chem. 65 (1993) 574A L.J. Deterding, J.M. Cutalo, M. Khaledi, K.B. Tomer, Electrophoresis 23 (2002) M. Matthias, Org. Mass Spectrom. 25 (1990) J.A. Olivares, N.T. Nguyen, C.R. Yonker, R.D. Smith, Anal. Chem. 59 (1987) I.M. Lazar, B. Xin, M.L. Lee, Anal. Chem. 69 (1997) W.M.A. Niessen, U.R. Tjaden, J. van der Greef, J. Chromatogr. 636 (1993) W.J.M. Underberg, Electrophoresis 22 (2001) J.L.P. Thibault, A. Martin, J.C. Richards, W.W. Wakarchuk, W.V.D. Wilp, J. Chromatogr. A 817 (1998) C. Roussel, J. Josserand, H. Jensen, J.S. Rossier, M. Przybylski, H.H. Girault, Electrophoresis 24 (2003) J. Bergkvist, S. Ekström, L. Wallman, M. Löfgren, G.M. Varga, J. Nilsson, T. Laurell, Proteomics 2 (2002)
68 2 DESIGN AND EVALUATION OF A COUPLED MONOLITHIC PRECONCENTRATOR-CAPILLARY ZONE ELECTROPHORESIS SYSTEM FOR THE EXTRACTION OF IgG FROM HUMAN SERUM 2.1 Introduction The analysis of proteins in biological fluids by capillary electrophoresis (CE) is of interest in clinical chemistry. 1 However, poor concentration limit of detection is the major drawback of CZE that limits its applicability to the analysis of trace components. 2-5 The combination of preconcentration methods on-line with CZE should provide a powerful analytical tool for the analysis of low abundance proteins An on-line preconcentration-ce method that can selectively preconcentrate any protein for which an antibody is available would be very useful for the analysis of low abundance proteins and would establish CE as a major tool in biomarker discovery To accomplish this, an on-line protein G monolithic preconcentration-cze system for enrichment and separation of proteins was developed and characterized. The new system exploits the properties of monoliths as preconcentration devices before CZE separation. To generate active groups for protein immobilization, glycidyl methacrylate (GMA) was used to prepare polymer monoliths. A cm monolith was cast inside a 75 µm i.d. fused silica capillary that had previously been coated with alternating layers of negatively (dextran) and positively (polybrene) charged polymers. Protein G was covalently bound to GMA. Monoliths from different formulations were prepared and evaluated for binding capacity to optimize the monolith formulation for protein preconcentration. The physical properties of the column considered best for 51
69 preconcentration were determined by mercury intrusion porosimetry. The total pore area was 4.8 m 2 /g, the average pore diameter was 3.3 µm and the porosity was 82%. The monolith had a low flow resistance and was macroscopically homogeneous. The effectiveness of the monolith to rapidly preconcentrate proteins at flow rates as high as 10 µl/min was demonstrated using a 1.8 µm IgG solution. This system proved effective for on-line sample extraction, clean-up, preconcentration, and CE of IgG in human serum. IgG from diluted (500 and 65,000 times) human serum samples was successfully analyzed using this system. The approach can be applied to the on-line preconcentration and analysis of any protein for which an antibody is available. 2.2 Experimental Chemicals Anhydrous methanol, acetone and hexanes were purchased from Mallinckrodt Chemicals (Phillipsburg, NJ, USA). Cyclohexanol was from Fisher Scientific (Fair Lawn, NJ, USA). Formic acid was from Anachemia Canada (Montréal, Canada). Dextran sulfate sodium salt, hexadimethrin bromide (polybrene), GMA 97%, 3- (trimethoxysilyl)propyl methacrylate (γ-mpts), trimethylolpropane trimethacrylate (TRIM) and 2,2-dimethoxy-2-phenylacetophenone (DMPA) 99% were supplied by Sigma-Aldrich (Milwaukee, WI, USA). Ammonium formate and phosphate buffered saline (PBS) 10X solution (ph 7.4 ± 0.1) were also supplied by Fisher Scientific. Sodium carbonate monohydrate and sodium bicarbonate were from EM Science (Darmstadt, Germany). Protein G, recombinant E. coli, and human immunoglobulin G (IgG) were purchased from Calbiochem (La Jolla, CA, USA). Buffer solutions were 52
70 prepared with deionized water from a Millipore water purifier (Molsheim, France) and filtered through a 0.22 µm filter Capillary zone electrophoresis Fused silica capillary tubing with 75 µm i.d. and 365 µm o.d. was obtained from Polymicro Technologies (Phoenix, AZ, USA). Capillary electrophoresis (CE) experiments were performed with a Crystal CE 300 system (ATI, Madison, WI, USA) equipped with an online Crystal 100 variable wavelength UV-Vis absorbance detector and a Chrom Perfect software work station (Mountain View, CA) for data collection and treatment. On-column UV detection was performed at 214 nm. Electropherograms were converted to a CP Tab delimited raw file with RT and redrawn using Microsoft Excel (Redmond, WA, USA) Monolithic preconcentrator design and evaluation Capillary surface deactivation. Capillary surface deactivation was accomplished by depositing alternating thin films of physically adsorbed negatively (dextran) and positively (polybrene) charged polymers. A methodology similar to that described by Katayama and co-workers 28 with some modifications was applied. Briefly, using a syringe pump (Model 11, Harvard Apparatus, Holliston, MA, USA) with a 1 ml plastic syringe fitted with a stainless steel needle, a 75 µm i.d. fused silica capillary was washed consecutively with acetone, deionized water, 0.2 M HCl, deionized water, 0.2 M NaOH and deionized water for 30 min each at 10 µl/min. The capillary was then rinsed with a 10% polybrene solution at 5 µl/min for 30 min and allowed to sit for 15 min. Next, the capillary was washed with a 6% dextran solution at 5 µl/min for 30 min and left for 15 53
71 min. Finally, the capillary was rinsed again with 10% polybrene solution at 5 µl/min for 30 min and left for 1 h. Non-adsorbed polymer was washed away with H 2 O. Preparation of polymer monoliths. The surface deactivated capillary was dried using a stream of nitrogen for 1 h. At 5 cm from the inlet end, a 2 cm length of the capillary was etched with concentrated sulfuric acid to remove the outer polyimide coating to generate a UV transparent window for polymerization of the monolith. The monomer mixture was prepared in a 1 dram (4 ml) glass vial by admixing in sequence DMPA (initiator), TRIM (cross-linker), GMA (monomer) and cyclohexanol, methanol and hexane (porogens), and ultrasonicating for 5 min before use. This monomer solution was introduced into the capillary by the use of capillary action. Polymerization in the UV transparent region of the capillary was induced using a Dymax 5000 AS UV curing lamp (Torrington, CT, USA). The UV curing lamp can produce an irradiation intensity of 200 mw/cm 2 in the wavelength range of nm. The irradiation time was varied from 8-15 min. Unreacted monomer and porogens were flushed out of the capillary by rinsing with 1 ml of methanol. More details on the composition of the reagent solution for various monoliths used in this study for protein preconcentration are provided in Section Immobilization of protein G on polymer monoliths. Protein G was immobilized on GMA monolithic columns following a procedure similar to that described by Tennikova. 29 Briefly, using a syringe pump (Model 11, Harvard Apparatus, Holliston, MA, USA) with a 1 ml plastic syringe fitted with a stainless steel needle, the monolithic capillary column was washed consecutively with ethanol, ethanol-h 2 O (1:1), H 2 O and 0.1 M sodium carbonate buffer (ph 9.3) for 30 min each at 2 µl/min. A solution of
72 mg/ml protein G dissolved in 0.1 M sodium carbonate buffer (ph 9.3) was then pumped through the monolithic column for 20 min at 0.4 µl/min. Using silicone rubber, both ends of the capillary were sealed. The monolithic column was then heated to 34 C for 20 h in an oven. Noncovalently bound protein was washed away with 0.1 M sodium carbonate buffer (ph 9.3), followed by 50 mm ammonium formate-formic acid buffer, ph 7.6. The monolithic column was stored in this last buffer at 4 C until used. Detection window preparation. The protein G monolithic preconcentrator capillaries were cut in lengths of 64 cm, and a detection window was burned at 53 cm from the inlet end Scanning electron microscopy (SEM) An aliquot of 0.3 g of optimized monolithic precursor solution, prepared as outlined in Section 2.2.3, was dispensed into a 1 dram (4 ml) glass vial and irradiated under the UV lamp for 8 min. The bulk monolith was carefully removed by breaking the glass vial, cut into peaces with a razor blade, Soxhlet extracted with methanol overnight and placed in a vacuum oven at 60 C overnight. SEM images were obtained of the dry monolith. The monolith was sputtered with ~20 nm gold, and SEM images were taken using an FEI Philips XL30 ESEM FEG (Hillsboro, OR, USA) Porous properties The physical properties (specific surface area, average pore diameter and porosity) of the bulk monolith were determined by mercury intrusion porosimetry using an Auto Pore IV 9500 V1.03 (Micromeritics, Norcross, GA, USA). 55
73 2.2.6 Capillary liquid chromatography To investigate the influence of the monolith formulation on binding capacity, and to evaluate the effect of the speed of sample application on protein adsorption, affinity LC experiments were conducted. Capillary LC experiments were performed using a syringe pump (Model 11, Harvard Apparatus, Holliston, MA, USA) with a 25 µl Hamilton gastight syringe (Reno, NV, USA) fitted with a stainless steel needle, a Linear Scientific Uvis 203 detector (Reno, NV, USA), and a Thermo Separations PC1000 V3.0 software work station (Fremont, CA, USA) for data collection and treatment. Affinity LC experiments were performed as follows. The capillary was conditioned with PBS for 5 min at 1 µl/min. Following injection of IgG solution in PBS for a set amount of time at a set flow rate, the capillary was sequentially rinsed with PBS for 5 min at 1 µl/min and 20 mm HCl at 0.5 µl/min. Eluted IgG was detected at 214 nm. The total length of the capillary was 20 cm and the effective length was 15 cm On-line preconcentration-cze of IgG On-line preconcentration-cze of IgG was achieved as follows. First, the protein G monolithic preconcentrator capillary was conditioned with 50 mm ammonium formateformic acid buffer, ph 7.6 (binding buffer), for 6 min at 1 bar. An IgG solution was then loaded for a set amount of time at 1 bar. Unbound protein was washed away by rinsing with binding buffer for 6 min at 1 bar. Following preconditioning of the capillary with 12.5 mm ammonium formate-formic acid, ph 7.6 (separation buffer), IgG was desorbed from the protein G monolith by injecting a small plug (equivalent to three times the monolith length, ~1 bar for 0.3 min) of 50 mm formic acid (elution buffer). A plug of equal length of separation buffer was next injected. Eluted IgG was electrophoresed 56
74 along the separation capillary and detected by UV absorption. The applied voltage was 15 kv and the detection wavelength was 214 nm On-line extraction and preconcentration of IgG from human serum Venous blood was obtained from a healthy volunteer. Blood samples were collected in a Greiner Bio-one Vacuette tube containing Z Serum separation clot activator (Longwood, FL, USA) and centrifuged at 4 C at 3600 rpm for 12 min. Separated serum was stored at -80 C until used. Thawed serum samples were diluted 1:10 in 50 mm ammonium formate-formic acid (ph 7.6), sonicated for 20 s and heated at 95 C for 5 min Results and Discussion Monolithic preconcentrator design and evaluation Capillary surface deactivation. It became evident early in the experiments that nonspecific adsorption of proteins on the surface of the capillary could be problematic. Initial experiments were performed using a capillary with an inner surface that had previously been treated with γ-mpts to ensure covalent bonding of the monolith to the capillary wall. Unfortunately, this capillary soon proved to non-specifically adsorb proteins during the preconcentration step (see Section 2.3.2). This phenomenon was not surprising since nonspecific interactions (van der Waals, hydrophobic and electrostatic) between proteins and surfaces always exist. Permanent coating of the surface of the capillary with polymers that are either covalently bonded or physically adsorbed to the surface of the capillary may be the most effective way of deactivation. 28 Accordingly, the first step in the design of the analyte preconcentrator-ce system involved the deactivation of the fused silica capillary surface. Protein compatibility and coating 57
75 stability were two of the criteria for selection of the polymeric materials. Additionally, stability of the monolith within the coated capillary had to be ensured. Even though the surface chemistry of silica is well established and understood, there is not a single coating that will work for all protein analyses. Therefore, the selection of the coating material and method largely depends on the particular application. Considerable effort was spent developing a reliable coating procedure. Neutral polymeric coatings such as poly(vinyl pyrrolidone), poly(ethylene-propylene glycol), poly(ethylene glycol), polyacrylamide and poly(vinyl alcohol) were investigated for their stability, performance and effectiveness to suppress the electroosmotic flow. Because the ultimate goal was to evaluate the protein G monolithic preconcentrator, human IgG, with very high affinity towards protein G, was the protein of choice for the experiments. The ph, concentration and nature of the background electrolyte were among the variables evaluated to determine appropriate CE separation conditions for IgG. The challenge here was to find a discontinuous background electrolyte system compatible with both steps, preconcentration and CE. Several experiments were run using a combination of discontinuous buffer systems. Acetate, borate, Tris and formate were among the background electrolyte buffers tested. Acetic acid, HCL-glycine and formic acid were among the sample buffers tested. With the buffer systems utilized in this study, all polymers tested provided rather poor separation efficiencies (~10,000 theoretical plates) for IgG. In addition, reproducibility of the analysis was affected due to protein adsorption. The most satisfactory separations were obtained using a 50 mm borate (ph 9.2), 20 mm HCl-glycine discontinuous buffer system. However, Joule heating was a problem with these buffers. To avoid bubble formation, the initial applied 58
76 voltage had to be set as low as 5 kv for a period of time (10 min), after which the voltage could be increased to higher values (15 kv). Charged polymers offer an alternative to neutral polymers for surface deactivation. Successive multiple ionic layer coatings have proven to be chemically stable and useful for biological sample analysis. Katayama and co-workers 28 developed a method to coat fused silica capillaries with successive multiple ionic polymer layers of polybrene and dextran. Highly efficient separations with good reproducibility were reported using this methodology. A similar approach was applied to passivate the surface of the fused silica capillary. PB(3) coated capillaries provided efficient and reproducible separations for IgG. A suitable discontinuous buffer for the CE of IgG was determined to be 12.5 mm ammonium formate-formic acid (ph 7.6) as the background electrolyte and 50 mm formic acid as the sample buffer. A glycydyl methacrylate monolith was cast inside the inlet end of PB(3) coated capillaries. It should be mentioned that even though the polymer monolith was not explicitly covalently bound to the capillary wall as in many other studies describing monoliths for CEC, the monolith is very stable and did not move at all within the capillary when pressure or high voltage was applied. We believe that an electrostatic mechanism holds the monolith to the positively charged PB(3) coated capillary. As discussed latter in Section 2.3.2, measurements of the EOF of the GMA monolithic capillaries revealed the presence of negative charge on the monolithic support. Monolith preparation. A series of experiments were conducted to produce monoliths with the required characteristics (high surface area, homogeneity and low back-pressure). A reliable method to prepare monolithic preconcentrators was 59
77 developed. GMA was selected as the monomer since it provides monoliths with epoxy groups to which amine groups present in proteins can be immobilized. An ideal monolith for protein preconcentration should have high surface area and low flow resistance. While the surface area mainly comes from the contribution of micropores and mesopores in the skeletal structure, the pressure drop is determined by the median pore diameter of the throughpores. Unfortunately, in most cases, the median pore diameter is correlated with the surface area in a polymer monolith. For example, high surface areas are often accompanied by small throughpores, which results in a concomitant increase in flow resistance. Thus, a balance between surface area and flow resistance must be made. Among the variables to adjust the pore size distribution of a polymer monolith, porogen and initiation technique are the most effective. For the preparation of a suitable poly(gma-co-trim) monolith, a variety of porogens were considered. These ranged from long-chain alcohols, such as cyclohexanol and dodecanol, 26 to low boiling point organic solvents, such as toluene and isooctane. 31 Since the pore size distribution of a polymer monolith is also strongly dependent on the initiation technique used (e.g., thermal vs. UV vs. redox), it is not surprising that an reported recipe developed by one research group cannot be directly implemented by another group without modification. This was true in these experiments, and it was observed that the optimized recipes developed by Pan and co-workers 26 and Viklund and co-workers 31 could not yield a monolith with sufficiently low pressure drop to be used in our CE instrument (1 bar for ~ 2 cm monolith). Thus, new porogens were sought in order to develop a uniform poly(gma-co-trim) monolith with extremely low flow resistance. 60
78 To design the porogen system, two variables were kept constant. In all experiments, the initiator (DMPA) concentration relative to total monomer (GMA+TRIM) concentration was kept at 1%. In addition, the GMA to TRIM ratio was fixed at 60:40 (wt %). Six organic solvents (cyclohexanol, dodecanol, toluene, isooctane, methanol and hexane) were investigated, and classified into three categories based on the final pressure drop of the monolith prepared with the pure organic solvent as porogen. Toluene was classified as a microporogen; cyclohexanol and dodecanol as mesoporogens; and methanol, hexane and isooctane as macroporogens. The final optimized porogen, ensuring macroscopically homogeneous monoliths with low flow resistance (~ 0.6 µl/min at 1 bar for a 2 cm monolith), was determined to be a ternary system composed of methanol, hexane and cyclohexanol. Several optimized recipes based on this ternary porogen are listed in Table 2.1. Protein G was immobilized on monoliths prepared according to the recipes listed in Table 2.1. These protein G monoliths were used to investigate the effect of monolith formulation on binding capacity. To determine the binding capacity of the monolithic preconcentrator, the protein G monolith was saturated with an IgG solution and the area of the eluted peak was measured. All experiments were performed using affinity capillary liquid chromatography (see Section 2.2.6). Figure 2.1 shows the influence of monolith formulation on binding capacity. From Figure 2.1, for the monolith formulations studied, there was no significant effect of the composition of the monolithic precursor solution on binding capacity. 61
79 Table 2.1. Compositions of the optimized monolithic preconcentrator formulations used in this study to evaluate the effect of monolith formulation on binding capacity. a Monolith DMPA TRIM GMA Cyclohexanol Methanol Hexane a Units are in g. DMAP: 2,2-dimethoxy-2-phenylacetophenone. TRIM: trimethylolpropane trimethacrylate. GMA: Glycidyl methacrylate. 62
80 Peak area Monolith formula Figure 2.1 Influence of monolith formulation on binding capacity. Experimental conditions: 20 cm (15 cm to detector) x 75 µm i.d. fused silica capillary; 2 cm protein G monolithic preconcentrator; 2 mm HCl (0.5 µl/min) elution buffer; UV detection at 214 nm; 300 µg/ml IgG sample; 1 µl/min sample loading flow rate; 15 min sample loading time. The formulas (1,2,3) for all of the monoliths are listed in Table
81 Therefore, monolith rod 2, with the lowest back-pressure, was selected for further characterization. Determination of the physical properties of GMA monolith rod 2. The physical properties of GMA monolith rod 2 were determined using a mercury intrusion porosimeter. Figure 2.2 shows the pore size distribution of this monolith. The total pore area was 4.79 m 2 /g, the average pore diameter was 3.29 µm and the porosity was 82 %. An SEM image of this monolith is provided in Figure 2.3. After the monolith formula was optimized with respect to preconcentration factors, the effect of the monolith length on CE separation efficiency was studied. It is worthwhile to mention that even though the detection limits should be greatly improved with solid phase preconcentrators, separation performance is affected. The efficiency of separation is compromised as a result of the rather large volumes of elution buffer required for complete analyte desorption. Reducing the bed volume of the adsorptive phase can compensate for this. However, a reduced bed volume also means a lower binding capacity, and thus a lower preconcentration factor. Therefore, a compromise between bed volume binding capacity and preconcentrator performance must be found. As a starting point, an arbitrary length of 2 cm monolith was used. Next, the monolith length was gradually reduced down to 0.5 cm, and the effect of monolith length on CE separation efficiency was evaluated. Notice that because of limitations in the pressure system of the CE instrument used, monoliths of more than 2 cm in length were not studied. The separation efficiency was not remarkably affected by the monolith length; 1.5 cm offered a good compromise between binding capacity, separation efficiency and backpressure. Therefore, 1.5 cm was the length used for experiments. 64
82 Log differential intrusion (ml/g) Pore size diameter (µm) Figure 2.2. Pore size distribution of GMA monolithic rod 2 measured by mercury intrusion porosimetry. 65


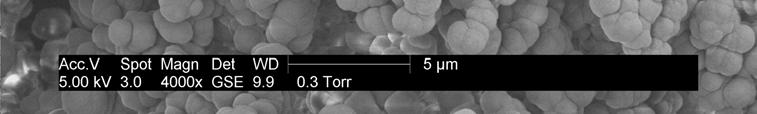
83 Figure 2.3. SEM image of a GMA monolith inside a capillary column. 66
84 Evaluation of the effect of speed of sample application on protein adsorption. Two attributes of monolithic supports are high rate of mass transfer and low flow resistance, which makes fast analysis possible. Therefore, the influence of speed of sample application on protein adsorption was investigated. During the sample loading step, flow rates were varied from 0.5 to 10 μl/min to demonstrate the ability of the monolith to rapidly preconcentrate proteins. All experiments were performed using affinity capillary liquid chromatography (see Section 2.2.6); in all cases, saturation of the protein G monolith occurred. Figure 2.4 shows the influence of speed of sample application on peak area of retained IgG. Figure 2.4 was obtained by loading a constant volume (15 µl) of a 300 μg/ml IgG solution at varying flow rates and measuring the area of the eluted peak. From Figure 2.4, when the flow rate was varied from 0.5 to 10 μl/min, no significant change was observed in the area of the eluted peak, indicating the ability of the monolith to rapidly preconcentrate proteins Method development for on-line preconcentration-ce of IgG In Section 2.3.1, it was discussed that capillaries treated with γ-mpts strongly adsorbed IgG during the preconcentration step. This was not the case for PB(3) coated capillaries. Figure 2.5 demonstrates the effectiveness of PB(3) to prevent non-specific adsorption of IgG on the surface of the capillary during the preconcentration step. To obtain Figure 2.5, a monolithic preconcentrator capillary lacking protein G was used; the baseline was monitored during the preconditioning, loading, washing and elution steps. As seen in Figure 2.5A, the capillary treated with γ-mpts exhibited a peak at 67
85 Peak area Flow rate (µl/min) Figure 2.4. Influence of speed of sample application on peak area of retained IgG. Experimental conditions: 20 cm (15 cm to detector) x 75 µm i.d. fused silica capillary; 2 cm protein G monolithic preconcentrator; 20 mm HCl (0.5 µl/min) elution buffer; UV detection at 214 nm; 300 µg/ml IgG sample; µl/min sample loading flow rate; 15 µl sample volume loaded. 68
86 approximately 60 min. The capillary coated with PB(3) (Figure 2.5B), on the other hand, did not show such a peak. These results suggest that during the preconcentration step, IgG is non-specifically adsorbed on the surface of the capillary treated with γ-mpts, after which it is released as the capillary is rinsed with the elution buffer. This is evidence that PB(3) effectively suppresses the non-specific adsorption of IgG on the capillary wall. To further demonstrate the effectiveness of PB(3) to eliminate protein adsorption, the EOF of the PB(3) coated capillary was measured before and after flushing the capillary with an IgG solution. No significant change in the EOF was observed. Interestingly, the EOF of the PB(3) coated capillary was reversed from anodic to cathodic upon casting of the GMA monolith as observed in Figure 2.6. Figure 2.6A is a typical electropherogram of a neutral marker (DMSO) run on a PB(3) coated capillary, while Figure 2.6B is an electropherogram of the same marker run on a GMA monolithic capillary lacking protein G. A cathodic EOF was still observed for the protein G monolithic capillary, which reveals the presence of negative charges on the monolithic support. Adsorption of buffer ions from the buffer solution have been observed to produce a negative zeta potential on teflon, PP and PMMA column surfaces. 32,33 Therefore, the cathodic EOF was hypothesized to stem from either the presence of impurities (methacrylic acid) in the monomers used to prepare monolithic precursor solutions, or adsorption of buffer ions on the monolithic support. Accordingly, CE of IgG on protein G monolithic preconcentrators was performed using a positive voltage polarity. 69
87 30 25 A UV response (mv) Elution time (min) UV response (mv) B Elution time (min) Figure 2.5. Baseline monitoring of the affinity LC experiment with IgG as sample solution to test the non-specific adsorption of protein on the surface deactivated fused silica capillary. Experimental conditions: 75 cm (64 cm to detector) x 75 µm i.d. fused silica capillary; 2 cm protein G monolithic preconcentrator. The column was flushed with the binding buffer (PBS) for 10 min at 1 bar, after which a 100 µg/ml IgG solution was injected for 20 min at 1 bar. After injection, the column was flushed consecutively with binding buffer (PBS), separation buffer and an elution buffer for 10 min each at 1 bar. Monolithic preconcentrator without protein G: (A) γ- MPTS treated capillary, (B) polybrene coated capillary. 70
88 UV response (mv) A Migration time (min) B UV response (mv) Elution time (min) Figure 2.6. Electropherogram of IgG demonstrating the reversal of the EOF upon casting a GMA monolith inside a polybrene coated fused silica capillary. Experimental conditions: 70 cm (57 cm to detector) x 75 µm i.d. fused silica capillary; neutral marker (DMSO) as sample; 50 mm ammonium formate-formic acid (ph 7.6) separation buffer; UV detection at 214 nm. (A) polybrene coated capillary, - 15 kv applied separation voltage, (B) 1.5 cm GMA monolith cast inside a polybrene coated capillary, +15 kv applied separation voltage. 71
89 It should be mentioned that the separation of IgG after preconcentration on protein G monolithic preconcentrators was only accomplished when the plug of elution buffer (containing the desorbed IgG) was followed by an injection of separation buffer (12.5 mm ammonium formate-formic acid, ph 7.6) sufficient to cover the monolith. Failure to inject separation buffer resulted in re-adsorption of the desorbed IgG on the protein G monolith regardless of voltage polarity. Considering that the charge of IgG is dependent on the ph of the medium and that IgG bears a positive charge when dissolved in elution buffer, re-adsorption was believed to stem from electrostatic interactions between the negatively charged protein G monolith and the positively charged IgG. Figure 2.7 illustrates the steps of on-line preconcentration-ce of IgG. Typical electropherograms of IgG standards at different concentrations (120 nm and 12 nm) preconcentrated using this system are shown in Figure 2.8. It is noteworthy to mention that preconcentration of IgG at concentrations lower than 12 nm is possible, and that the lowest sample concentration that can be detected with this system (or the CLOD of this system) is ultimately determined by the volume of sample injected. Preconcentration of IgG at lower concentrations was demonstrated using more complex samples, such as human serum, which will be discussed later in Section On-line preconcentration-ce of IgG was fairly reproducible. For the preconcentration of a 1.2 µm IgG solution, the average migration time and peak area were 8.46 ± 0.45 min and 1.2 ± x 10 6 µvs, respectively. These results were calculated based on three measurements. Slight variations in migration times can be attributed to protein precipitation issues during the freezing and thawing cycles. 72
90 A PG PG PG PG `````````````````````````````````````````````````````````````````````````````````` `````````````````````````````````````````````````````````````````````````````````` PG ```````````````````````````````````````````````````````````````` B PG PG PG PG PG C `````````````````````````````````````````````````````````````````````````````````` `````````````````````````````````````````````````````````````````````````````````` PG ```````````````````````````````````````````````````````````````` PG PG PG PG `````````````````````````````````````````````````````````````````````````````````` `````````````````````````````````````````````````````````````````````````````````` ```````````````````````````````````````````````````````````````` PG D PG PG PG PG + E PG PG PG PG PG `````````````````````````````````````````````````````````````````````````````````` `````````````````````````````````````````````````````````````````````````````````` ```````````````````````````````````````````````````````````````` PG `````````````````````````````````````````````````````````````````````````````````` `````````````````````````````````````````````````````````````````````````````````` - Figure 2.7. Schematic representation of the steps of on-line-preconcentration-ce of IgG. (A) Sample injection following preconditioning of the protein G-monolithic preconcentrator capillary with 50 mm ammonium formate-formic acid (ph 7.6), (B) removal of unbound proteins and preconditioning of the preconcentrator with 12.5 mm ammonium formate-formic acid (ph 7.6), (C) desorption of trapped IgG with 50 mm formic acid, (D) injection of a plug of 12.5 mm ammonium formate-formic acid (ph 7.6), (E) electrophoresis. ( ) IgG, ( ) other proteins. 73
91 UV absorbance (mv) A Migration time (min) 12 UV absorbance (mv) B Migration time (min) 12 Figure 2.8. Typical electropherograms of the on-line preconcentration-ce of IgG standard. Experimental conditions: 64 cm (53 cm to detector) x 75 µm i.d. fused silica capillary; 1.5 cm protein G monolithic preconcentrator; 50 mm formic acid (1.0 bar, 0.3 min) elution buffer; 12.5 mm ammonium formate-formic acid (ph 7.6) separation buffer; +15 kv applied separation voltage; UV detection at 214 nm. (A) 120 nm IgG solution, (B) 12 nm IgG solution. 74
92 Additionally, in the course of the preparation of the monolithic preconcentrator, slight changes in the porogen content in the monolithic precursor solution, may have led to monoliths with slightly different average pore size, and therefore, different back-pressure and surface area of charged groups, which ultimately affected the net EOF Application of the monolithic preconcentrator to a human serum sample The ability of on-line monolithic preconcentrator-cze to preconcentrate IgG was proven for real samples. Diluted (500 and 65,000 times) human serum samples obtained from a healthy volunteer were analyzed using this system. Assuming a mg/ml IgG concentration in human serum, for a 65,000 diluted serum sample, the IgG concentration was estimated to be 960 pm to 1.4 nm. Typical electropherograms of IgG extracted and preconcentrated from human serum are shown in Figure 2.9. These results demonstrate the effectiveness of the preconcentrator for on-line preconcentration-ce of proteins in real biological samples. In this particular application, the preconcentrator served three purposes: sample extraction, clean-up and preconcentration. The system could be used for more than 8 consecutive runs without significant loss in performance (average migration time and peak area were 8.29 ± 0.48 min and 4.03 ± 0.30 x 10 5 µvs, respectively). The system was stable for more than one month upon storage. It is noteworthy to mention that this preconcentrator is not limited to the preconcentration of IgG. By having protein G immobilized on the monolith, a universal support is generated that allows the capture of any molecule for which an antibody is available. This study was particularly focused on the design and evaluation of a preconcentrator that could be used for the selective preconcentration of a wide range of 75
93 proteins. IgG was the standard protein chosen to test this preconcentrator. This preconcentrator can potentially be coupled to MS, further lowering the CLOD. 2.4 Conclusions An on-line protein G monolithic preconcentrator-ce system was designed and evaluated for the preconcentration of proteins. In fabricating the preconcentrator, the use of coated capillaries was essential to reduce protein-wall interactions. In addition to providing good separation efficiencies, PB(3) coated capillaries proved effective to prevent the non-specific adsorption of IgG on the surface of the capillary during the preconcentration step. Monoliths were prepared from different formulations and evaluated for binding capacity to optimize the monolith formulation for protein preconcentration. The physical properties of the monolith considered best were determined by mercury intrusion porosimetry. The monolith had a low back-pressure and was macroscopically homogeneous. The potential of the monolith to rapidly preconcentrate proteins was demonstrated. A suitable discontinuous buffer system for on-line preconcentration-ce separation of IgG was determined to be 12.5 mm ammonium formate-formic acid (ph 7.6) as the background electrolyte and 50 mm formic acid as the elution buffer. Standard solutions of IgG were preconcentrated using this system. Additionally, the extraction and preconcentration of IgG from human serum was demonstrated. The on-line preconcentration-cze system developed here can potentially be applied to the analysis of proteins other than IgG for which an antibody is available; therefore, it should be very useful for the analysis of biomarkers, which are usually proteins that are present at low concentrations. 76
94 A UV response (mv) Migration time (min) UV response (mv ) B Migration time (min) Figure 2.9. Electropherograms demonstrating on-line preconcentration-ce of IgG from human serum. Experimental conditions: 64 cm (53 cm to detector) x 75 µm i.d. fused silica capillary; 1.5 cm protein G monolithic preconcentrator; 50 mm formic acid (1.0 bar, 0.3 min) elution buffer; 12.5 mm ammonium formate-formic acid (ph 7.6) separation buffer; +15 kv applied separation voltage; UV detection at 214 nm. (A) 500 times diluted human serum (~ 6 µl volume sampled), (B) 65,000 times diluted human serum (~ 28 µl volume sampled). 77
95 2.5 References 1. T. Manabe, Electrophoresis 21 (2000) J.A. Wells, H. Swerdlow, Anal. Chem. 75 (2003) W.L. Tseng, H.T. Chang, Anal. Chem. 72 (2000) M.A. Strausbauch, J.P. Landers, P. Wettstein, Anal. Chem. 68 (1996) A.J. Tomlinson, L.M. Benson, N.A. Guzman, S. Naylor, J. Chromatogr. A 744 (1996) A.J. Tomilinson, S. Naylor, J. Cap. Elec. 5 (1995) A.J. Tomlinson, N.A. Guzman, S. Naylor, J. Cap. Elec. 6 (1995) J.J. Dalluge, L.C. Sander, Anal. Chem. 70 (1998) N.A. Guzman, R.J. Stubbs, Electrophoresis 22 (2001) N.A. Guzman, M.A. Trebilcock, J.P. Advis, J. Liq. Chromatogr. 14 (1991) N.H. Heegaard, S. Nilsson, N. Guzman, J. Chromatogr. B 715 (1998) T. Stroink, E. Paarlber, J.C.M. Waterval, A. Bult, W.J.M. Underberg, Electrophoresis 22 (2001) Q. Yang, A.J. Tomlinson, S. Naylor, Anal. Chem. 71 (1999) A N.A. Guzman, J. Chromatogr. B 749 (2000) N.A. Guzman, Electrophoresis 24 (2003) L. Rashkovetsky, Y. Lyubarskaya, F. Foret, D. Hughes, B. Karger, J. Chromatogr. A 781 (1997) A.M. Hoyt, S.C. Beale, J.P. Larmann, J.W. Jorgenson, J. Microcol. Sep. 5 (1993) N.E. Baryla, N.P. Tolt, Analyst 128 (2003)
96 19. J.C.M. Waterval, G. Hommels, J. Teeuwsen, A. Bult, H. Lingeman, W. J. M. Underbeg. Electrophoresis 21 (2000) N.A. Guzman, J. Liq. Chromatogr. 18 (1995) J. Cai, Z. El Rassi, J. Liq. Chromatogr. 16 (1993) J.P. Quirino, M.T. Dulay, B.D. Bennet, R. Zare, Anal. Chem. 73 (2001) N.A. Guzman, T. M. Phillips, Anal. Chem. (2005) 61A. 24. A. Palm, M.V. Novotny, Anal. Chem. 69 (1997) F. Svec, J.M.J. Fréchet, Anal. Chem. 54 (1992) Z. Pan, H. Zou, W. Mo, X. Huang, R. Wu. Anal. Chim. Acta 466 (2002) C. Yu, M. H. Davey, F. Svec, J. M. J. Frechet, Anal. Chem. 73 (2001) H. Katayama, Y. Ishihama, N. Asakawa, Anal. Chem. 70 (1998) T.V. Gupalova, O.V. Lojkina, V.G. Pàlàgnuk, A.A. Totolian, T.B. Tennikova, J. Chromatogr. A 949 (2002) Y.Y. Wang, P.C.P. Cheng, D.W. Chan, Proteomics 3 (2003) C. Viklund, E. Ponten, B. Glad, K. Irgum, Chem. Mater 9 (1997) K.D. Lukacs and J.W. Jorgenson, J. High Resolut. Chromatogr. & Chromatogr. Commun. 8 (1985) S. Chen and M. Lee, J. Microcol. Sep. 9 (1996)
97 3 COUPLED AFFINITY-HYDROPHOBIC MONOLITHIC COLUMN FOR ON-LINE REMOVAL OF IgG, PRECONCENTRATION OF LOW ABUNDANCE PROTEINS, AND SEPARATION BY CAPILLARY ZONE ELECTROPHORESIS 3.1 Introduction As the demand for proteomics research increases, the development of new techniques becomes more desirable. As mentioned in Chapter 1, analyzing the proteome of human serum represents a challenge. The difficulty of this task resides in the complexity of the sample. It is estimated that thousands of proteins may be expressed in blood serum. Most of these proteins are present at very low concentrations. Analysis of the less abundant proteins is hindered by the presence of high abundance proteins, such as human serum albumin (HSA), immunoglobulin G (IgG), haptoglobin, transferrin, α 1 - antitrypsin and α 2 -macroglobulin, which together represent almost 85% of the protein content in serum. Therefore, in most cases, depletion of the high abundance proteins, or concentration of the low abundance proteins is necessary prior to analysis of low abundance proteins. 1-8 The coupling of an affinity column for selective removal of high abundance proteins with a hydrophobic column for preconcentration of low abundance proteins would be a powerful strategy for the analysis of low abundance proteins. The fabrication and evaluation of such a system is reported. The system incorporates sample fractionation, concentration, clean-up, CZE separation and UV detection. A butyl methacrylate-co-ethylene dimethacrylate (BuMA-co-EDMA) monolith was synthesized by UV initiated polymerization at the inlet end of a 75 μm i.d. fused silica capillary that had been previously coated with a protein compatible polymer, 80
98 poly(vinyl)alcohol. The monolith was used for on-line preconcentration of proteins followed by capillary electrophoresis (CZE) separation. For the analysis of standard proteins (cytochrome c, lysozyme and trypsinogen A) this system proved reproducible. The run-to-run %RSD values for migration time and peak area were less than 5%, which is typical of CZE. As measured by frontal analysis using lysozyme as solute, saturation of a 1 cm monolith was reached after loading 48 ng of protein. Finally, the BuMA-co- EDMA monolithic preconcentrator was coupled to a protein G monolithic column via a zero dead volume union. The coupled system was used for on-line removal of IgG, preconcentration of standard proteins and CZE separation. 3.2 Experimental Chemicals HPLC water, anhydrous methanol (MeOH), acetone, hexanes, acetonitrile (ACN) ammonium formate and phosphate buffered saline (PBS), ph 7.4 ± 0.1, were supplied by Mallinckrodt Chemicals (Phillipsburg, NJ, USA). Cyclohexanol and trifluoro acetic acid (TFA) were from Fisher Scientific (Fair Lawn, NJ, USA). Formic acid was from Anachemia Canada (Montréal, Canada). Trizma base, dextran sulfate sodium salt, hexadimethrin bromide (polybrene), 97% glycidyl methacrylate (GMA), 3- (trimethoxysilyl) propyl methacrylate (γ MPTS), trimethylolpropane trimethacrylate (TRIM), 99% 2,2-dimethoxy-2-phenylacetophenone (DMPA), 98% ethylene glycol dimethacrylate (EDMA), 99% butyl methacrylate (BuMA), 99% poly(vinyl alcohol) (PVA, MW 89,000-98,000), 1-propanol and 1,4-butanediol were purchased from Sigma- Aldrich (Milwakee, WI, USA). Sodium carbonate monohydrate, sodium bicarbonate and phosphoric acid were from EM Science (Darmstadt, Germany). Protein G, recombinant 81
99 Escherichia coli, and IgG were supplied by Calbiochem (La Jolla, CA, USA). Cytochrome c, lysozyme and trypsinogen A were also purchased from Sigma-Aldrich. Buffer solutions were prepared with deionized water from a Millipore water purifier (Molsheim, France) and filtered through a 0.22 μm filter Capillary zone electrophoresis UV transparent fused silica capillary tubing with 75 and 250 μm i.d. and 365 μm o.d. was obtained from Polymicro Technologies (Phoenix, AZ, USA). Capillary electrophoresis experiments were carried out with a Crystal CE 300 system (ATI, Madison, WI, USA). On-column UV detection was accomplished at 214 nm using a Crystal 100 variable wavelength UV-Vis absorbance detector. Data collection and processing was performed using Chrom Perfect software work station (Mountain View, CA). Electropherograms were converted to a CP Tab delimited raw file with RT and redrawn using Microsoft Excel (Redmond, WA, USA) Fabrication of monolithic preconcentrators Preparation of a monolithic preconcentrator at the column inlet involved two steps. In the first step, the inner wall of the fused silica capillary tubing was coated with a protein compatible material (i.e., PVA) to prevent undesirable protein/wall interactions. In the second step, a 1 cm long BuMA-co-EDMA monolith was synthesized using photoinitiated polymerization. Preparation of PVA capillary coatings. Coating of the capillary walls with PVA was achieved following a procedure similar to that described by Gilges et al. 9 Basically, a 4.0 m length of UV transparent fused silica tubing (75 μm i.d.) was attached to a small in-house constructed pressure vessel containing a vial with a thoroughly degassed 82
100 solution of 6% PVA in water. The PVA solution was passed through the capillary at 60 psi for 2 h. Unbound PVA was flushed out of the capillary with nitrogen at 40 psi for 2 h. The capillary was cured in a GC oven (HP 5890, Hewlett-Packard, Palo Alto, CA, USA) under a stream of nitrogen (30 psi). A temperature program was then applied from 45 C at 5 C/min to 145 C for 5 h. To ensure homogeneous coating, the entire process was repeated after filling the capillary from the opposite end. Preparation of polymer monoliths. A variation of the methodology developed by Moravcová et al. 10 was used to prepare BuMA-co-EDMA monolith segments inside PVA coated capillaries. The monolithic precursor solution was prepared in a 1 dram (4 ml) glass vial by mixing g of DMPA (initiator), 0.48 g of EDMA (cross-linker), 0.72 g of BMA (monomer) and porogens (H 2 O, 0.18 g; 1,4-butanediol, 0.54 g; and 1-propanol, 1.08 g). This solution was ultrasonicated for 5 min, and introduced into the capillary by capillary action. Polymerization was induced with a Dymax 5000 AS UV curing lamp (Torrington, CT, USA). The irradiation intensity was 200 mw/cm 2 in the wavelength range of nm. The irradiation time was 14 min. Unreacted monomer and porogens were flushed out of the capillary by rinsing with 1 ml of methanol. The monolith was cut to a length of 1 cm, and the column was stored in water at room temperature until used Scanning electron microscopy (SEM) A small section (1 cm) of the monolith inside the capillary was dried under vacuum, and SEM images were taken using an FEI Philips XL30 ESEM FEG (Hillsboro, OR, USA). 83
101 3.2.5 On-line preconcentration-cze of standard proteins Standard proteins (lysozyme, cytochrome c and trypsinogen A) were used to investigate the performance of the monolithic preconcentrator. Protein preconcentration was accomplished by pumping a protein solution at 1 bar for a set amount of time through the capillary that had been previously equilibrated with 50 mm ammonium formate-formic acid, ph 7.6 (binding buffer) for 7 min at 1 bar. Unbound protein was rinsed away with binding buffer for 7 min at 1 bar, and the capillary was conditioned with the same volume of 50 mm tris-phosphate, ph 3.0 (separation buffer). Trapped protein was then desorbed from the monolith with the elution buffer (70 % ACN in 0.1% TFA, 700 mbar, 0.1 min). The monolith length was 1 cm, and the capillary dimensions were 70 cm (59 cm effective length) x 75 μm i.d. The separation voltage was + 25 kv and the detection wavelength was 214 nm Fabrication of protein G monolithic columns for removal of IgG Capillary surface deactivation. Capillary surface deactivation was accomplished by depositing alternating thin films of physically adsorbed negatively (dextran) and positively (polybrene) charged polymers. A methodology similar to that described by Katayama and co-workers 11 with some modifications was applied. Briefly, using a syringe pump (Model 11, Harvard Apparatus, Holliston, MA, USA) with a 1 ml plastic syringe fitted with a stainless steel needle, a 250 µm i.d. UV transparent fused silica capillary was washed consecutively with acetone, deionized water, 0.2 M HCl, deionized water, 0.2 M NaOH and deionized water for 30 min each at 10 µl/min. The capillary was then rinsed with a 10% polybrene solution at 5 µl/min for 30 min and allowed to sit for 15 min. Next, the capillary was washed with a 6% dextran solution at 5 µl/min for 84
102 30 min and left for 15 min. Finally, the capillary was rinsed again with 10% polybrene solution at 5 µl/min for 30 min and left for 1 h. Non-adsorbed polymer was washed away with H 2 O. Preparation of polymer monoliths. The surface-deactivated capillary was dried using a stream of nitrogen for 1 h. The monomer mixture was prepared in a 1 dram (4 ml) glass vial by admixing in sequence g of DMPA (initiator), 0.24 g of TRIM (cross-linker), 0.36 g of GMA (monomer) and porogens (cyclohexanol, 0.77 g; methanol, 0.44 g; and hexane, 0.19 g). This solution was ultrasonicated for 5 min before use. This monomer solution was introduced into the capillary by the use of capillary action. Polymerization was induced using a Dymax 5000 AS UV curing lamp (Torrington, CT, USA). The UV curing lamp can produce an irradiation intensity of 200 mw/cm 2 in the wavelength range of nm. The irradiation time was 12 min. Unreacted monomer and porogens were flushed out of the capillary by rinsing with 1 ml of methanol. Immobilization of protein G on polymer monoliths. Protein G was immobilized on GMA monolithic columns following a procedure similar to that described by Tennikova. 12 Briefly, using a syringe pump (Model 11, Harvard Apparatus, Holliston, MA, USA) with a 1 ml plastic syringe fitted with a stainless steel needle, the monolithic capillary column was washed consecutively with ethanol, ethanol-h 2 O (1:1), H 2 O and 0.1 M sodium carbonate buffer (ph 9.3) for 30 min each at 2 µl/min. A solution of 5.0 mg/ml protein G dissolved in 0.1 M sodium carbonate buffer (ph 9.3) was then pumped through the monolithic column for 20 min at 0.4 µl/min. Using silicone rubber, both ends of the capillary were sealed. The monolithic column was then heated to 34 C for 20 h in an oven. Noncovalently bound protein was washed away with 0.1 M sodium 85
103 carbonate buffer (ph 9.3), followed by 50 mm ammonium formate-formic acid buffer, ph 7.6. The monolithic column was cut to a total length of 25 cm, and stored in this last buffer at 4 C until used Coupling of protein G monolithic columns to hydrophobic monolithic preconcentrator-ce columns for on-line removal of IgG, followed by preconcentration of standard proteins and separation by CE The protein G monolithic column was connected to the BuMA-co-EDMA monolithic preconcentrator CE column via an Upchurch zero dead volume union (Oak Harbor, WA). A syringe pump (Model 11, Harvard Apparatus, Holliston, MA, USA) with a 250 μl Hamilton (Reno, NV, USA) gastight syringe was used to force the buffer and sample solutions through the capillaries. The experiment was carried out as follows. The coupled columns were conditioned with 50 mm ammonium formate-formic acid, ph 7.6 (binding buffer), for 15 min at 1.5 μl/min. Following injection of protein solution containing IgG and standard proteins in binding buffer for a set amount of time at 0.5 μl/min, the BuMA-co-EDMA monolithic preconcentrator was detached from the protein G column and mounted in the CE instrument. The column was rinsed with binding buffer for 7 min at 1 bar and conditioned with the same volume of 50 mm tris-phosphate, ph 3.0 (separation buffer). Concentrated protein was eluted from the monolith with 70% ACN in 0.1% TFA (700 mbar for 0.1 min), and a 25 kv separation voltage was applied. 3.3 Results and Discussion Monolithic preconcentrator Protein analysis by capillary electrophoresis is hindered by protein adsorption and low concentration limits of detection To prevent proteins from being adsorbed on 86
104 the capillary walls, surface deactivation is necessary Conventional procedures for preparing monoliths inside fused silica capillaries involve surface pretreatment of the capillary with γ-mpts to which monoliths can be anchored via silanization. Nevertheless, results from my previous experiments 38 showed that proteins are easily adsorbed onto this treated surface. Therefore, alternative procedures for surface modification were investigated to suppress unwanted analyte/wall interactions. The modified surface had to ensure monolith stability within the capillary, and at the same time be protein compatible. When polybrene or dextran was used to deactivate the surface of fused silica capillaries, the BuMA-EDMA monolith was stable when pressure was applied to rinse the column with organic solvents. In contrast, when water or buffer solutions were pumped through the column, movement of the monolithic bed was observed. Accordingly, different coating materials had to be explored for the fabrication of monolithic preconcentrators. Neutral hydroxylated polymers, such as PVA, have been successfully used by various authors to deactivate the inner surface of fused silica capillaries. High efficiency separations of proteins by CE with PVA coated capillaries have been reported. 9,34 A procedure similar to that reported by Gilges et al. 9 was adopted to coat fused silica capillaries with PVA. PVA provided a suitable surface for protein analysis and casting of BuMA-co- EDMA monoliths. The monolith was very stable and did not move when pressure or voltage was applied. It was hypothesized that the PVA coating created a surface rough 87
105 enough for strong adhesion of the monolith. These results are in agreement with a study recently reported 39 on the effect of glass surface roughening by boiling deionized water. In addition, PVA completely suppressed the electroosmotic flow (EOF), leading to very reproducible separations as shown later in Section For previously reported on-line SPE-CE preconcentrators, reversal of the EOF at low ph was observed. 17 Because the EOF was eliminated upon coating of the capillary with PVA, reversal of the EOF at low ph was not observed in this system. A SEM image of a 1 cm long BuMAco-EDMA monolith synthesized inside a 75 µm PVA coated capillary is shown in Figure Concentration and elution of proteins The conditions for adsorption, elution and separation had to be determined. Among these conditions, the concentration and volume of elution buffer to accomplish complete desorption of the proteins from the monolith after they were concentrated were particularly important. Because one of the aims of this study was to couple a hydrophobic monolithic preconcentrator to a protein G column for on-line removal of IgG, concentration of standard proteins and separation by CE, a buffer suitable for permitting both hydrophobic and IgG-protein G interactions was desirable. Therefore, the adsorption buffer for preconcentration of standard proteins was chosen to be 50 mm ammonium formate-formic acid, ph


106 Figure 3.1. SEM of a BuMA-co-EDMA monolith in a capillary column. 89
107 MeOH and ACN were among the elution buffers evaluated for analyte desorption from the monolithic support. The concentration of these organic solvents was varied from 50 to 100%. At the high concentrations of solvent used, addition of 0.1% TFA was necessary to prevent protein precipitation. A solution of 70% ACN in 0.1% TFA was chosen as the elution buffer for disrupting hydrophobic interactions. The volume of elution buffer necessary to achieve complete desorption of the sample from the monolith was determined by monitoring the area of the eluted peak as a function of the elution time, with the elution pressure fixed at 700 mbar, until a plateau was reached. For a 1 cm monolith, an 0.1 min plug of elution buffer was sufficient to accomplish complete desorption. A suitable separation buffer was determined to be 50 mm tris-phosphate, ph 3.0. For on-line preconcentration-ce separation of proteins, the system was first equilibrated with adsorption buffer. Following loading of the sample, unbound protein was washed away with this same buffer, and the column was conditioned with separation buffer. Trapped protein was then eluted from the monolith with 70% ACN in 0.1% TFA and separated after applying a voltage of 25 kv Effect of the composition of sample buffer on preconcentration Figure 3.2 illustrates the effect of the composition of sample buffer on protein preconcentration. To obtain Figure 3.2, a 120 nm lysozyme solution was used and the volume of protein loaded onto the preconcentrator was kept constant. When the protein was dissolved in H 2 O, the height of the eluted peak was 4.4 mv. When the protein was dissolved in 50 mm ammonium formate-formic acid, ph 7.6, the height increased to 36 90
108 mv. Adding 0.9 M ammonium sulfate to this last buffer further increased the peak height to 52 mv. These results are consistent with the theory of hydrophobic interaction chromatography, in which high salt content promotes analyte retention. The positive effect of increasing the ionic strength of the sample on preconcentration was also reported by Yu et al., 40 who observed that Coumarin 519 in water (10 nm) showed little adsorption on the surface of butyl methacrylate-based monoliths. However, since the protonated form of Coumarin 519 is more hydrophobic, better adsorption was observed when Coumarin was dissolved in 0.9 mm HCl. Even better adsorption was achieved when 0.8 M ammonium sulfate was added to this last solution On-line preconcentration-cze of standard proteins Figure 3.3 is a typical electropherogram for on-line preconcentration of a 20 nm lysozyme solution. Preconcentration of samples at lower concentrations is possible; the concentration limits of detection (CLOD) attainable are ultimately determined by the volume of sample loaded. The application of this system to on-line preconcentration-ce separation was also demonstrated using a mixture of proteins. Figure 3.4 shows on-line preconcentration-ce of standard proteins cytochrome c, lysozyme, and trypsinogen A. Peaks 1 and 2 are cytochrome c and lysozyme, respectively, whereas peaks 3 and 4 correspond to trypsinogen A. It should be mentioned that two peaks were observed for this last protein when analyzed on a PVA coated capillary without the monolith. 91
109 A A B C Figure 3.2. Electropherograms showing the effect of sample buffer composition on preconcentration. Experimental conditions: 70 cm (59 cm to detector) x 75 μm i.d. fused silica capillary; 1 cm BuMA-co- EDMA monolith; 70% ACN in 0.1% TFA elution buffer (700 mbar, 0.1 min); 50 mm tris-phosphate (ph 3.0) separation buffer; + 25 kv applied voltage; 120 nm lysozyme (~ 7 μl volume sampled). (A) H 2 O, (B) 50 mm ammonium formate-formic acid (ph 7.6), (C) 50 mm ammonium formate-formic acid (ph 7.6) and 0.9 M ammonium sulfate. 92
110 Figure 3.3. On-line preconcentration-cze of a 20 nm lysozyme solution. Experimental conditions: 70 cm (59 cm to detector) x 75 µm i.d. fused silica capillary; 1 cm BuMA-co-EDMA monolith; 70% ACN in 0.1% TFA elution buffer (700 mbar, 0.1 min); 50 mm tris-phosphate (ph 3.0) separation buffer; + 25 kv applied voltage; 20 nm lysozyme (~ 24 μl volume sampled). 93
111 Figure 3.4. On-line preconcentration-cze of standard proteins. Experimental conditions: 70 cm x 75 μm i.d. fused silica capillary; 1 cm BuMA-co-EDMA monolith; 70% ACN in 0.1% TFA elution buffer (700 mbar, 0.1 min); 50 mm tris-phosphate (ph 3.0) separation buffer; + 25 kv applied voltage; 400 nm cytochrome c, 35 nm lysozyme and 250 nm trypsinogen A (~ 12 μl volume sampled). (1) cytochrome c, (2) lysozyme, (3,4) trypsinogen A. 94
112 Notice that this electropherogram was obtained with a preconcentrator having a 1 cm long monolith. More efficient separations (i.e., narrower peaks) could be obtained by decreasing the length of the monolith. Obviously, the shorter the monolith, the lower the volume of elution buffer required for complete elution, and the narrower the peaks. However, a shorter length of monolith also results in a lower binding capacity. Therefore, a compromise must be made. Because the major focus of this report was to design a hydrophobic monolithic preconcentrator, and demonstrate its applicability to the analysis of low concentration protein mixtures, no further attempts were made to improve separation efficiency by shortening the monolith. A 1 cm monolith was a good compromise between binding capacity and peak shape. Furthermore, the reproducibilities in migration time and peak area were good as shown in Section Previous reports concerning on-line SPE-CE using polymer monoliths mainly focused on the analysis of small molecules. This is the first demonstration of on-line preconcentration-ce separation of protein mixtures using BuMA-co-EDMA monoliths cast in a CE capillary column deactivated with a protein compatible material Saturation curve for the monolithic preconcentrator Figure 3.5 is the saturation curve for the monolithic preconcentrator. Saturation of a 1 cm monolith occurs after loading approximately 48 μl of a 10 μg/ml lysozyme solution, which corresponds to 48 ng of protein. These data were obtained by loading a 10 μg/ml lysozyme solution for increasing lengths of time and measuring the normalized areas of the eluted peaks until a plateau was reached. 95
113 Peak area Sample loading time (min) Figure 3.5. Saturation curve for the monolithic preconcentrator. 96
114 3.3.6 Reproducibilities of migration times and peak areas of standard proteins Table 3.1 lists run-to-run (n=3) reproducibility data. The percent relative standard deviations (%RSD) for migration time and peak area are between 1-5%, which is typical for CZE. The column was stable for more than one month upon storage Coupled protein G monolithic column-hydrophobic monolithic preconcentrator for removal of IgG, preconcentration of standard proteins, and separation by CE Affinity LC experiment to test the non-specific adsorption of proteins other than IgG on the protein G monolithic column. Prior to coupling the protein G monolithic column to the BuMA-co-EDMA monolithic preconcentrator for on-line removal of IgG, preconcentration of standard proteins and separation by CE, experiments were carried out to evaluate the non-specific adsorption of proteins other than IgG on the protein G monolith. Cytochrome c, lysozyme and trypsinogen A were selected as standard proteins. Figure 3.6A shows a frontal elution experiment with a solution of cytochrome c, lysozyme, and trypsinogen and Figure 3.6B shows the same affinity experiment with IgG, cytochrome c, lysozyme and trypsinogen A. In obtaining these Figures, a 1 cm protein G monolith cast in a 75 μm i.d. capillary previously deactivated with alternating layers of negatively (dextran) and positively (polybrene) charged polymers was conditioned with 50 mm ammonium formate-formic acid, ph 7.6 (binding buffer). Following loading of the sample, unbound protein was rinsed away with binding buffer. A plug of elution buffer 1 (50 mm formic acid) adequate to disrupt the IgG 97
115 Table 3.1. Reproducibilities of migration times and peak areas of standard proteins. Protein Migration time (min) %RSD Peak area (arbitrary units) Cytochrome c Lysozyme Trypsinogen A
116 A B Figure 3.6. Affinity LC experiment to test the non-specific adsorption of proteins other than IgG on the protein G monolithic column. Experimental conditions: 70 cm (59 cm to detector) x 75 μm i.d. fused silica capillary; 1 cm protein G monolith. The column was flushed consecutively with binding buffer (1 bar, 7 min), protein solution (1 bar, 12 min), and binding buffer (1 bar, 7 min). A plug (1 bar, 0.25 min) of 50 mm formic acid (elution buffer 1 to disrupt the protein G-IgG interaction) was injected followed by separation buffer (1 bar, 6 min). A plug (1 bar, 0.25 min) of 70% ACN in 0.1% TFA (elution buffer 2 to disrupt hydrophobic interactions) was injected followed by separation buffer (1 bar, 6 min). (A) cytochrome c, lysozyme and trypsinogen A. (B) IgG, cytochrome c, lysozyme and trypsinogen A. 99
117 protein G interaction was next injected, and pushed through the column with binding buffer. A plug of elution buffer 2 (70% ACN in 0.1% TFA) appropriate to disrupt hydrophobic interactions between the proteins and the monolith was then injected, and forced through the column with binding buffer. For the solution containing cytochrome c, lysozyme and trypsinogen A, no peaks were observed following injection of the plugs of elution buffers 1 and 2. For the solution containing these same three proteins and IgG, a peak corresponding to IgG was observed following injection of elution buffer 1. These results demonstrate that IgG binds specifically to the protein G monolith. Simultaneous on-line removal of IgG, preconcentration of standard proteins, and separation by CE. Figure 3.7 is a schematic representation of the coupled system used for on-line removal of IgG, preconcentration of standard proteins, and CE separation. The protein G monolith was coupled to the BuMA-co-EDMA monolithic preconcentrator CE column via a zero dead volume union. Notice that the bed volume of the protein G monolithic column is approximately 280 times that of the hydrophobic monolithic preconcentrator. This is to guarantee preconcentration of the low abundance proteins before saturation of the protein G monolithic column with IgG. A typical electropherogram of a mixture of IgG, cytochrome c and lysozyme analyzed using this system is shown in Figure 3.8. Clearly, in human serum, in addition to IgG, other high abundance proteins, such as human serum albumin, haptoglobin, transferrin, α 1 -antitrypsin and α 2 -macroglobulin should be removed prior to the analysis of low abundance proteins. Furthermore, the concentration of these proteins is estimated to be several orders of magnitude higher than that of the low abundance proteins. Therefore, for this system to be applicable to the analysis of more complex 100
118 GMA Monolith PG PG PG PG PG PG Zero Dead Volume Union Hydrophobic Monolith Figure 3.7. Schematic of the coupled protein G monolithic column-hydrophobic monolithic preconcentrator for removal of IgG, preconcentration of standard proteins, and separation by CE. 101
119 2 1 Figure 3.8. Electropherogram resulting from on-line removal of IgG, preconcentration of standard proteins, and separation by CE. Experimental conditions: 25 cm x 250 μm i.d. protein G monolithic column coupled to 1 cm BuMA-co-EDMA monolith cast in a 70 cm (59 cm to detector) x 75 μm i.d. fused silica capillary; 70% ACN in 0.1% TFA elution buffer (700 mbar, 0.1 min); 50 mm tris-phosphate (ph 3.0) separation buffer; + 25 kv applied voltage; 5 μg/ml cytochrome c; 5 μg/ml lysozyme and 100 μg/ml IgG. (1) cytochrome c, (2) lysozyme. 102
120 samples such as human serum, much higher loading capacity and additional affinity adsorbents must be addressed. Effective removal of the high abundance proteins would require that the affinity column contain antibodies for each of these proteins immobilized and cross-linked to the protein G monolith. In addition, the binding capacity of such a column would have to be thousands of times that of the hydrophobic monolithic preconcentrator. These could be accomplished by the use of an array of affinity monoliths. 3.4 Conclusions A BuMA-co-EDMA monolithic preconcentrator was designed and evaluated for online preconcentration-cze of proteins. The applicability of this system was demonstrated using standard proteins (cytochrome c, lysozyme, and trypsinogen A). The system proved to be very reproducible. The run-to run %RSD values for migration time and peak area were less than 5%, which is typical for CZE. Coating the capillary with a protein compatible material (i.e., PVA) prior to casting of the monolith was important to avoid unwanted analyte-wall interactions. Coupling of this hydrophobic monolithic preconcentrator to a protein G monolithic column allowed for on-line removal of IgG, preconcentration of low abundance proteins and separation by CZE. 103
121 3.5 REFERENCES 1. H.J. Issaq, Electrophoresis 22 (2001) Q.Y. He, G.K.K. Lau, Y. Zhou, S.T. Yuen, M.C. Lin, H.F. Kung, J.F. Chiun, Proteomics 3 (2003) L.F. Steel, D. Shumpert, M. Trotter, S.H. Seeholzer, A.A. Evans, W.T. London, R. Dwek, T.M. Block, Proteomics 3 (2003) B. Seliger, M. Menig, R. Lichtenfel, D. Atkins, J. Bukur, T.M. Halder, M. Kersten, A. Harder, A. Ackermann, J. Beck, B. Muehlenweg, W. Brenner, S. Melchior, R. Kellner, F. Lottspeinch, Proteomics 3 (2003) H.J. Isaaq, T.P. Conrads, G.M. Janini, T.D. Veenstra, Electrophoresis 23 (2002) Y. Shen, R.D. Smith, Electrophoresis 23 (2002) J. Chen, C.S. Lee, Y. Shen, R.D. Smith, E.H. Baekrecke, Electrophoresis 23 (2002) A. Premstaller, H. Oberacher, W. Walcher, A.M. Timperio, L. Zolla, J.P. Chervet, N. Cavusoglu, A.V. Dorsselaer, C.G. Huber, Anal. Chem. 73 (2001) M. Gilges, M.H. Kleemiss, G. Schomburg, Anal. Chem. 66 (1994) D. Moravcová, P. Jandera, J. Urban, J. Planeta, J. Sep. Sci. 27 (2004) H. Katayama, Y. Ishihama, N. Asakawa, Anal. Chem. 70 (1998) T.V. Gupalova, O.V. Lojkina, V.G. Pàlàgnuk, A.A. Totolian, T.B. Tennikova, J. Chromatogr. A 949 (2002) A.J. Tomlinson, N.A. Guzman, S. Naylor, J. Cap. Elec. 6 (1995)
122 14. A.J. Tomlinson, L.M. Benson, N.A. Guzman, S. Naylor, J. Chromatogr. A 744 (1996) N.A. Guzman, R.J. Stubbs, Electrophoresis 22 (2001) T. Stroink, E. P. Paarlber, J.C.M. Waterval, A. Bult, W.J.M. Underberg, Electrophoresis 22 (2201) M.A. Strausbauch, J.P. Landers, P.J. Wettstein, Anal. Chem. 68 (1996) A.J. Tomlinson, S. Naylor, J. Cap. Elec. (1995) J.J. Dalluge, L.C. Sander, Anal. Chem. 70 (1998) Q. Yang, A. Tomlinson, S. Naylor, Anal. Chem. (1999) A L.G. Rashkovetsky, Y.V. Lyubarskaya, F. Foret, D.E. Hughes, B.L. Karger, J. Chromatogr. A 781 (1997) A.M. Hoyt, S.C. Beale, J.P. Larmann, J.W. Jorgenson, J. Microcol. Sep. 5 (1993) N.E. Baryla, N.P. Toltl, Analyst 128 (2003) N.A. Guzman, J. Liq. Chromatogr. 16 (1995) N.A. Guzman, J. Chromatogr. 697 (1997) W. Wei, E.S. Yeung, Anal. Chem. 74 (2002) D.M. Osbourn, D.J. Weiss, C.E. Lunte, Electrophoresis 21 (2000) N.A. Guzman, Electrophoresis 24 (2003) E. Bonneil, K.C. Waldron, J. Chromatogr. B 736 (1999) E. Rohde, A.J. Tomlinson, D.H. Johnson, S. Naylor, J. Chromatogr. B 713 (1998) M.E. Swartz, M. Merion, J. Chromatogr. 632 (1993)
123 32. K. Srinivasan, C. Pohl, N. Avdalovic, Anal. Chem. 69 (1997) M. Huang, W.P. Vorkink, M.L. Lee, J. Microcol. Sep. 4 (1992) D. Belder, A. Deege, H. Husmann, F. Kohler, M. Ludwig, Electrophoresis 22 (2001) A. Malik, Z. Zhao, M.L. Lee, J. Microcol. Sep. 5 (1993) J. Zhang, C. Horváth, Electrophoresis 24 (2003) C. Quang, A. Malek, M.G. Khaledi, Electrophoresis 24 (2003) J.M. Armenta, B. Gu, P.H. Humble, C.D. Thulin, M.L. Lee, J. Chromatogr. A 1097 (2005) J. Vidic, A. Podgornik, A. Strancar, J. Chromatogr. A 1065 (2005) C. Yu, M.H. Davey, F. Svec, J.M.J. Fréchet, Anal. Chem. 73 (2001)
124 4 POLYMERIC MONOLITHIC COLUMNS COATED WITH POLYELECTROLYTE LAYERS FOR PROTEIN ANALYSIS 4.1 Introduction Recently, the development of monolithic columns has been an area of extensive research. Monolithic columns have several advantages over conventional packed columns. An attractive feature of monoliths is that no frits are required, since the monolith rods are directly synthesized within the column. 1 Several methods have been used to prepare monoliths with suitable surface chemistry. One approach is to use copolymerization in which a functional monomer can be copolymerized into the monolith matrix. Other methods include graft polymerization and modification of a reactive monolith. 2,3 In this work, a new method to introduce surface functionality was designed. Polymer monoliths were prepared by in situ polymerization of 2-acryloylamido-2- methyl-propanesulfonic acid and ethylene dimethacrylate. The monoliths were coated with a water soluble polymer (polybrene) and used for the analysis of proteins. Using this approach, a model monolith was prepared. Subsequent coating yielded a monolith with quaternary ammonium groups on the surface, which was confirmed by strong anodic electroosmotic flow. Analysis of standard proteins by ion exchange liquid chromatography (LC) and capillary electrochromatography (CEC) was demonstrated. This simple and rapid method for surface modification opened new avenues for the preparation of monoliths with a broad range of functionalities. 107
125 4.2 Experimental Chemicals Anhydrous methanol and HPLC water were purchased from Mallinckrodt Chemicals (Phillipsburg, NJ, USA). Cyclohexanol, sodium chloride and sodium phosphate monobasic and dibasic salts were from Fisher Scientific (Fair Lawn, NJ, USA). Trizma base, dextran sulfate sodium salt, hexadimethrin bromide (polybrene), 3- (trimethoxysilyl)propyl methacrylate (γ-mpts), 98% ethylene glycol dimethacrylate (EDMA), 99% 2,2-dimethoxy-2-phenylacetophenone (DMPA), 2-acryloylamido-2- methyl-propanesulfonic acid (AMPS) and 1-propanol were supplied by Sigma-Aldrich (Milwaukee, WI, USA). Phosphoric acid was from EM Science (Darmstadt, Germany). Ovalbumin and myoglobin were also purchased from Sigma-Aldrich. Buffer solutions were prepared with deionized water from a Millipore water purifier (Molsheim, France) and filtered through a 0.22 µm filter Fabrication of coated polymeric monolithic columns Capillary surface derivatization. UV transparent fused silica capillary tubing with 75 μm i.d. and 365 μm o.d. was obtained from Polymicro Technologies (Phoenix, AZ, USA). Surface derivatization was adapted from a method published by Yu et al. 4 Briefly, the inner wall of the capillary was consecutively rinsed with acetone, H 2 O, 0.2 M NaOH, H O, 0.2 M HCl, H 2 2O and ethanol using a syringe pump (Model 11, Harvard Apparatus, Holliston, MA, USA) for 30 min each at a flow rate of 10 μl/min. Following rinsing, the capillary was then dried in a GC oven for 1 h at 120 C. The capillary was then rinsed with a solution of 20% γ-mpts in ethanol, with ph adjusted to 4.5 using acetic acid, for 1 h at 1 μl/min. After reaction, the capillary was flushed with ethanol for 108
126 30 min at a flow rate of 2 μl/min, and dried by passage of nitrogen gas at 20 psi for 2 h. Both ends of the capillary were sealed with silicone rubber, and the capillary was allowed to stand at room temperature for 24 h in the dark. Preparation of polymer monoliths. Six monolith formulations, as indicated in Table 4.1, were investigated in this study to prepare poly(amps-co-edma) monoliths. The bulk monomer solution was prepared in a 1 dram (4 ml) glass vial by mixing the initiator, monomer, cross-linker and porogens, and ultrasonicating for 5 min before use. The monomer solution was introduced into the derivatized capillary by capillary surface action. The capillary was then placed under a Dymax 500AS UV curing lamp (Torrington, CT, USA) for 10 min. The UV curing lamp can produce an irradiation intensity of 200 mw/cm 2 in the wavelength range of nm. The capillary was connected to an HPLC pump, and porogens as well as unreacted monomers were removed by rinsing with methanol. Surface modification of polymer monoliths. Surface modification of the poly(amps-co-edma) monolith was achieved by depositing alternating layers of positively (polybrene) and negatively (dextran) charged polymers. Using an HPLC pump, the monolithic capillary column was rinsed with H 2 O for 30 min at 900 or 2700 psi. A 6% polybrene solution in H 2 O was pumped through for 30 min at 900 or 2700 psi and allowed to sit for 30 min. Unbound polybrene was rinsed with H 2 O. Next, the monolithic column was washed with a 1% dextran solution in water at 900 or 2700 psi for 30 min and left for 30 min. Unbound dextran was rinsed with H 2 O. Finally, the column was rinsed again with a 6% polybrene solution at 900 or 2700 psi for 30 min and 109
127 left for 1 h. Non-absorbed polymer was washed away with water. The monolithic capillary column was stored in H O at room temperature when not in use. 2 Scanning electron microscopy (SEM). A small section (1 cm) of the monolith inside the capillary was dried under vacuum, and SEM images were taken using an FEI Philips XL30 ESEM FEG (Hillsboro, OR, USA) Capillary electrochromatography Capillary electrochromatography (CEC) experiments were performed with a Crystal CE 300 system (ATI, Madison, WI, USA) equipped with an online Crystal 100 variable wavelength UV-Vis absorbance detector and a Chrom Perfect software workstation (Mountain View, CA) for data collection and treatment. Electrochromatograms were converted to a CP Tab delimited raw file with RT and redrawn using Microsoft Excel (Redmond, WA, USA). CEC experiments were performed as follows. The monolithic capillary column was connected to an HPLC pump and conditioned with the background electrolyte, 50 mm sodium chloride in 10 mm phosphate (ph 7.1). The column was then mounted in the CE instrument, and the sample solution was electrokinetically injected for 0.07 min at 10 kv. The applied separation voltage was -25 kv, and the detection wavelength was 214 nm. The entire capillary length, 60 cm, was filled with the monolith, and a bubble was introduced at 50 cm from the inlet end to serve as the detection window Capillary liquid chromatography Capillary liquid chromatography experiments were carried out using two ISCO model 100 DM syringe pumps with a flow controller (Lincoln, NE, USA), 60 nl Valco internal loop sample injector (Houston, TX, USA), a Linear Scientific Uvis 203 detector 110
128 (Reno, NV, USA) and a Thermo Separations PC 1000 V3.0 software workstation (Fremont, CA, USA) for data collection and treatment. Experiments were performed in gradient elution mode. Mobile phase A was 10 mm phosphate buffer (ph 7.1), and mobile phase B was the same composition as mobile phase A plus 0.5 M NaCl. A linear gradient in 5 min from 0 to 100 mm NaCl in 10 mm phosphate buffer (ph 7.1) was typically used. A Valco splitting tee (Houston, TX, USA), connected between the static mixer of the syringe pumps and the internal loop sample injector via a 5 cm long capillary (30 mm i.d.), was used as the mobile phase splitter. A 33 cm long capillary (30 mm i.d.) was used as the splitting capillary. The split ratio was 1000:1. On-column UV detection was performed at 214 nm. Chromatograms were converted to an ASCII file and redrawn using Microcal Origin (Northampton, MA). The total capillary length was 20 cm, and the monolithic bed length was 15 cm. 4.3 Results and Discussion Fabrication of coated polymeric monolithic columns Monolith preparation. Homogeneity and flow resistance were the key characteristics considered in developing monoliths for protein analysis. AMPS was selected as the monomer since it contains sulfonate groups to which positively charged polymers (polybrene) can be attached. The porogen nature as well as ratios between porogens and the total monomer to total porogen ratio were among the parameters evaluated for the preparation of suitable poly(amps-co-edma) monoliths. Methanol, cyclohexanol and 1-propanol were investigated as potential porogens. In all experiments, the AMPS to EDMA ratio was kept constant. In addition, the initiator (DMPA) concentration relative to total monomer 111
129 (AMPS + EDMA) concentration was fixed at 1%. Six monolith formulations were prepared, as indicated in Table 4.1. Monoliths prepared according to formulas 2, 3, 4 and 6 were not homogeneous. Formula 5 resulted in high flow resistance monoliths. Formula 1 was the recipe which provided macroscopically homogeneous monoliths with the desired flow resistance. An SEM image of this monolith is shown in Figure 4.1. Surface functionalization of polymer monoliths. The optimized poly(amps-co- EDMA) monolith was reacted with polyelectrolyte layers of water soluble polymers. A positively charged polymer (polybrene), with quaternary ammonium groups, was first deposited on the poly(amps-co-edma) monolith. A negatively charged polymer (dextran), with sulfonate groups, was next introduced. Finally, a second layer of polybrene was deposited. Owing to ionic interactions, polybrene and dextran attached to the monolith. The concentration of these polymer solutions was kept low due to viscosity and column back-pressure issues. Introduction of dual layers of polybrene ensured stability of the coated monolith. The surface modification procedure was monitored by measuring the electroosmotic flow of the poly(amps-co-edma) monolith prior to and following surface functionalization with polybrene. These results are shown in Figure
130 Table 4.1. Compositions of monolith formulations investigated in this study a Monolith DMPA EDMA 50% AMPS Methanol Cyclohexanol 1-Propanol a Units are in g. 113


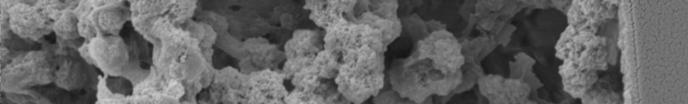

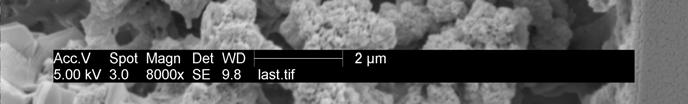
131 Figure 4.1. SEM image of a poly(amps-co-edma) monolith in a capillary column. 114
Lecture 5: 8/31. CHAPTER 5 Techniques in Protein Biochemistry
 Lecture 5: 8/31 CHAPTER 5 Techniques in Protein Biochemistry Chapter 5 Outline The proteome is the entire set of proteins expressed and modified by a cell under a particular set of biochemical conditions.
Isolation of Protein
 Isolation of Protein Ultra-centrifugation http://irfanchemist.wordpress.com/2009/04/19/isolation-of-protein / Protein solutions of various masses or densities may separated based on the time it takes to
NPTEL VIDEO COURSE PROTEOMICS PROF. SANJEEVA SRIVASTAVA
 LECTURE-06 PROTEIN PURIFICATION AND PEPTIDE ISOLATION USING CHROMATOGRAPHY TRANSCRIPT Welcome to the proteomics course. Today, we will talk about protein purification and peptide isolation using chromatography
Protein Techniques 1 APPENDIX TO CHAPTER 5
 Protein Techniques 1 APPENDIX T CHAPTER 5 Dialysis and Ultrafiltration If a solution of protein is separated from a bathing solution by a semipermeable membrane, small molecules and ions can pass through
TSK-GEL BioAssist Series Ion Exchange Columns
 Separation Report No. 100 TSK-GEL BioAssist Series Ion Exchange Columns Table of Contents 1. Introduction 2 2. Basic Properties 2 2-1 Ion-Exchange Capacity and Pore Characteristics 2 2-2 Separation of
(Refer Slide Time: 00:16)
") (Refer Slide Time: 00:16) Proteins and Gel-Based Proteomics Professor Sanjeeva Srivastava Department of Biosciences and Bioengineering Indian Institute of Technology, Bombay Mod 02 Lecture Number 5 Welcome
(Refer Slide Time: 00:16) Proteins and Gel-Based Proteomics Professor Sanjeeva Srivastava Department of Biosciences and Bioengineering Indian Institute of Technology, Bombay Mod 02 Lecture Number 5 Welcome
Unified Workflow for Monoclonal Antibody Charge Heterogeneity, Purity, and Molecular Weight Analysis
 Procedures Unified Workflow for Monoclonal Antibody Charge Heterogeneity, Purity, and Molecular Weight Analysis Separation and Online Detection of Intact mab Variants and Impurities using CESI-MS Bryan
Improving the Detection Limits for Highly Basic Neuropeptides Using CESI-MS
 Improving the Detection Limits for Highly Basic Neuropeptides Using CESI-MS Stephen Lock SCIEX UK Overview Who Should Read This: Senior Scientists and Lab Directors with an Interest in Protein Analysis
Proteomics. Proteomics is the study of all proteins within organism. Challenges
 Proteomics Proteomics is the study of all proteins within organism. Challenges 1. The proteome is larger than the genome due to alternative splicing and protein modification. As we have said before we
Alternative to 2D gel electrophoresis OFFGEL electrophoresis combined with high-sensitivity on-chip protein detection.
 Alternative to 2D gel electrophoresis OFFGEL electrophoresis combined with high-sensitivity on-chip protein detection Application Note Christian Wenz Andreas Rüfer Abstract Agilent Equipment Agilent 3100
Monoclonal Antibody Charge Variants Identification by Fully Automated Capillary Isoelectric Focusing Mass Spectrometry
 Application Note Pharma & Biopharma Monoclonal Antibody Charge Variants Identification by Fully Automated Capillary Isoelectric Focusing Mass Spectrometry Authors Tony Wang, James Xia, and Rena Wang CMP
Size Exclusion BioHPLC columns Ion Exchange BioHPLC columns
 Confidently separate and characterize bio-molecules with Agilent BioHPLC columns Size Exclusion BioHPLC columns Ion Exchange BioHPLC columns "It's a struggle to isolate and identify charge variants of
Faster Separations Using Agilent Weak Cation Exchange Columns
 Faster Separations Using Agilent Weak Cation Exchange Columns Application Note BioPharma Author Andrew Coffey Agilent Technologies, Inc. Abstract Ion exchange is a commonly used technique for the separation
Biotechniques ELECTROPHORESIS. Dr. S.D. SARASWATHY Assistant Professor Department of Biomedical Science Bharathidasan University Tiruchirappalli
 Biotechniques ELECTROPHORESIS Dr. S.D. SARASWATHY Assistant Professor Department of Biomedical Science Bharathidasan University Tiruchirappalli KEY CONCEPTS General principle Factors affecting Electrophoresis
Increasing Sensitivity In LC-MS. Simplification and prefractionation of complex protein samples
 Increasing Sensitivity In LC-MS Simplification and prefractionation of complex protein samples Protein Analysis Workflow Simplify Fractionate Separate Identify High Abundant Protein Removal reduction of
Chapter 6. Techniques of Protein and Nucleic Acid Purification
 Chapter 6 Techniques of Protein and Nucleic Acid Purification Considerations in protein expression and purification Protein source Natural sources Recombinant sources Methods of lysis and solubilization
Zwitterion Chromatography ZIC
 Zwitterion Chromatography ZIC A novel technique, with unique selectivity, suitable for preparative scale separations? PhD Einar Pontén What is Zwitterion Chromatography? Our definition: Liquid chromatography
Supporting Information
 Supporting Information Flow Induced Dispersion Analysis for Probing Anti-dsDNA Antibody Binding Heterogeneity in Systemic Lupus Erythematosus Patients: Toward a New Approach for Diagnosis and Patient Stratification
Types of chromatography
 Chromatography Physical separation method based on the differential migration of analytes in a mobile phase as they move along a stationary phase. Mechanisms of Separation: Partitioning Adsorption Exclusion
Determination of Isoelectric Point (pi) By Whole-Column Detection cief
 By Whole-Column Detection cief") Determination of Isoelectric Point (pi) By Whole-Column Detection cief Tiemin Huang and Jiaqi Wu CONVERGENT BIOSCIENCE Determination of Isoelectric Point (pi) by Whole Column Detection cief Definition
Determination of Isoelectric Point (pi) By Whole-Column Detection cief Tiemin Huang and Jiaqi Wu CONVERGENT BIOSCIENCE Determination of Isoelectric Point (pi) by Whole Column Detection cief Definition
Fast mass transfer Fast separations High throughput and improved productivity Long column lifetime Outstanding reproducibility Low carryover
 columns ProSwift Reversed-Phase Monolith Columns for Protein Analysis ProSwift reversed-phase columns use a unique monolith technology for fast, high-resolution HPLC and LC/MS separations of proteins.
BIL 256 Cell and Molecular Biology Lab Spring, Molecular Weight Determination: SDS Electrophoresis
 BIL 256 Cell and Molecular Biology Lab Spring, 2007 Molecular Weight Determination: SDS Electrophoresis Separation of Proteins by Electrophoresis A. Separation by Charge All polypeptide chains contain
Mass Spectrometry Analysis of Liquid Chromatography Fractions using Ettan LC MS System
 GUIDE TO LC MS - December 21 1 Spectrometry Analysis of Liquid Chromatography Fractions using Ettan LC MS System Henrik Wadensten, Inger Salomonsson, Staffan Lindqvist, Staffan Renlund, Amersham Biosciences,
Proteomics and some of its Mass Spectrometric Applications
 Proteomics and some of its Mass Spectrometric Applications What? Large scale screening of proteins, their expression, modifications and interactions by using high-throughput approaches 2 1 Why? The number
Microchip Electrophoresis for Glycoprotein Separation. Analytical Strategy, September 30th, 2014 Karina Hasler & Adrian Müller
 Microchip Electrophoresis for Glycoprotein Separation Analytical Strategy, September 30th, 2014 Karina Hasler & Adrian Müller Karina Hasler & Adrian Müller 30.09.2014 1 Content Glycoproteins Available
ION EXCHANGE KIT FOR MAB SEPARATIONS
 ION EXCHANGE KIT FOR MAB SEPARATIONS Sepax Technologies, Inc. 5 Innovation Way Newark, Delaware, USA Tel: (32) 366-111 Fax: (32) 366-1151 Toll free: www.sepax-tech.com Content Introduction... 1 Technical
New techniques for extraction, separation, and detection of EPO Dr. Zhen Liu
 Developments and challenges in the detection of doping with peptide hormones and related substances New techniques for extraction, separation, and detection of EPO Dr. Zhen Liu State Key Lab of Analytical
FOR RESEARCH USE ONLY. NOT FOR HUMAN OR DIAGNOSTIC USE.
 User Protocol 122643 Rev. 12 May 2005 JSW Page 1 of 7 ProteoExtract Albumin/IgG Removal Kit, Maxi Cat. No. 122643 1. Introduction One of the major challenges in functional proteomics is the handling of
Application Manual ProteoSpin Abundant Serum Protein Depletion Kit
 Application Manual ProteoSpin Abundant Serum Protein Depletion Kit For Use with P/N 17300 ProteoSpin Abundant Serum Protein Depletion Kit Basic Features Efficient removal of highly abundant proteins 1
BioHPLC columns. Tim Rice Biocolumn Technical Specialist
 BioHPLC columns Tim Rice Biocolumn Technical Specialist AU Typical Application Areas Size Exclusion: Aggregation Analysis Ion Exchange: Charge Isoform Analysis 0.035 Monomer 0.030 0.025 0.020 0.015 Dimer
Capillary Electrophoresis of Proteins
 Capillary Electrophoresis of Proteins SDS Capillary Gel Electrophoresis SDS-CGE Outline CE-SDS Gel Analysis Description of Technique Method Development Tips PA800 plus kits SDS-MW IgG Purity & Heterogeneity
Developing Quantitative UPLC Assays with UV
 Developing Quantitative UPLC Assays with UV Detection for Antibodies & Other Proteins Steve Taylor 2011 Waters Corporation 1 Outline UPLC technology for RP protein separations Method development parameters
Size Exclusion Chromatography
 Size Exclusion TSKgel PW-type PW PW XL TOSOH BIOSCIENCE TOSOH BIOSCIENCE LLC 156 Keystone Drive Montgomeryville, PA 18936-9637 Orders & Service: (800)366-4875 Fax: (215)283-5035 www.tosohbioscience.com
Analysis of biomolecules by SEC and Ion-Exchange UPLC
 Analysis of biomolecules by SEC and Ion-Exchange UPLC Anders Feldthus, Waters Nordic 2011 Waters Corporation 1 Waters Commitment To develop, commercialize and market columns that when used on Waters ACQUITY
Multiple Detector Approaches to Protein Aggregation by SEC
 Multiple Detector Approaches to Protein Aggregation by SEC Application Note BioPharma Author Andrew Coffey Agilent Technologies, Inc. Abstract Protein aggregation, where molecules assemble into dimers,
Protein analysis. Dr. Mamoun Ahram Summer semester, Resources This lecture Campbell and Farrell s Biochemistry, Chapters 5
 Protein analysis Dr. Mamoun Ahram Summer semester, 2015-2016 Resources This lecture Campbell and Farrell s Biochemistry, Chapters 5 Bases of protein separation Proteins can be purified on the basis Solubility
Chapter 5: Proteins: Primary Structure
 Instant download and all chapters Test Bank Fundamentals of Biochemistry Life at the Molecular Level 4th Edition Donald Voet https://testbanklab.com/download/test-bank-fundamentals-biochemistry-life-molecular-level-
4/4/2013. BioHPLC columns. Paul Dinsmoor Biocolumn Technical Specialist. April 23-25, Size Exclusion BioHPLC Columns
 BioHPLC columns Paul Dinsmoor Biocolumn Technical Specialist April 23-25, 2013 Size Exclusion BioHPLC Columns 1 NEW Size Exclusion Columns 5 m Particle 100Å, 150Å, 300Å, 500Å, 1000Å, 2000Å pore sizes High
CSE Separation of Cancer Cell Lysate
 Application Note: CSE Separation of Cancer Cell Lysate No. 9.200411 Rev. A 2004 Target Discovery, Inc. Target Discovery, Inc. 4015 Fabian Way Palo Alto, CA 94303 Tel: 650-812-8100 www.targetdiscovery.com/eotrol
Kinetics Review. Tonight at 7 PM Phys 204 We will do two problems on the board (additional ones than in the problem sets)
") Quiz 1 Kinetics Review Tonight at 7 PM Phys 204 We will do two problems on the board (additional ones than in the problem sets) I will post the problems with solutions on Toolkit for those that can t make
Quiz 1 Kinetics Review Tonight at 7 PM Phys 204 We will do two problems on the board (additional ones than in the problem sets) I will post the problems with solutions on Toolkit for those that can t make
PRINCIPLE, INSTRUMENTATION AND APPLICATIONS OF ELECTROPHORETIC TECHNIQUES IN BIOCHEMISTRY
 PRINCIPLE, INSTRUMENTATION AND APPLICATIONS OF ELECTROPHORETIC TECHNIQUES IN BIOCHEMISTRY INTRODUCTION Electrophoresis is the separation of charged molecules in an applied electric field. Modern electrophoretic
TECHNICAL INFORMATION
 T-1860A TECHNICAL INFORMATION Capillary Electrophoresis PRECISION IN CAPILLARY ELECTROPHORESIS Harry Whatley and Jeff Chapman Beckman Coulter, Inc. Introduction Instrumentation for routine chemical analysis
2012 Waters Corporation 1
 UPLC User meeeting April 2012 Principles and Practices for SEC, IEX for Intact Protein Analysis by UPLC anders_feldthus@waters.com 2012 Waters Corporation 1 Agenda Ion-Exchange Chromatography Theory and
HPCE-5 2. Realising the potential of Capillary Electrophoresis. Why is the HPCE-512 so much better?
 HPCE-5 2 Realising the potential of Capillary Electrophoresis Why is the HPCE-512 so much better? A Major Advance in Capillary Electrophoresis The HPCE-512 system based on multi-point detection overcomes
A Highly Accurate Mass Profiling Approach to Protein Biomarker Discovery Using HPLC-Chip/ MS-Enabled ESI-TOF MS
 Application Note PROTEOMICS METABOLOMICS GENOMICS INFORMATICS GLYILEVALCYSGLUGLNALASERLEUASPARG CYSVALLYSPROLYSPHETYRTHRLEUHISLYS A Highly Accurate Mass Profiling Approach to Protein Biomarker Discovery
2 Liquid chromatography of biomolecules
 2 Liquid chromatography of biomolecules Proteins, peptides, DNA, RNA, lipids, and organic cofactors have various characteristics such as electric charge, molecular weight, hydrophobicity, and surface relief.
Optimizing Protein Separations with Agilent Weak Cation-Exchange Columns
 Optimizing Protein Separations with Agilent Weak Cation-Exchange Columns Application Note Biopharmaceuticals Author Andrew Coffey Agilent Technologies, Inc. Abstract Columns containing weak cation-exchange
Agilent Multiple Affinity Removal Spin Cartridges for the Depletion of High-Abundant Proteins from Human Proteomic Samples.
 Agilent Multiple Affinity Removal Spin Cartridges for the Depletion of High-Abundant Proteins from Human Proteomic Samples Instructions Third edition July 2005 General Information Introduction The Agilent
MagSi Beads. Magnetic Silica Beads for Life Science and Biotechnology study
 MagSi Beads Magnetic Silica Beads for Life Science and Biotechnology study MagnaMedics Diagnostics B.V. / Rev. 9.2 / 2012 Wide range of products for numerous applications MagnaMedics separation solutions
Fast protein separations with ion exchange columns
 Fast protein separations with ion exchange columns Koji Nakamura*, Yoshio Kato and Shuichi Okuzono Nanyo Research Lab, Tosoh Corporation, 4560 Kaisei-cho, Shunan, Yamaguchi 746-8501, Japan TP106 0807 ISPPP-05
Online LC Sample Preparation with BioTrap 500 C18
 Online LC Sample Preparation with BioTrap 500 C18 Jörgen Hermansson Anders Grahn Inger Hermansson ChromTech AB Stockholm, Sweden Phone: 08-464-8020 Fax: 08-464-7020 E-mail: ct@chromtech.se http://www.chromtech.
Purification: Step 1. Protein and Peptide Chemistry. Lecture 11. Big Problem: Crude extract is not the natural environment. Cells: Break them open!
 Lecture 11 Protein and Peptide Chemistry Margaret A. Daugherty Fall 2003 Purification: Step 1 Cells: Break them open! Crude Extract Total contents of cell Big Problem: Crude extract is not the natural
Purification: Step 1. Lecture 11 Protein and Peptide Chemistry. Cells: Break them open! Crude Extract
 Purification: Step 1 Lecture 11 Protein and Peptide Chemistry Cells: Break them open! Crude Extract Total contents of cell Margaret A. Daugherty Fall 2003 Big Problem: Crude extract is not the natural
Laboratory Water Quality Affects Protein Separation by 2D Gel Electrophoresis
 Laboratory Water Quality Affects Protein Separation by 2D Gel Electrophoresis 2D gel electrophoresis remains a dominant technique in proteomics. Obtaining high quality gels requires careful and tedious
2-D Capillary Electrophoresis Analysis of Complex Protein Mixture
 Application Note: 2-D Capillary Electrophoresis Analysis of Complex Protein Mixture No. 7.200410 Rev. B 2004 Target Discovery, Inc. Target Discovery, Inc. 4015 Fabian Way Palo Alto, CA 94303 Tel: 650-812-8100
Capillary Electrophoresis: Principles and Practice
 R. Kuhn S. Hoffstetter-Kuhn Capillary Electrophoresis: Principles and Practice With 90 Figures Springer-Verlag Berlin Heidelberg New York London Paris Tokyo HongKong Barcelona Budapest Contents 1 Introduction
Biotherapeutic Method Development Guide
 Biotherapeutic Method Development Guide HALO BIOCLASS 1000 Å PROTEIN SELECTIVITY KIT Fused-Core Particle Technology BIOCLASS Strategy for Optimizing Protein Separations Using Reversed-phase Liquid Chromatography
Materials & Equipment 400 ml SDS running buffer Molecular weight markers (MWM) Chromatography samples (A476-1, A476 peak, A476+1)
 Chromatography samples (A476-1, A476 peak, A476+1)") Texas A&M University-Corpus Christi CHEM4402 Biochemistry II Laboratory Laboratory 13: Sodium Dodecyl Sulfate Polyacrylamide Gel Electrophoresis (SDS-PAGE) Analysis In this final laboratory, we will use
Texas A&M University-Corpus Christi CHEM4402 Biochemistry II Laboratory Laboratory 13: Sodium Dodecyl Sulfate Polyacrylamide Gel Electrophoresis (SDS-PAGE) Analysis In this final laboratory, we will use
A Comprehensive Workflow to Optimize and Execute Protein Aggregate Studies
 A Comprehensive Workflow to Optimize and Execute Protein Aggregate Studies Combining Size Exclusion Chromatography with Method Development and Light Scattering Application Note Biotherapeutics and Biosimilars
Fast IEF Method Development Using Whole-Column Detection cief
 Fast IEF Method Development Using Whole-Column Detection cief Jiaqi Wu 27 Coronet Road, Toronto, Ontario, CANADA M8Z 2L8 Conventional cief (cief Performed on Commercial CE Instruments) - + ph gradient
Ion exchange chromatography
 Ion exchange chromatography Objectives: 1- The objective of this experiment is to learn the principles of ion exchange chromatography by separating the charged molecules using buffer and salt. 2- A practical
Optimization of cief to Resolve Challenging MAb Samples of Clinical Immunodiagnostic Relevance
 Optimization of cief to Resolve Challenging MAb Samples of Clinical Immunodiagnostic Relevance Sushma Rampal, Sr. Application Scientist, Beckman Coulter Life Sciences, Brea, CA, USA Marcia Santos, Staff
Data File. HiLoad Superdex 30 prep grade HiLoad Superdex 75 prep grade HiLoad Superdex 200 prep grade. Pre-packed gel filtration columns
 P H A R M A C I A B I O T E C H HiLoad Superdex 30 prep grade HiLoad Superdex 75 prep grade HiLoad Superdex 200 prep grade Data File Pre-packed gel filtration columns HiLoad columns are XK laboratory columns
Monoclonal Antibody Analysis on a Reversed-Phase C4 Polymer Monolith Column
 Monoclonal Antibody Analysis on a Reversed-Phase C4 Polymer Monolith Column Shane Bechler 1, Ken Cook 2, and Kelly Flook 1 1 Thermo Fisher Scientific, Sunnyvale, CA, USA; 2 Thermo Fisher Scientific, Runcorn,
E-Coli Cell Lysate By High Performance Capillary Electrophoresis
 E-Coli Cell Lysate By High Performance Capillary Electrophoresis Analysis of E-Coli Lysate Label free analysis using the HPCE-512 ABSTRACT Analytical instruments with the capability of analyzing complex
Reducing dynamic range with Proteominer
 Reducing dynamic range with Proteominer Dynamic Range of the Plasma Proteome Albumin Apolipo-A1 Apolipo-B AGP Lipoprotein A IgG Transferrin Fibrinogen IgA α2 macroglobulin IgM α1-at C3 Comp factor Haptoglobulin
Biotherapeutic Method Development Guide
 Biotherapeutic Method Development Guide HALO BIOCLASS 1000 Å PROTEIN SELECTIVITY KIT Fused-Core Particle Technology BIOCLASS Strategy for Optimizing Protein Separations Using Reversed-phase Liquid Chromatography
ProSEC 300S. Protein Characterization columns
 ProSEC 300S Protein Characterization columns Agilent s ProSEC 300S is a silica-based material specifically designed for the analysis of proteins by aqueous size exclusion chromatography. With a proprietary
White Paper. Ion Exchange with PureSpeed Tips A Powerful Chromatography Tool
 Ion Exchange with PureSpeed Tips A Powerful Chromatography Tool Ion exchange chromatography separates molecules by exploiting differences in their overall charge characteristics. Its simplicity makes this
R R Innovation Way P/N SECKIT-7830 Newark, DE 19711, USA Tel: Fax: Website: Published in November 2013
 5-100 Innovation Way Newark, DE 19711, USA Tel:302-3661101 Fax:302-3661151 Website: www.sepax-tech.com Published in November 2013 P/N SECKIT-7830 These Phases are developed based on innovative surface
Identification of human serum proteins detectable after Albumin removal with Vivapure Anti-HSA Kit
 Andreas Kocourek, Pieter Eyckerman, Robert Zeidler, Pascal Bolon and Birgit Thome-Kromer Introduction The analysis of the complete proteome is a major interest of many researchers. Of particular importance
Separating Proteins by pi-values Can 2D LC
 Separating Proteins by pi-values Can D LC Replace D GE? Tyge Greibrokk, 1 Milaim Pepaj, 1 Elsa Lundanes, 1 Thomas Andersen and Katerina Novotna 1Department of Chemistry, University of Oslo, Norway, G&T
Impurity Detection with a New Light Emitting Diode Induced Fluorescence Detector Coupled to the Agilent 7100 Capillary Electrophoresis System
 Impurity Detection with a New Light Emitting Diode Induced Fluorescence Detector Coupled to the Agilent 7100 Capillary Electrophoresis System Application Note Biologics & Biosimilars, Proteomics & Protein
Method Development Considerations for Reversed-Phase Protein Separations
 Method Development Considerations for Reversed-Phase Protein Separations Hillary B. Hewitson, Thomas E. Wheat, Paula Hong, Kenneth J. Fountain APPLICATION BENEFITS n The BEH00 C 4 chemistry is available
Zakopane, April, 2011
 Clinical Proteomics: A Technology to shape the future? Zakopane, April, 2011 Protein Chemistry/Proteomics/Peptide Synthesis and Array Unit Institute of Biomedicine/Anatomy Biomedicum Helsinki, 00014 University
Application Note. Abstract. Author. Biopharmaceutical
 Innovator and Biosimilar Monoclonal Antibody-Peptide Map Comparison Using the Agilent 70 Capillary Electrophoresis System and Agilent MatchCompare Software Application Note Biopharmaceutical Author Arunkumar
Understanding the Effects of Common Mobile Phase Additives on the Performance of Size Exclusion Chromatography
 Understanding the Effects of Common Mobile Phase Additives on the Performance of Size Exclusion Chromatography 1 Presentation Importance of aggregate analysis in BioPharma manufacturing Analytical techniques
Solutions Guide. MX Series II Modular Automation for Nano and Analytical Scale HPLC And Low Pressure Fluid Switching Applications
 Solutions Guide MX Series II Modular Automation for Nano and Analytical Scale HPLC And Low Pressure Fluid Switching Applications Page 1 of 12 Table of Contents Sample Injection... 3 Two- Selection... 4
METHODS IN CELL BIOLOGY EXAM II, MARCH 26, 2008
 NAME KEY METHODS IN CELL BIOLOGY EXAM II, MARCH 26, 2008 1. DEFINITIONS (30 points). Briefly (1-3 sentences, phrases, word, etc.) define the following terms or answer question. A. depot effect refers to
Chapter 2 deals with LC-ESI-MS/MS studies on forced degradation of abacavir sulphate an anti HIV drug.
 The drug discovery and development process has undergone dramatic changes particularly in the last decade. Progress in drug discovery has been fuelled by improvements in methodologies and technologies
AppNote 5/2006 ABSTRACT
 AppNote 5/26 Stir Bar Sorptive Extraction Based on Restricted Access Material for the Direct Extraction of Drugs and Metabolites in Biological Fluids Wayne M. Mullett and Elizabeth Kwong Merck Frosst,
Application Note. Biopharm. Author. Abstract. Christian Wenz Agilent Technologies, Inc. Waldbronn, Germany
 Performance of commercially available gels for protein characterization by capillary gel electrophoresis with UV detection on the Agilent 7100 CE System Application Note Biopharm Author Christian Wenz
Agilent CE and CE/MS Solutions FLEXIBILITY AND RELIABILITY TO AMPLIFY YOUR FINDINGS
 Agilent CE and CE/MS Solutions FLEXIBILITY AND RELIABILITY TO AMPLIFY YOUR FINDINGS AGILENT CE AND CE/MS SOLUTIONS AT A GLANCE SOLUTIONS FOR CAPILLARY ELECTROPHORESIS Agilent Technologies has maintained
Mimetic Blue Affinity Adsorbents Mimetic Blue 1 P6XL, Mimetic Blue SA P6XL Mimetic Blue SA HL P6XL, Mimetic Blue ELISA Kit
 Mimetic Blue Affinity Adsorbents Mimetic Blue 1 P6XL, Mimetic Blue SA P6XL Mimetic Blue SA HL P6XL, Mimetic Blue ELISA Kit WWW.PROMETICBIOSCIENCES.COM/PRODUCT DATASHEET Mimetic Blue affinity chromatography
High-resolution Analysis of Charge Heterogeneity in Monoclonal Antibodies Using ph-gradient Cation Exchange Chromatography
 High-resolution Analysis of Charge Heterogeneity in Monoclonal Antibodies Using ph-gradient Cation Exchange Chromatography Agilent 1260 Infinity Bio-inert Quaternary LC System with Agilent Bio Columns
Protein electrophoresis: Introduction to SDS-PAGE
 Protein electrophoresis: Introduction to SDS-PAGE Aim: -Separation of proteins in an electric field by electrophoresis. Purposes: -Estimation of molecular masses -Relative abundances of major proteins
Supporting Information I
 Single-shot top-down proteomics with capillary zone electrophoresiselectrospray ionization-tandem mass spectrometry for identification of nearly 600 Escherichia coli proteoforms Rachele A. Lubeckyj 1,,
Chapter 2 Coated Capillaries for CE-MS of Therapeutic Protein
 Chapter 2 Coated Capillaries for CE-MS of Therapeutic Protein James Q. Xia 2.1 Introduction to Capillary Coating Bare fused-silica capillary is so far the most commonly used type of capillary in CE-UV
Protein Microarrays?
 Protein Microarrays? Protein Chemistry/Proteomics Unit and the Neuroscience Program,Biomedicum Helsinki E-Mail: marc.baumann@helsinki.fi (http://research.med.helsinki.fi/corefacilities/proteinchem) What
LabChip GXII: Antibody Analysis
 WHITE PAPER LabChip GXII: Antibody Analysis Antibody Analysis using microfluidic technology in high throughput Quality by Design Experiments Abstract Current initiatives in Process Analytical Technology
SGN-6106 Computational Systems Biology I
 SGN-6106 Computational Systems Biology I A View of Modern Measurement Systems in Cell Biology Kaisa-Leena Taattola 21.2.2007 1 The cell a complex system (Source: Lehninger Principles of Biochemistry 4th
Chapter 1 Principles of ion exchange
 Chapter 1 Principles of ion exchange This chapter provides a general introduction to the theoretical principles that underlie every ion exchange separation. An understanding of these principles will enable
Protein Methods. Second Edition. DANIEL M. BOLLAG Merck Research Laboratories West Point, Pennsylvania
 Protein Methods Second Edition DANIEL M. BOLLAG Merck Research Laboratories West Point, Pennsylvania MICHAEL D. ROZYCKI Department of Chemistry The Henry H. Hoyt Laboratory Princeton University Princeton,
ProteoEnrich CAT-X SEC Kit Merck: Lichrospher Composition. Silica Particle size. 25 µm particles with 6 nm pore size Ligand SO 3
 Novagen User Protocol TB428 Rev. A 1105 1 of 6 ProteoEnrich TM CAT-X SEC Kit About the Kit ProteoEnrich CAT-X SEC Kit 71539-3 Description The ProteoEnrich CAT-X SEC Kit provides a highly specific method
ProteoExtract Protein Precipitation Kit Cat. No
 User Protocol 539180 Rev. 12-October-06 JSW ProteoExtract Protein Precipitation Kit Cat. No. 539180 Note that this user protocol is not lot-specific and is representative of the current specifications
Agilent AdvanceBio SEC Columns for Aggregate Analysis: Instrument Compatibility
 Agilent AdvanceBio SEC Columns for Aggregate Analysis: Instrument Compatibility Technical Overview Introduction Agilent AdvanceBio SEC columns are a new family of size exclusion chromatography (SEC) columns
Distance Learning Module II: Using Capillary Electrophoresis for Qualitative and Quantitative Analysis
 Distance Learning Module II: Using Capillary Electrophoresis for Qualitative and Quantitative Analysis C.M. White, K.M. Hanson, L.A. Holland*, C. Eugene Bennett Department of Chemistry, West Virginia University,
Agilent 3100 OFFGEL Fractionator pi-based fractionation of proteins and peptides with liquid-phase recovery
 Agilent 3100 OFFGEL Fractionator pi-based fractionation of proteins and peptides with liquid-phase recovery Achieve unprecedented sensitivity in LC/MS-based proteomics experiments Sample complexity and
Hichrom Limited 1 The Markham Centre, Station Road, Theale, Reading, Berkshire, RG7 4PE, UK Tel: +44 (0) Fax: +44 (0)
 Fax: +44 (0)") Hichrom Limited 1 The Markham Centre, Station Road, Theale, Reading, Berkshire, RG7 4PE, UK Tel: +44 (0)118 930 3660 Fax: +44 (0)118 932 3484 Email: www.hichrom.co.uk Table of Contents Sample Injection...
Hichrom Limited 1 The Markham Centre, Station Road, Theale, Reading, Berkshire, RG7 4PE, UK Tel: +44 (0)118 930 3660 Fax: +44 (0)118 932 3484 Email: www.hichrom.co.uk Table of Contents Sample Injection...
Comparison of Different Brands of Carrier Ampholytes for Monoclonal Antibody Charge Heterogeneity Analysis by Capillary Isoelectric Focusing
 Comparison of Different Brands of Carrier Ampholytes for Monoclonal Antibody Charge Heterogeneity Analysis by Capillary Isoelectric Focusing Application Note Biotherapeutics & Biosimilars Author Christian