Supplementary Figure 1
|
|
|
- MargaretMargaret Clarke
- 5 years ago
- Views:
Transcription
 Antibody-oligonucleotide complexes appear as a high-molecular-weight smear when run on an agarose gel (1).")
1 Supplementary Figure 1 CITE-seq library preparation. (a) Illustration of the DNA-barcoded antibodies used in CITE-seq. (b) Antibody-oligonucleotide complexes appear as a high-molecular-weight smear when run on an agarose gel (1). Cleavage of the oligo from the antibody by reduction of the disulfide bond collapses the smear to oligo length (2). (c) Drop-seq beads are microparticles with conjugated oligonucleotides comprising a common PCR handle, a cell barcode, followed by a unique molecular identifier (UMI) and a polyt tail 1. (d) Schematic illustration of CITE-seq library prep in Dropseq 1 (downstream of Fig. 1b). Reverse transcription and template switch is performed in bulk after emulsion breakage. After amplification, full length cdna and antibody-oligo products can be separated by size and amplified independently (also shown in d) (e) Reverse transcription and amplification produces two product populations with distinct sizes (left panel). These can be size separated and amplified independently to obtain full length cdnas (top panel, capillary electrophoresis trace) and ADTs (bottom panel, capillary electrophoresis trace).
2 Supplementary Figure 2 Analysis of mixtures of mouse and human cells that were incubated with oligo-tagged-antibodies specific for either human or mouse cell-surface markers. (a) Fractions of human RNA molecules compared to human ADTs for detected cell barcodes in the Drop-seq species mixing experiment. Each point represents one cell barcode (i.e., droplet containing one or more cells). (b-e) CITE-seq of human and mouse mixing experiment repeated on a commercially available system from 10x Genomics. (b) Quantification of the number of human and mouse transcripts associating to each cell barcode. Each green point indicates a cell barcode (i.e. droplet containing one or more cells) from which we measured >90% human transcripts; each red point indicates a cell barcode with >90% mouse transcripts. Blue
3 points indicate cell barcodes (i.e. droplets) from which we observed a mixture of human and mouse transcripts. (c) Quantification of antibody tags (ADTs) associated with each cell barcode. Points are colored based on species classifications using transcripts in panel b. (d) Quantification of human, mouse or mixed-cell barcodes based on RNA transcripts, or ADTs, detected in 10x Genomics workflows. (e) Fractions of human RNA molecules compared to human ADTs for detected cell barcodes. Each point represents one cell barcode (i.e., droplet containing one or more cells).

4 Supplementary Figure 3
5 Comparing qualitative and quantitative readout in CITE-seq and flow cytometry. (a-b) Periperal blood mononuclear cells were processed by flow cytometry and CITE-seq to compare qualitative readout between both technologies. Relevant immune populations were labelled (a) and their abundances relative to the entire population compared (b, see also Fig. 2a,b). (b) Relative abundances of relevant immune cell subsets as determined by flow cytometry and CITE-seq (see Fig. 2a,b; and panel a) (c-e) Relative quantitative comparison of flow cytometry and CITE-seq. (c) Cells were first gated based on forward and side scatter and separated from dead cells. Profile of CD4 and CD8a fluorescence in CBMCs. Colored boxes are gates set to sort different levels of CD8. (d) Re-analysis of cells sorted into CD8a very-high (+++), high (++), intermediate (+) and low (+/-) by flow cytometry. Histograms of CD8a levels (fluorescence intensities) in the four different pools of cells. 2,000 cells were measured for each run. (e) CD8a levels obtained by CITE-seq of the different pools of cells sorted in panel a. Histograms of four CITE-seq runs of the separate pools cells were measured for each run.

6 Supplementary Figure 4 Gene expression in CBMC clusters.
7 (a) Gene expression heatmap of most differentially expressed marker genes defining clusters. Dimensionality reduction followed by modularity optimization was used to cluster 8,005 CBMCs (methods). Cluster color assignments are identical to Figure 3a. The mouse control cell population was excluded from the clustering. (b) Expression of individual marker genes in the context of tsne representation of cell relationships based on single-cell gene-expression profiles. Levels of transcripts corresponding to specific marker genes are indicated by blue shading.
8
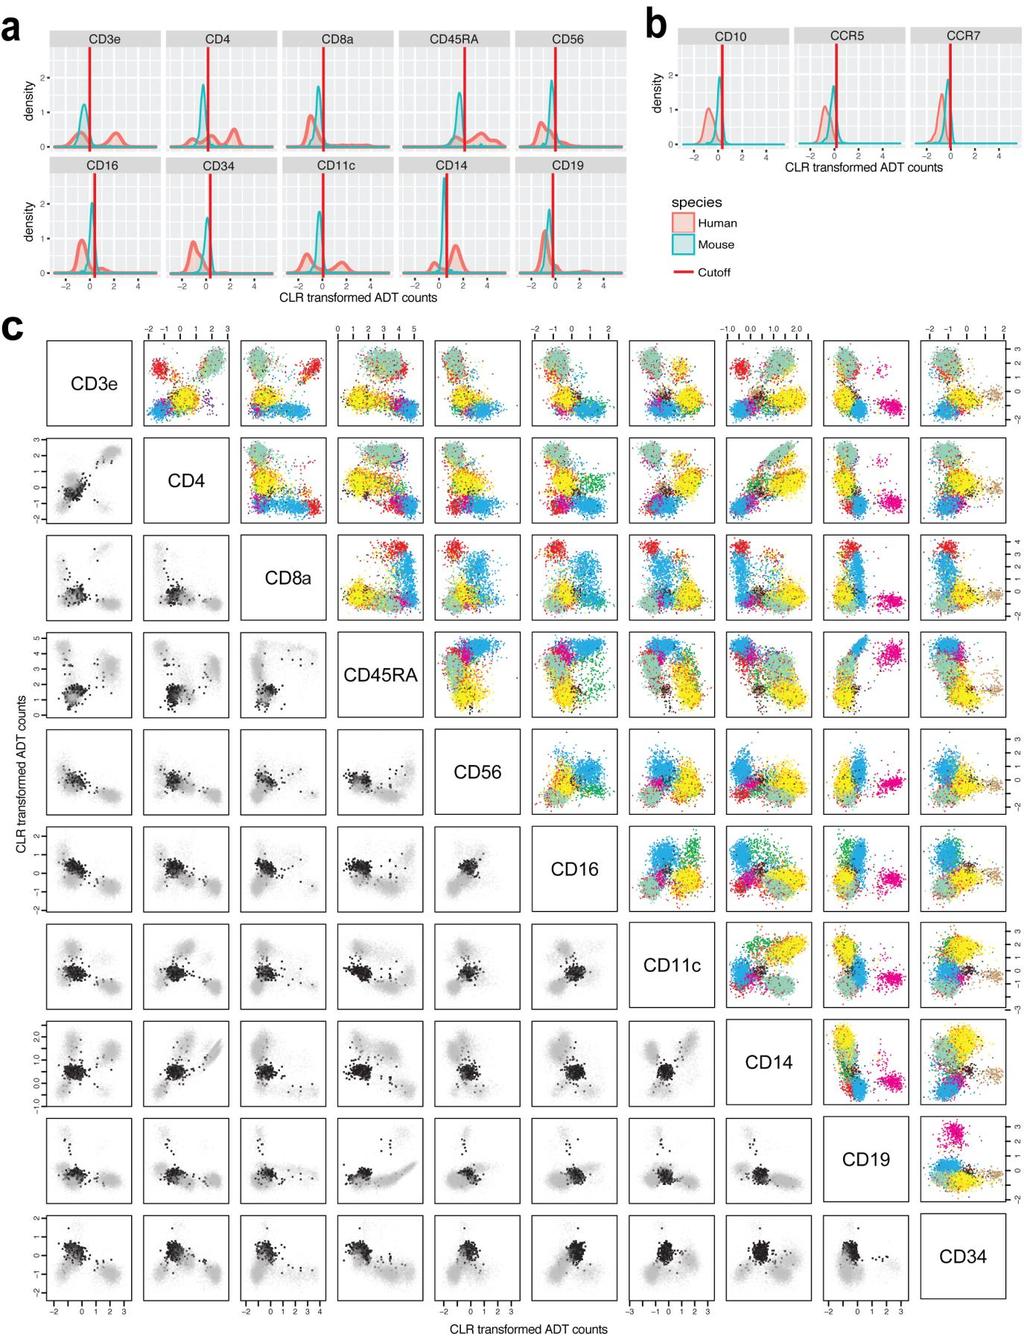
9 Supplementary Figure 5 Multimodal bi-axial plots. (a) Histograms of CLR-transformed ADT counts in CBMCs (red) and mouse control cells spiked at very low frequency (blue). Solid line shows the determined cutoff for significant ADT signal (mean of mouse values + standard deviation of mouse values). (b) Histograms of CLR-transformed ADT counts for the three antibodiesoligo conjugates in our 13 antibody pool that did not pass the mouse-derived threshold. (c) Multimodal bi-axial plots. Pairwise comparison of different CLR-transformed ADT levels in CBMCs. Upper right: CBMCs plotted with colors based on RNA clusters shown in Figure 3a. Lower left: mouse control cells (black) that were spiked at very low frequency are overlaid on the CBMCs (light grey).
10 Supplementary Figure 6 Joint analysis of protein and RNA to finely resolve NK cell (CD56 bright vs CD56 dim ) populations that have only subtle transcriptomic differences. (a) mrna (blue) and corresponding ADT (green) signal for CD56 and CD16 projected onto the NK cell cluster tsne plot. Darker shading corresponds to higher levels measured. NK cell cluster was split into CD56 bright and CD56 dim groups based on CD56 ADT levels. (b) Histogram of CD8a levels in the CD56 bright and CD56 dim cells. Two-sample Kolmogorov Smirnov test p-value < indicates two different CD8a distributions. Histograms for CD4 and CD45RA, ADTs that show low/absent or high expression in these cells, but no difference between CD56 bright and CD56 dim populations are shown as controls.

11 Supplementary Figure 7 Correlations between mrna and protein marker levels in CITE-seq. (a) Correlation between normalized mrna expression and CLR-transformed ADT counts at a single cell level. For each gene, cells with no detected mrna molecules were excluded. Pearson s correlation coefficient is shown in the boxed labels. (b) Correlation between normalized mrna expression and CLR-transformed ADT counts at the cluster level. No cells were excluded. mrna and ADT signals were averaged per cluster before calculating Pearson s correlation coefficient, shown in boxed labels.

12 Supplementary Figure 8
13 Clustering of CBMCs based on ADTs. (a) CITE-seq single-cell ADT profiles of ~8,005 CBMCs (and ~600 mouse control cells) were clustered using modularity optimization resulting in 17 cell populations (including the mouse control cell population) with distinct antibody compositions. (b) ADT levels for 10 markers in clusters defined by ADT levels. Levels of ADT are indicated by blue to dark blue shading. (c) Single-cell ADT level heatmap in the ADT-derived clusters. Colors of clusters in top panel represent colors in panel a. (d) Single-cell gene-expression heatmap of top marker genes of ADT-derived clusters. Colors of clusters in top panel represent colors in (a).
14 Technology or Method # transcripts # proteins # cells Reference Droplet based single cell RNA-seq > 4,000 - > 10,000 1,2,3 CyTOF - < 100 > 10,000 Flow cytometry / FACS - < 30 > 10, Abseq - > 100 > 10, Index-sorting scrna-seq > 4,000 < 30 ~ 96 - hundreds 5,6 Wafergen ICELL8 > 4,000 ~ 4 ~ 1,800 Fluidigm C1 > 4,000 ~ 4 ~ 96 - ~ 800 PLA or PEA & qpcr ~ 96 ~ 36 ~ 96 - hundreds 11,12,13,14 PLAYR ~ 20 ~ 20 > 10, Supplementary Table 1 Overview of methods that allow multiplexed measurements of RNA and/or proteins in single cells.
15 Antibody Reactive Clone CITE-seq barcode Supplier Note CD3e Human UCHT1 ATCACG BioLegend, USA CD19 Human HIB19 CGATGT BioLegend, USA CD4 Human RPA-T4 TGACCA BioLegend, USA CD8a Human RPA-T8 GCCAAT BioLegend, USA CD56 Human MEM-188 CTTGTA BioLegend, USA CD16 Human B73.1 TTAGGC BioLegend, USA CD11c Human B-ly6 TAGCTT BD Pharmingen, USA CCR7 Human GATCAG R&D Systems, USA CCR5 Human J418F1 ACTTGA BioLegend, USA CD34 Human 581 GGCTAC BioLegend, USA CD14 Human M5E2 AGTCAA BioLegend, USA CD10 Human HI10a AGTTCC BioLegend, USA CD45RA Human HI100 ACAGTG BioLegend, USA CD29 Human MA GCCAAT Thermo Fisher, USA used for Human/Mouse experiment only CD29 Mouse MA CTTGTA Thermo Fisher, USA used for Human/Mouse experiment only CD2 Human RPA-2.10 GAGTGG BioLegend, USA used in quantification validation only CD57 Human H-NK1 CGTACG BioLegend, USA used in quantification validation only Supplementary Table 2 List of antibody clones, supplier and barcodes used in this study.