High Resolution GC-MS Application: Metabolomics Vladimir Tolstikov, PhD
|
|
|
- Clarissa Jefferson
- 5 years ago
- Views:
Transcription
1 High Resolution GC-MS Application: Metabolomics Vladimir Tolstikov, PhD Eli Lilly and Company
2
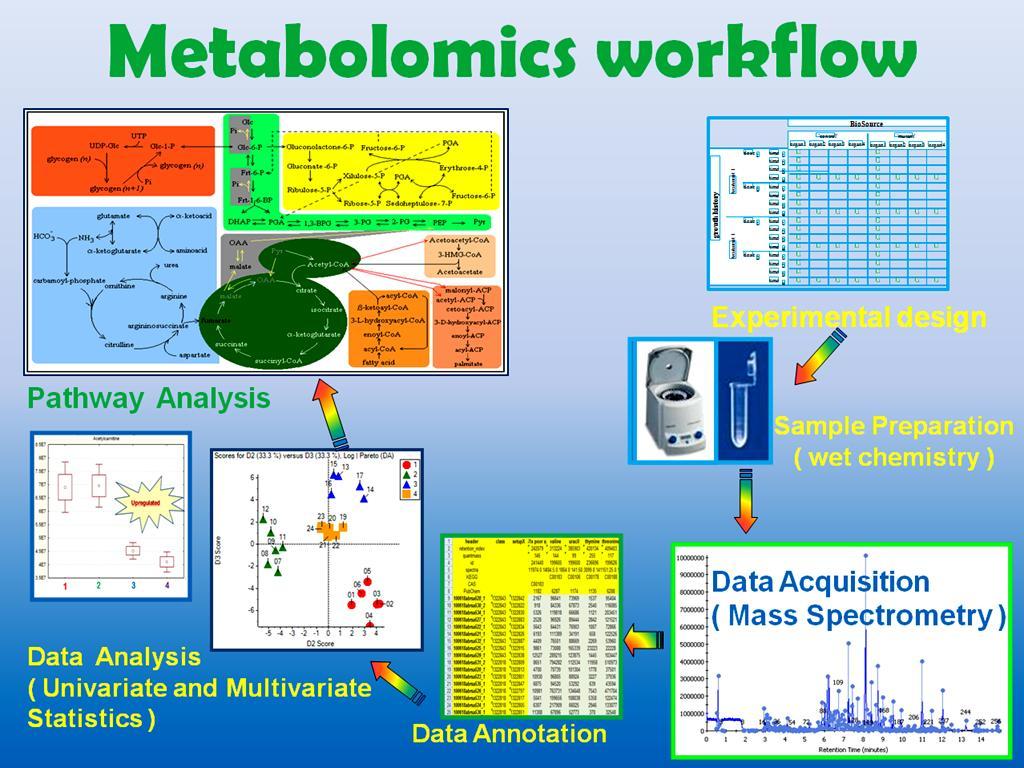
3 A Sample Harvest and Storage Biological Metadata Standard Operational Procedure Sample Extraction Sample Preparation RI internal standards, Derivatization Extraction Metadata Experiment Submission Sample Analysis QC, randomization Chromatography Metadata Mass Spectrometry Metadata Raw Data Metabolite Peak Annotation Data normalization, background subtraction, detection limit Analytical Protocols Statistical Analysis Processed Data Collection and Organization Pathway Analysis


4 GC/MS Lilly Metabolomics Platform Volatiles Alchohols Organic acids Essential oils Amino acids Organic amines Esters Catecholamines Nucleosides Perfumes Fatty acids Nucleotides Terpenes Phenolics Oligosaccharides Carotenoids Prostanglandins Peptides Flavanoids Steroids Co-factors Perfumes Sugar phosphates Polar Lipids LC/MS PEGASUS GC-HRT accurate mass TOF Gerstel ALEX/CIS MultiPurpose Autosampler Triple quad 5500 Triple TOF 5600 accurate mass
5 Lilly Metabolomics Platform Data Analysis and Visualization Statistical analysis: An array of commonly used statistical and machine learning methods : univariate -fold change analysis, t-tests, volcano plot, and one-way ANOVA, correlation analysis; multivariate - principal component analysis (PCA), partial least squares - discriminant analysis (PLS-DA) and PCA-DA; clustering - dendrogram, heatmap, K-means, and self organizing map (SOM)); supervised classification - random forests and support vector machine (SVM). Functional enrichment analysis: The analysis is based on several libraries containing ~6300 groups of biologically meaningful metabolite sets collected primarily from human studies; Metabolic pathway analysis: Pathway analysis (including pathway enrichment analysis and pathway topology analysis) and visualization for Human metabolic pathways with a total collection of 1173 pathways; Pathway analysis : MetPA, Ingenuity, GeneGo
6

7 Human urine GC/MS profiling Throughput Quality
8 8.0e7 6.0e7 Mouse CSF Sample volume - 2uL Methoxyamine, MSTFA 2% TMSCI 1 ul splitless, CIS C4 injector Detector EI 70ev 4.0e7 2.0e7 0.0e0 Time (min:sec) 12: : : : : : : : :50.00 AIC 1.2e6 1.0e6 8.0e5 >60% probability score >3000 peaks deconvoluted >1200 names assigned ~ 75 metabolites identified 6.0e5 4.0e5 2.0e5 0.0e0 Time (min:sec) 12: : : : : : : : :50.00 AIC
9 Metabolomics study requirements for GC/MS instruments GC-HRT 1 Sensitivity 2 Fast acquisition 3 Robustness 4 Reproducibility Unique features 1 Routine stable high resolution 2 Routine stable high mass accuracy 3 True peak deconvolution 4 Elemental composition assignment

10 High Resolution, High Mass Accuracy: YES or NO ID

11 High Resolution, High Mass Accuracy: YES or NO ID

12 High Resolution, High Mass Accuracy: YES or NO ID
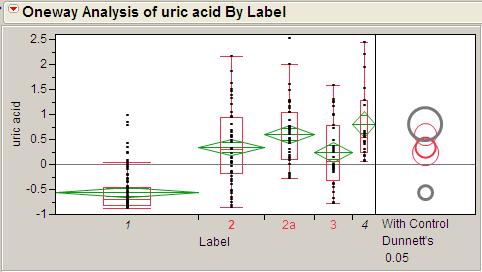
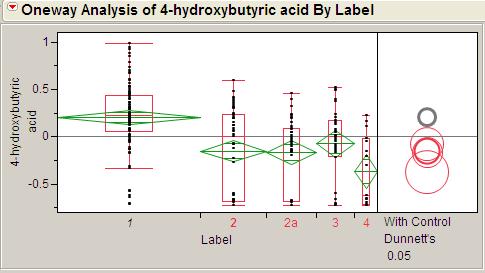
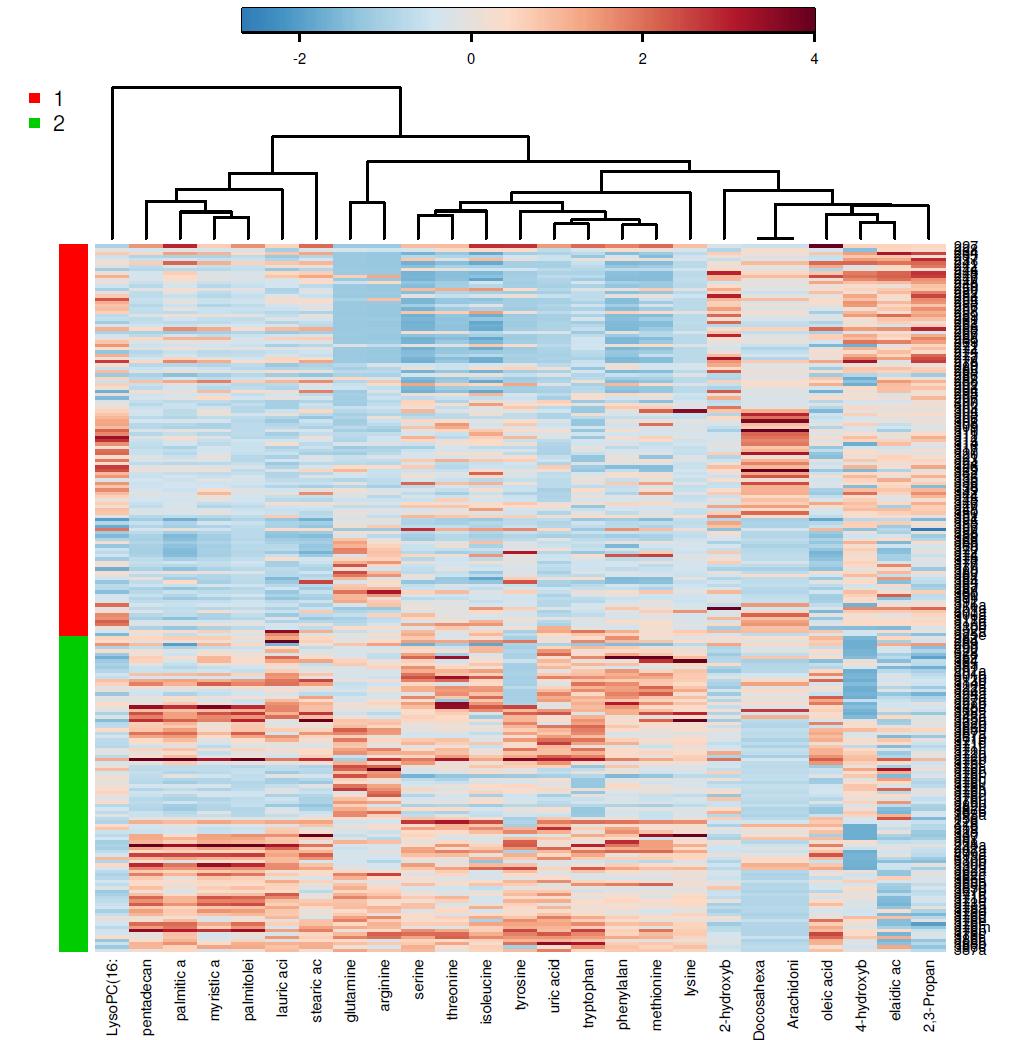
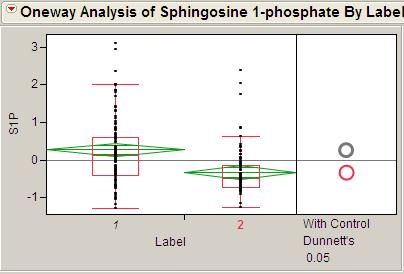
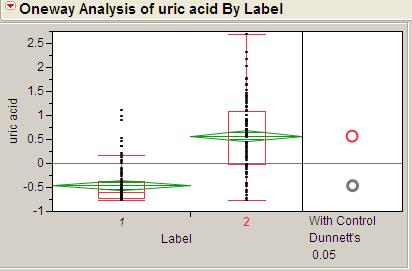
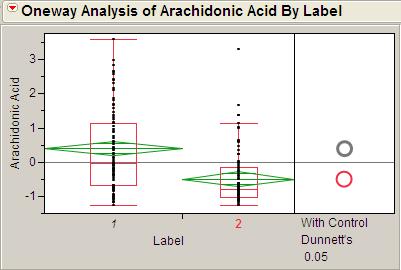
13 Case study Pancreatic Cancer Cohort Study Design PDAC patients Group 1 Healthy volunteers 55 Group 2 Benign cyst 41 Group 2a Chronic pancreatitis 32 Group 3 Other cancers 19 Group 4 Unpaired samples. Blood plasma analysis. GC/TOF/MS - 70 polar metabolites, LC/MS/MS (MRM) panel: Eicosanoids, LPA, SP1, SPA1, Bile acids, PC. 30 non-polar metabolites Study performed in UC Davis Genome Center, Davis CA, USA
14
15 PLS-DA Random Forest
16
17
18
19
20


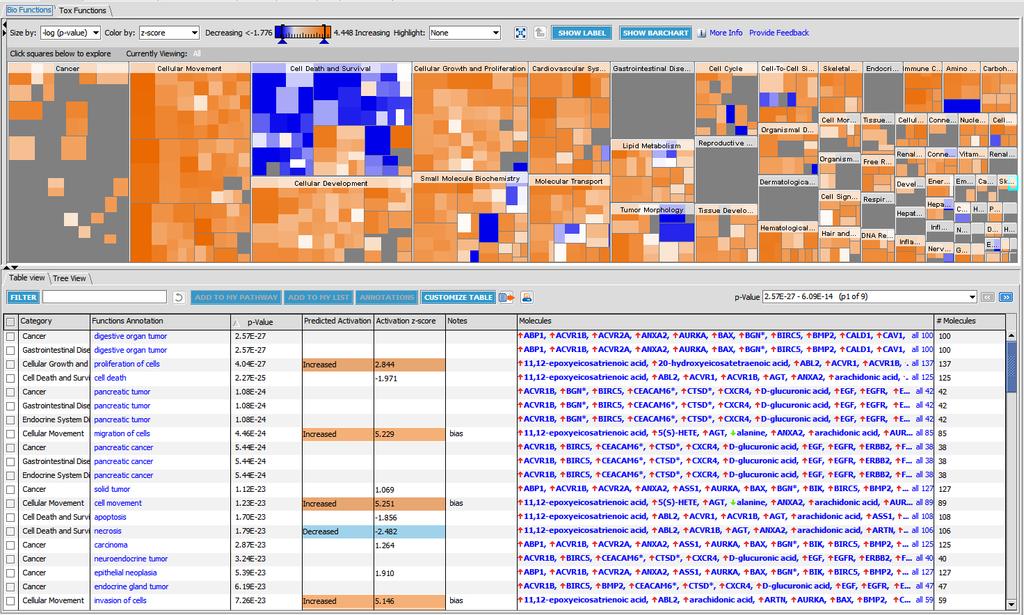
21 Cross platform data integration: Metabolomics data obtained from current study: 95 metabolites Transcriptomics data was retrieved from Pancreatic Expression Database: 255 genes
22
23 Experimental Data
24 Prediction
25 Carbohydrate Metabolism, Energy production, Small Molecule Biochemistry Experimental Data
26 Carbohydrate Metabolism, Energy production, Small Molecule Biochemistry Prediction

27 Small molecule biomarkers Current study

28 Univariate Classic ROC analysis for selected metabolite ratios
 were performed and the results were averaged to generate the plot with threshold averaging.")
29 Multivariate ROC analysis (PLS-DA) The prediction model was composed of 15 features. 21 random samples from each group were allocated as hold-out data for validation. 100 cross validation (CV) were performed and the results were averaged to generate the plot with threshold averaging. Group 0 PDAC patients; Group 1 - controls red circles - predicted scores for hold-out samples Numbers samples classified to the wrong group
30 Multivariate ROC analysis (PLS-DA) The average accuracy based on 100 cross validations is The accuracy for hold out data prediction is 0.905(38/42). Performance Measure: Area under ROC curve Permutation Times: 100 AUC, sensitivity, specificity, and accuracy were 0.965, 95.0%, 95.0%, and 90.0%, respectively, according to the training set data.
31 Screening a panel of biomarkers might be effective by embracing the idea that pancreatic adenocarcinoma has vast genetic heterogeneity, meaning no single biomarker exists that is strongly correlated with its diagnosis across the population of people who develop the disease. Using a statistical model, it is possible to determine that many of so called weak biomarkers, having 95 percent specificity for the disease, on average, have only a 32 percent sensitivity. Increasing number of weak biomarkers it would be possible to achieve required 99 percent sensitivity. There is hope for developing a panel that would have greater than 99 percent accuracy. American Association for Cancer Research, Press Release 2012
32 Acknowledgments Prof. Shiro Urayama, MD, UC Davis, Department of Gastroenterology and Hepatology, Davis, CA, USA Dr. Jean-Noel Billaud, PhD, INGENUITY SYSTEMS, Redwood City, CA, USA Dr. Wei Zou, PhD, Kindra Brooks, BS, UC Davis, Genome Center, Davis, CA, USA