To generate the luciferase fusion to the human 3 UTRs, we sub-cloned the 3 UTR
|
|
|
- Ashlyn McLaughlin
- 5 years ago
- Views:
Transcription
1 Plasmids To generate the luciferase fusion to the human 3 UTRs, we sub-cloned the 3 UTR fragments downstream of firefly luciferase (luc) in pgl3 control (Promega). pgl3- CDK6 was made by amplifying a 2,886 base pairs (bp) segment of CDK6 3'UTR from human genomic DNA, adding Xba1 sites in both primers. This product was digested with Xba1 and ligated into pgl3-promoter (Promega) digested with XbaI and treated with CIP. Similarly, pgl3-ccnd2 and pgl3-cdc25 were constructed by amplifying a 2,114 bp segment of the 3'UTR of human CCND2 and a 1,37 bp segment from the 3'UTR of human CDC25A, respectively, and cloning them in pgl3 digested with Xba1. pgl3-nras was previously described (1). These constructs were transfected along with an expression vector encoding renilla luciferase in HeLa cells grown to 9% confluence in 24-wells plates using Lipofectamin 2 (Invitrogen) according to the manufacturer's instructions. 2'-O methylated anti-let7b or negative control anti-mir (Ambion) were included as indicated to a final concentration of 2nM. Cells were harvested 24 hrs after transfection, and luciferase activity was assayed using a dual luciferase assay kit (Promega). The values of firefly luciferase activity were normalized by the values of renilla activity. Triplicate repeats of this experiment were performed. Each value of luciferase activity in the samples treated with let-7b anti-mir was normalized by the average luciferase activity value of the samples treated with negative control anti-mir. RT-PCR Detection of let-7 Expression in Cell lines: Human cultured cell line RNA was isolated using the mirvana PARIS RNA isolation kit (Ambion). Twenty ng of RNA from the small RNA fraction was converted to cdna using MMLV-RT
2 (Invitrogen) with the following incubations: 16ºC for 15 min; 42ºC for 15 min; 85ºC for 5 min. All available TaqMan microrna assays were used for expression analysis: hsa-let- 7a, -7b, -7c, -7d, -7e, -7f, -7g, and -7i (Applied Biosystems). Following cdna synthesis, qrt-pcr was performed on the ABI Prism 79HT SDS (Applied Biosystems) using Platinum Taq Polymerase (Invitrogen) with the following cycling conditions: 95ºC for 1 min (initial denature); then 5 cycles of 95ºC for 5 sec, 6ºC for 3 sec. Gene Ontology (GO) analysis: GO analysis was performed using the GO-annotations downloaded from GO IDs were mapped to NCBI Gene IDs using the index file downloaded from ftp://ftp.ncbi.nlm.nih.gov/gene/. This index file only mapped the lowest level GO IDs in the GO hierarchical data structure to NCBI Gene IDs, and therefore a recursive search, based on the GO annotations, was performed to map all the parent GO IDs to NCBI Gene IDs. Hypergeometric tests were performed to calculate the enrichment p-values for the affected GO categories due to let-7 overexpression.
3 Literature cited: 1. Johnson SM, Grosshans H, Shingara J, et al. RAS is regulated by the let-7 microrna family. Cell 25;12(5):
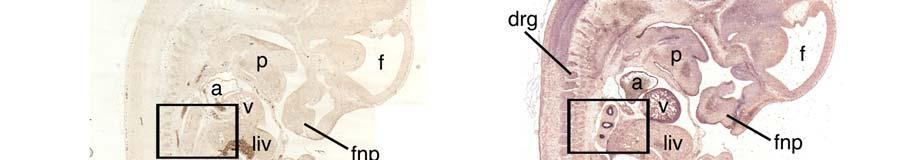
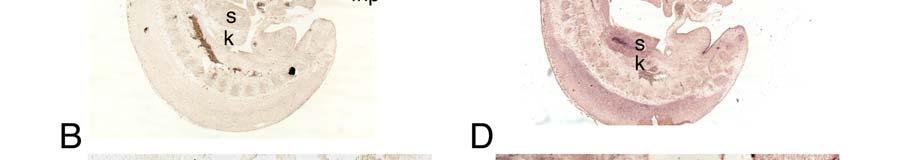
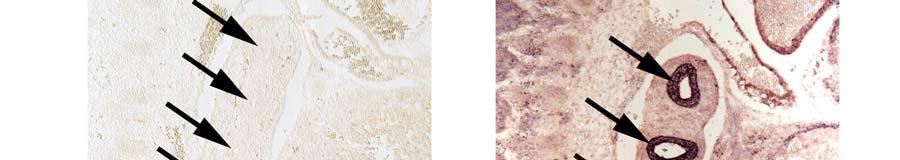
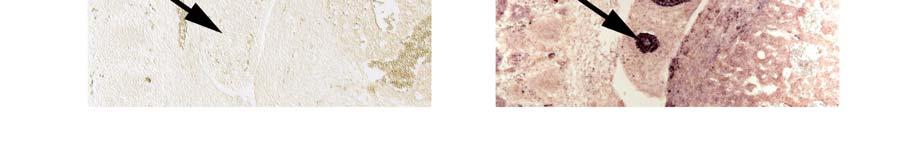
4 Supplemental Figures: Supplemental Figure 1: let-7c expression during mouse embryogenesis. A; in situ hybridization analysis of an E12.5 mouse embryo using a scramble control probe that was tail-linked with UTP-Digoxigenin. B; higher magnification of the lung shown in (A). C; let-7c expression in an E12.5 mouse embryo is found in various organs. Note that the let- 7c expression patterns are similar to those for let-7a (Figure 1C-D). D; higher magnification of the lung region in (C) shows intense let-7c expression in the bronchial system (black arrows). Abbreviations; a, atrium of heart; drg, dorsal root ganglion; f, forebrain; fnp, frontal nasal prominence; h, hindbrain; k, kidney; liv, liver; m, midbrain; p, palate; s, stomach; v, heart ventricle. Supplemental Figure 2: Expression of let-7 in adult mouse lung. In situ hybridization analysis of adult lung (B) shows let-7a expression within the bronchial system (black arrows). An adjacent section of the lung (A) was stained with Hematoxylin and Eosin for histological analysis. Abbreviations: a, alveolar cells and b, bronchus. Supplemental Figure 3: let-7 expression in various lung cancer cell lines, HepG2 and normal lung. Shown are a quantification of qrt-pcr analysis of all let-7 family members. All values are presented as copies per cell wherein we assumed that there was 1 pg of total RNA per cell. Supplemental Figure 4: HepG2 and A549 cells were transfected in quadruplicate with Pre-miRs for let-7b, mir-124, Negative Control 1, and Negative Control 2. RNA was
5 isolated from samples at 72 hours post-transfection and analyzed by mrna array analysis. Principle Component Analysis revealed close correlation between the expression profiles and cells transfected with the two negative control Pre-miRs and disparate effects of mir-124 and let-7b. B.

6 Suppl. Figure 1: Suppl. Figure 2:
7
8 12 let-7a A549 H52 H522 H1299 SK-LU-1 H46 H226 WI-38 HEPG2 Ambion 7 let-7b A549 H52 H522 H1299 SK-LU-1 H46 H226 WI-38 HEPG2 Ambion 4 let-7c A549 H52 H522 H1299 SK-LU-1 H46 H226 WI-38 HEPG2 Ambion
9 4 let-7d A549 H52 H522 H1299 SK-LU-1 H46 H226 WI-38 HEPG2 Ambion 14 let-7e A549 H52 H522 H1299 SK-LU-1 H46 H226 WI-38 HEPG2 Ambion let-7f A549 H52 H522 H1299 SK-LU-1 H46 H226 WI-38 HEPG2 Ambion
10 14 let-7g A549 H52 H522 H1299 SK-LU-1 H46 H226 WI-38 HEPG2 Ambion let-7i A549 H52 H522 H1299 SK-LU-1 H46 H226 WI-38 HEPG2 Ambion Suppl. Figure 3:

11 Suppl. Figure 4.