Case Study on Application of Analytical Life Cycle Management and Risk Management
|
|
|
- Todd Charles
- 5 years ago
- Views:
Transcription

1 Case Study on Application of Analytical Life Cycle Management and Risk Management Jianmei, Ph.D. Genzyme, a Sanofi Company AAPS 2015 Dione Pompe disease Brazil
2 Outline Introduction of Concepts Analytical lifecycle management (ALCM) ALCM road map and phase-dependent activities Analytical quality-by-design (AQbD) methods development Overall ALCM elements Case Studies Clinical phase: 1 example Commercial phase: 1 example Analytical Lifecycle Knowledge Management Conclusion 2
3 Product Lifecycle Includes the Following Technical Activities for New and Existing Products Pharmaceutical Development Drug substance development Formulation development (including container/closure system) Manufacture of investigational products Delivery system development (where relevant) Manufacturing process development and scale-up Analytical method development Technology Transfer New product transfers during development through manufacturing Transfers within or between manufacturing and testing sites for marketed products Commercial Manufacturing Acquisition and control of materials Provision of facilities, utilities, and equipment Production (including packaging and labeling) Quality control and assurance Release Storage Distribution (excluding wholesaler activities) Product Discontinuation Retention of documentation Sample retention Continued product assessment and reporting 3 Reference: ICH Q10
4 Continuous Improvement Requires Continuous Improved Analytical Methods Sub-optimal methods lead to inaccurate and imprecise data. Effort made to manufacturing process and product quality improvement cannot be reflected. Huge cost already incurred, but quality-related problems remains unclear whether they are solved or not. Analytical methods improvement must be synchronized with product lifecycle management. 4
5 Analytical Lifecycle Management Ensures that the analytical methods from initial development to commercial use are best suited for their intended use at various stages A lifecycle approach Offers continuous strong science input Introduces up-to-date technology Implements balanced approach for risk and benefits assessment and control Combines with long-term business vision Scope: Drug Substance, Drug Product, Raw Material, and Reference Standards 5
6 Retirement Analytical Method Lifecycle Road Map Method Development Method Assessment Phase 1 Phase 2 Phase 3 Commercial Formulation and process development Method Transfer CRO or internal QC Formulation and process improvement Method Qualification Method Validation Routine Use Phase 1 - Method development - Appropriate for use Phase 2 - Method development - Method qualification Phase 3 - Method development - Quality risk assessment - Method qualification - Method validation Commercial - Method routine use - Method fit for purpose assessment - Risk benefits assessment - Method improvement vs redevelopment - Method qualification - Method validation 6


7 Analytical Quality by Design Approach Define Intended purpose Identify ATP, e.g., accuracy, precision, etc. Method Scouting Risk Assessment Continuous improvement and lifecycle management 7 Analytical Method Implementation Study factors that affect method performance, DOEs for multivariants or parameter screening. Use Drylab for chromatogr. methods, etc. Reiterate the process until meeting method performance criteria Method Validation Method development Sufficient statistical data support of design space for analytical method.
8 AQbD within the Regulatory Quality System Extension of QbD drug development to analytical methods Systematic Method Development Strategy (MDS). Help to obtain a method with optimal performance. Incorporated ICH Q8, Q9, and Q10 Comply with GMP requirements Quality Risk Management, ICH Q9 Quality System, ICH Q10 AQbD GMP cgmp Pharmaceutical Development (Quality by Design, ICH Q8
9 Traditional Method Development Define a Method. Perform one experiment after another. Figure out problems during investigational experiments. Can easily diverge from original experimental plan. May take a long time to reach the goals for method development. No guarantee of method robustness and other method quality attributes. 9
10 Benefits of AQbD Approach for Methods Development A systematic approach which examines every aspect of the method during development. Can be used as a stand-alone to probe existing old methods or, Can be easily broaden to a platform applications (one type of method for multiple products or multiple methods from the same product) where strong scientific knowledge can be fully realized. Method validation for traditional method is a key activity. In AQbD, method validation becomes predictable. Great level of confidence is gained using QbD developed analytical methods for spec setting with improved data quality. 10
11 Analytical Method Qualification Provide authorities with first results on method performance and the setting of validation acceptance criteria for future ICH validation. A study to find out sticky points, e.g., certain steps are not well designed for routine QC testing. 11
12 Analytical Method Validation The objective to validate an analytical method is to demonstrate that the method is suitable for intended purpose. ICH Q2 (R1): Validation of Analytical Procedures: Text and Methodology 12
13 Analytical Method Transfer FDA Draft Guidance, 2014 Guidance for Industry Analytical Procedures and Methods Validation for Drugs and Biologics USP <1224> The transfer of analytical procedures (TAP), also referred to as method transfer, is the documented process that qualifies a laboratory (the receiving unit) to use an analytical test procedure that originated in another laboratory (the transferring unit), thus ensuring that the receiving unit has the procedural knowledge and ability to perform the transferred analytical procedure as intended. Sending Unit Team Project Manager Analytical Technical Team (including statisticians) Quality Control Quality Assurance Regulatory Affair Receiving Unit Team Project Manager (CRO) Analytical Technical Team Quality Control Quality Assurance Regulatory (if not in the same country) 13
14 Method Transfer Continuation Transfer assessment: Scope definition, gap analysis and risk assessment for readiness check before transfer. Transfer approach: Comparability, co-validation, complete or partial validation, or transfer waiver. Transfer requirements: Transfer plan, transfer protocol, transfer statistical design, and transfer results acceptance criteria. 14
15 Analytical Method Transfer from Development to Qualification and Validation Valuable new findings using new labs and naive users. It is advantageous to have 2 labs involved in 3 steps, Development, Qualification, and Validation to enhance method reproducibility 15
16 Analytical Method Routine Use Methods to be used for release and stability testing need to monitored for OOT and OOS results Data accuracy Data variability Failure rate of method execution Easiness of method operation Cost of operation 16
17 Analytical Method Assessment During routine use, the testing lab does periodic assessment to determine whether changes, improvement, additional validation, etc. are necessary. Assessment Trigger Frequent analytical failures Process or formulation change (clinical phase) Periodic product review (PPR) (commercial phase) Test Method Assessment Is this method suitable for intended use for supporting drug development or for QC testing? Phase dependent effort based on regulatory requirements, e.g., validation status. 17
18 Case 1: Methods in Support of Clinical Phase Studies 18
19 AU Example 1: Developing a RP HPLC-UV method for a Phase 3 Product CMA: K Imp 1 Imp 2 Imp 3 API Imp 4 Imp CMA: baseline CMA: rlsn CMA: baseline CMA: baseline Minutes CMA=Critical method attributes 19 Reference: Jianmei, QbD sunrise section at AAPS 2008
20 Method Assessment If the product continues to the later phase, the analytical method needs to be improved for better accuracy, precision, impurity quantitation, method robustness, and other QC method requirements. 20
21 Identification of Method Analytical Target Profile ATP Must Have Details Stability-indicating Can detect changes using forced-degradation samples Quantitative Assay for API Quantitate API in the range of % Quantitative Assay for Impurities Quantitate each individual impurity Precision Precision and intermediate precision for API and impurities Specificity No interference. For stability-indicating methods, peaks of interest with required resolution Accuracy For both API and impurities Reproducibility Analysts, days, and labs Robustness Method parameters operate in a flexible design space Linearity and Range Linear regression for API and impurities QL must be able to quantitate impurities at 0.05% QC method consideration System suitability, operation easiness, procedures leads to minimal operational errors, working reference standard, reagents, expiration date, column, etc. 21
22 Risk Assessment: Fishbone Diagram and Scores Dilution solvent type (500) Standard preparation Dilution solvent type (500) Sample preparation Dilution vol (100). Weighing error (100) Dilution vol. (1) Weighing error (100) Pipetting error (100) Pipetting error (100) CMA Column type (1000) Organic modifier (1000) Column brand (1000) Mobile phase composition (1000) Wavelength (1000) Mobile phase ph (1000) HPLC UV Analysis Score =Probability x Impact x Detectability CMA: critical method attributes 22
23 HPLC Method Development Analytical Target Profiles Evaluate critical method parameters e.g., Assay value range, RT window and Resolution for impurities Tool: API spiked with impurities DOE studies to determine influencing factors to method parameters Perform forced degradation using DS and DP Systematic Approach ph Column Mobile Phase Wavelength Factors: organic modifier content, organic% in gradient, temp., and flow rate Responses: Assay value and RT for API, Impurity RT window, Resolution Parameters Check the resolution of impurities and degradants DOE studies to understand method robustness, set control ranges for method NOR=normal operating range, PAR=proven acceptable range 23 Reference: Jianmei, QbD Sunrise Session at AAPS 2008 NOR PAR Parameter Variation Range A Robust Method
24 Columns and Buffer Screening Response: Chromatographic UV Appearance 0.15M Ammonium Formate 0.15M Ammonium Acetate 0.15M Phosphoric Acid 0.15M Acetic Acid 0.15M Formic Acid 0.15M TFA Waters Atlantis T YMC ODS A TSKgel ODS-100V Agela Venusil ASB C Ace C Ace 3 C Good Chromatography 0 Poor Chromatography 24 Risk Assessment and Risk Control Strategy: - Perform experiments for parameters with high risks (HPLC method) - DOE studies for parameter design space or control range. Reference: Jianmei, QbD Sunrise Session at AAPS 2008
25 AU Imp 1 Imp 2 Imp 6 isomer Imp 3 Imp 4 Imp 5 AU Imp 1 Imp 2 Imp 3 Imp 4 Imp 5 Imp 6 A Robust HPLC Method Developed for API Assay and Critical Impurities and Degradation Products API Old Method (210 nm) New Method (280 nm) Method Improvement - Flat baseline for accurate integration - Satisfactory recovery of impurities - Column optimized - Sample preparation procedure optimized, proper solvent not to degrade API - Rigorous system suitability for final QC method Minutes Method accuracy: % Precision: RSD<=2.0% Method is accurate and precise for Assay determination. Method is specific, stabilityindicating for quantitation of impurities and degradants DP Old Method Interference from Capsule shell New Method Clean Baseline Minutes 25 Reference: Jianmei, QbD sunrise section at AAPS 2008
26 What Else Is Not Checked? If Potency (assay) = 98% while Purity = 90%, What is missing? Assay is run by determining potency of drug against a reference standard. Purity is run by HPLC-UV, normalizing all peaks to 100%. Can over report high UV-absorbing peaks. Check method mass balance Check peak purity-uv spectra using the online UV detector Use LC-MS as an orthogonal method, identify impurities and determine correction factors (response factors can be vary different for different impurities) 26
27 Use Forced Degradation Study Samples Lot Degradation Condition RSD% (method) % Difference (Assay vs Purity) 1 Control Photo-exposure Heat ph ph ph ph7/h2o H2O2-Fe Control Heat/Moisture ph ph ph 6.9/H2O ph 8/H2O Forced-degradation level : <20% Good agreement was found for % Purity vs % Assay across various possible degradation pathways for drug product. 27
28 New Method Implementation Bridging study (study protocol, study design, and study report). Ensure all new issues are addressed, e.g., new impurities and specifications. Data for regulatory submission for the new method. 28
29 Case 2: A commercial phase product method development and change 29

30 A Platform Analytical QbD Methods Development Strategy One Product : same QbD method development strategy for different methods Multiple Products: minimal method development effort with small variations One Product Method 1 Product 1 Method 2 Product 4 A method Product 2 Method 3 Product 3 30
31 31 Commercial Phase Analytical Method Assessment A balanced approach: risks and benefits Comparability studies are required when substituting approved procedures with alternative analytical procedures. FDA requires that the change provides the same or increased assurance of the identity, strength, quality, purity, or potency of the material being tested as the analytical procedure described in the approved application. Ref: FDA draft guidance: Industry Analytical Procedures and Methods Validation for Drugs and Biologics Fully assessment (minimally every five years) to each test method Test methods full assessment Usability: performance in QC testing labs Adequacy: meet the requirements, proper technology strong scientific rationale, and designed for intended use Purpose: Fit for intended use Validation: comply to current regulatory standards Regulatory commitment: audit, filing, post-marketing commitments
32 AQbD Platform Approach to 4 Analytical Methods Development for 2 Drug Products 32


33 Risk Assessment for 2 Methods for Protein X 33
34 Risk Assessment for 3 Protein Methods 34


35 AU AU Initial Statistical DOE to Guide Decision Making for Method Conditions BT9 % BT9-10 = 2.6% BT9-10 Missed cleavage 5% Minutes BT9 % BT9-10 = 11.8% BT9 % BT9-10 = 3.5% BT BT Minutes 35

36 Final DOE Study-Surface Response Pattern Temp (C) Time (hr) Missed cleavage (%) a a A A Method Operable Design Region
37 Finding Root Cause for Uncertainty in UPLC-MS Oxidation Quantitation Method: Potential Artifacts Which step can cause artifacts of oxidation which leads to inconsistent oxidation measurement? -Sample preparation steps - Enzyme quality - Glassware wash - Reagent quality - Buffer type -Sample storage - Solution stability Confirmed: Not introducing oxidation artifacts -HPLC analysis - Residual metal effect -Mass spectrometry analysis - Ion source artifacts - Stable ionization signal - Charge state distribution for quantitation consideration Need to be confirmed. Not introducing oxidation artifacts 37


38 DOE Studies for UPLC-MS Method Optimization R2=0.94 for model fitting Expected 100% recovery Recovery results 38
39 Two Methods with 2 Different Intended Purposes Identify peptides that represent the sequence of a protein 10min 40min Minutes Injection Id: 4916 SampleName: TSH_tryptic_4hr_07Feb14_S1 Channel Id: 4917 Injection Id: 4941 SampleName: TSH_tryp_300uL_totalV_07Feb14_S3 Channel Id: 4942 Quantify the Oxidative Peptide in a protein UV Oxidized peptide min SIM MS MS min

40 Use Simulation Software DryLab to Help Method Development E I A B C D F G H Wei Wu. Poster W4255

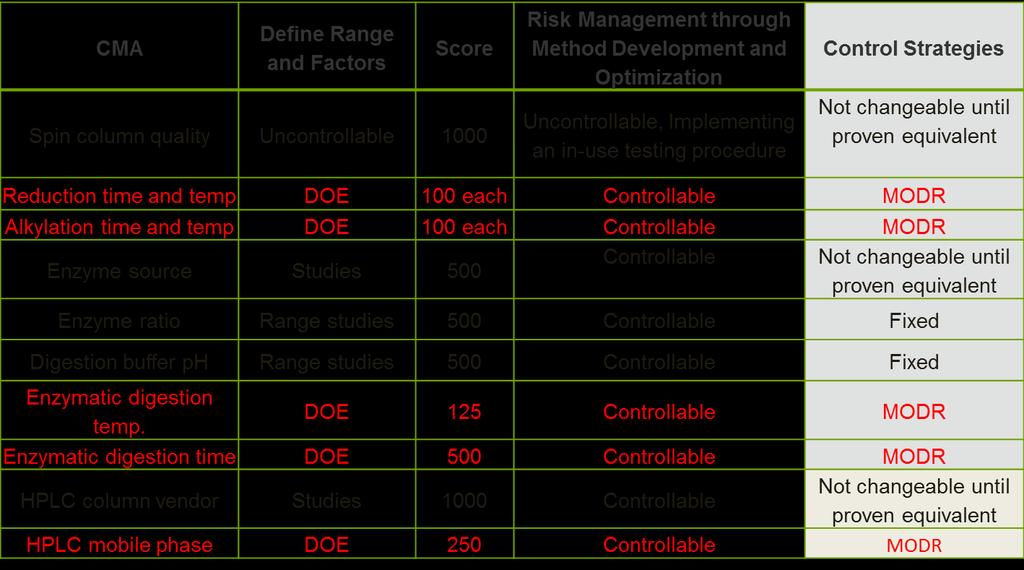
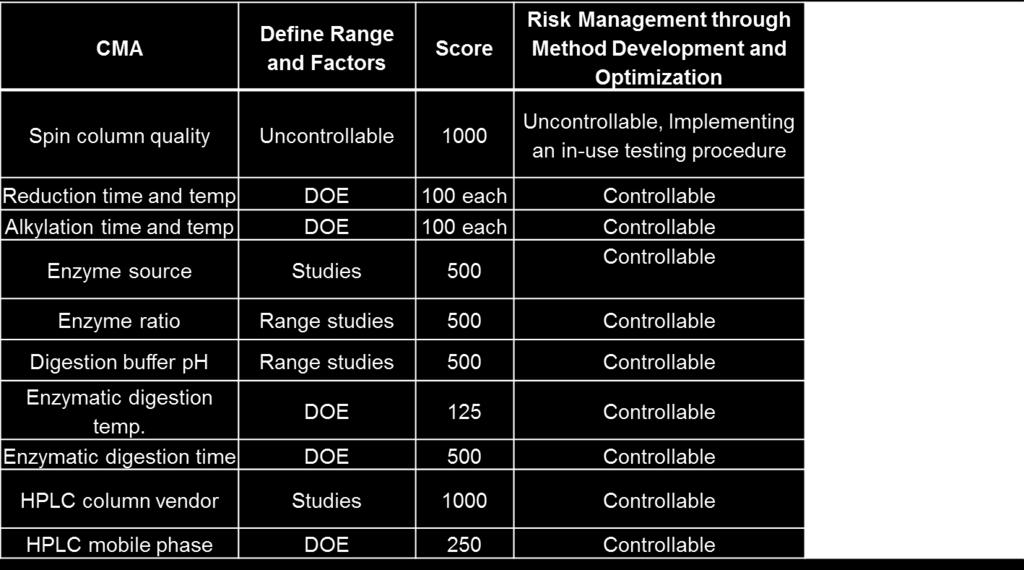
41 Just these 4 methods will save $500K per year. More method per product will same more $$$ Reduction: 30 ± 5 min at 60 ± 5 ºC Alkylation: 60 ± 10 min at 23 ± 3 ºC Analysis: 75 min UPLC-UV for Protein 2 peptide mapping and oxidation Desalting: 10 min using 6K spin columns Trypsin Digestion: h at ºC, ph 7.6 Analysis: 55 min UPLC-UV for Protein 1 peptide mapping Analysis: 30 min UPLC-MS for Protein 1 oxidation quantitation Asp-N Digestion: 2 h at ºC, ph 8.0 Analysis: 50 min UPLC-UV analysis for Protein 1 C-terminal truncation Saved $ K per method during method development and validation 41
42 Method Quality is Built-in During Method Development Following an AQbD Approach Method validation becomes a predictable exercise Method Quality Built in During the Development Specificity Linearity Accuracy Precision Range QL Robustness Solution Stability Method is ready to be qualified and validated in QC laboratory. 42
43 Analytical Lifecycle Knowledge Management A systematic approach to acquiring, analyzing, storing, and disseminating information related to products and manufacturing processes, and components Establish a knowledge repertoire Development activities Transfer activities Method knowledge repository which contains the information from the various stages of the method lifecycle Validation study knowledge (lifecycle of the analytical procedures and changes) Ensure product quality control in a controlled and consistent manner Knowledge management is an important factor in ensuring ongoing effectiveness of the control strategy 43
44 Conclusion Analytical Lifecycle Management A systematic approach for ensuring that methods are properly developed, qualified or validated, and managed at different stages of lifetime. Analytical Quality by Design Methods Development Ensures that methods are developed for intended purpose and the method quality is built-in during development. A quality method enhances its performance and reduces cost at each step of analytical lifecycle management. The elements of quality risk management and knowledge management Ensures ongoing quality control and improvement of the analytical methods. 44
45 Acknowledgements Genzyme Yimin Hua, PhD Wei Wu, PhD Qian Guan, PhD Juan Castaneda-Merced Natalya Atlasevich, PhD Pilsoo Kang, PhD Jane Chen Zhongyu Xie, PhD Sam Burns Chris Willis 45