Mochamad Nurcholis. Food Technology Department Agricuktural Technology Faculty Brawijaya University 2013
|
|
|
- Tyrone French
- 5 years ago
- Views:
Transcription

1 Mochamad Nurcholis Food Technology Department Agricuktural Technology Faculty Brawijaya University 2013
2 Microbial Identification Type Conventional Identification DNA Hybridization PCR Amplification DNA Sequencing
3 Note existence of other methods of visualization beyond Gram stain... Note Phenotype- vs. Genotype-based classification.
4 Conventional Identification : Phenotypic identification Macroscopic appearance Microscopic appearance Biochemical test serological test Modern /rapid detection: Genotypic identifiaction Genetic characteristics (PCR method) DNA hybridization DNA sequencing
5 Macroscopic : Morphology of colony : shape, elevation, surface, margin, growth microbes on agar or broth Microscopic : Characteristics of living cells : motility, shape, Staining (Gram staining, endospore staining, flagella staining)
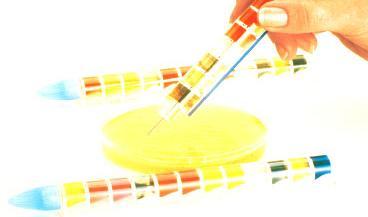
6 Biochemical testing: Catalase test Oxidase test Gas production Urease test Fermentative activities Sugar metabolisms Indole test MR-VP test etc
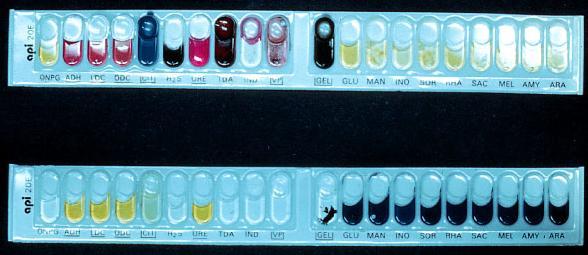
7
8 Don t worry about the specific details of this key but do keep in mind how it is organized.
9 Membrane fatty acids: Used for identification only. A particular species or species in a genera contain signature fatty acids. Compare an unknown fatty acid with known fatty acid profile in a database.

10 Slide agglutination antiserum and slides Enzyme-Linked Immunosorbent Assay (ELISA) antibodies and microplates. Western Blotting: -antigens are separated by a gelelectrophoresis -detect antigens using radioactive or fluoresence tagged antibodies
.")
11 Phages are viruses of bacteria. This is a Soft-Agar Overlay. The clear spots are due to bacteria killing (lysis). Phage = Bacteriophage

12 Bacteriophage: bacteriophages are highly specific. Help identify specific organisms. Plaques: Lysis of bacterial cells


13 The disks are impregnated with specific antibiotics. The streaks make up a bacterial lawn. These two strains have different antibioticresistance patterns.


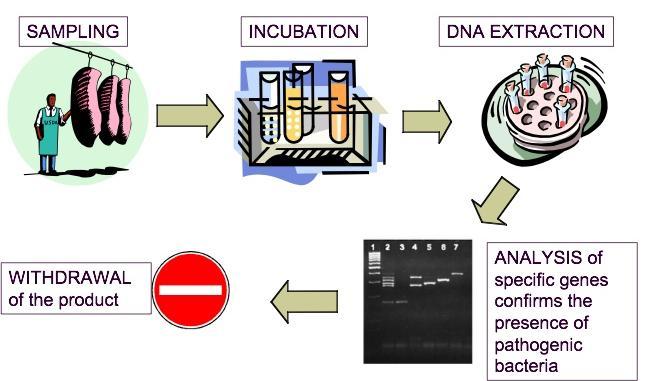
14 Enrichment (24-48 h) Selection isolation (24 h) Biochemical & Serological Confirmation (24-48 h)


15 Time consuming High cost High risk of human error Low accuracy
16 Why molecular identification? Efficient in time Rapid detection Accurate Simple and relative easy Type of Molecular Identification DNA Hybridization PCR Amplification DNA Sequencing
17 Biovar, Biotype (syn) Serovar, Serotype (syn) Typing via RFLP analysis Ribotype (RFLP of rrna) Phage Typing
18 Compares DNA sequences among organisms. Restriction enzymes: use the same restriction enzyme to cut an unknown and known species DNA. Electrophoresis: Separate fragments. The number and sizes of fragments show genetic similarity/dissimilarity Epidemiology: Help identify source of infections.


19 Genomic DNA is isolated, cut using specific restriction enzymes, run out on a gel, and then Southern Blotted with specific DNA probes. Can you tell me which lanes contain bacteria that are clonally related?
20
21 Different strains have recognition sites in different places due to genotypic differences. Note resulting differences in restriction fragment length.
22 Nucleic acid hybridization: If two organisms are similar, their DNA sequences will also be similar. Denature and renature Rate of renature depends on relatedness Southern blotting
23 RFLP generation. Gels separate DNA by size. This is a post-probe detection blot.
24 In microarrays, the amplified nucleic acids are hybridised on a chip covered with several nucleic acids. The specific pattern of hybridisation in different points on the glass surface gives information for the identification of pathogens present in the sample. The advantage of the microarray approach is the simultaneous analysis of several targets in one experiment, in which the hybridisation to specific probes confirms the identity of the amplified product and therefore enables recognition of the contaminant.


25 Clonally related strains should have same RFLP type (i.e., same band pattern). These are two strains that have been differentiated based on RFLP analysis. Why care about clonal relatedness? Is a contamination problem due to fault in your aseptic technique? Or is there just a particularly invasive bug making the rounds?
26 Percent G+C: Useful for both classification and identification. Comparision of %G+C among bacteria indicates degree of relatedness.

27

28

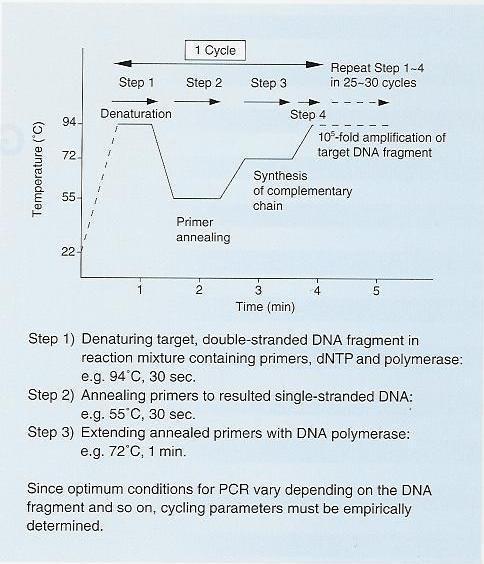
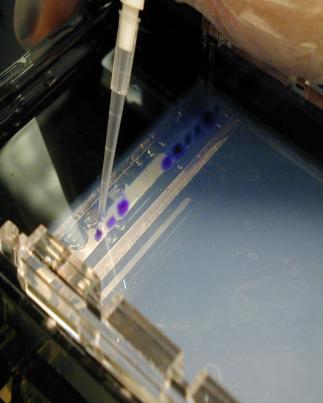
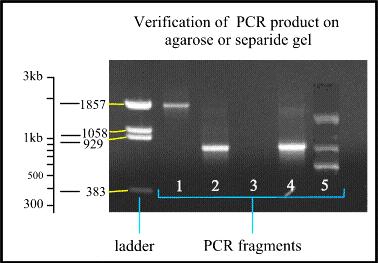
29 Starting from few target DNA molecules, we can obtain many copies of a DNA fragment, which can be made visible on gel electrophoresis as a single band.
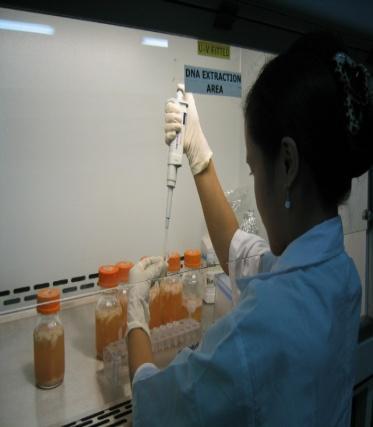
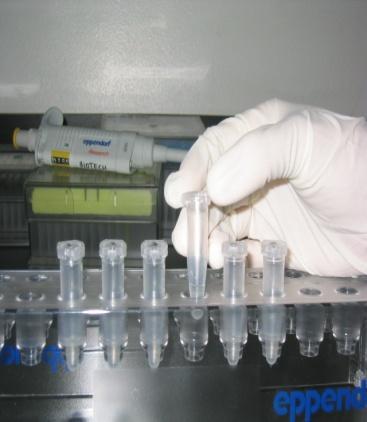
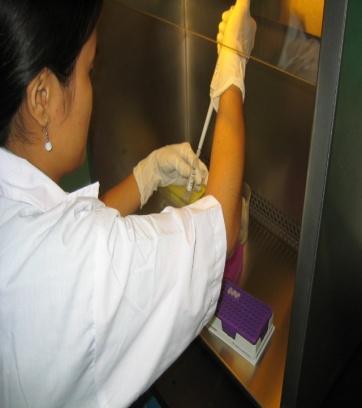

30 Enrichment (24-48 h) DNA isolation (1-2 h) Agarose electhrophoresis (2 h) PCR (2-4 h)
31
TTGTTACGACTT-3 ).")
32 16s rrna amplification using universal primer for eubacterial rrna gene : 9F (5 -AGAGTTTGATC(C/A)TGGCTCAG-3 ) and 1510R (5 GTTAC(G/C)TTGTTACGACTT-3 ). The partial 16S rrna gene sequence was compared to known bacterial sequences in the NCBI GenBank using BLAST program and submitted to Genbank.

33 DNA and amino acid sequence using BLAST program DNA sequence using sequencer machine (ABI)

34 Cladograms for bacteria are based on 16S rrna sequences, cladograms for fungi are based in 28S rrna sequences Percent similarity of 16S rrna among bacteria is calculated Organisms with similar sequences are placed on the same node A node in a cladogram represents point at which evolutionary branching occurred.
35 70% node A B C 60% 50%
36 Partial sequencing of the amplified 16s rrna of CW1 isolate revealed a 100% similarity to the 16s rrna of Bacillus licheniformis Accession number JN
37 Protein sequencing: Degree of similarity or dissimilarity in amino acid sequence of a particular protein in two organisms indicate the evolutionary relationship Technique works best for groups of bacteria that share a common protein

38 Te Ri Ma Ka Sih