Designing a Cost-effective Dose-finding Phase 2 Trial with Adaptive Design
|
|
|
- Amie Stewart
- 5 years ago
- Views:
Transcription
1 Designing a Cost-effective Dose-finding Phase 2 Trial with Adaptive Design Key Concepts of a Cost-effective Adaptive Design Incorporating evaluation of efficacy and safety (tolerability) Dose-Response Characterization for Efficacy Longitudinal Model to Predict yet to be Observed Efficacy Data Tolerability Evaluation Response-adaptive Randomization through Utility Function incorporating Efficacy and Safety/Tolerability Stopping for Futility and Success Evaluate Probability of Success for Internal Decision-Making in Early Drug Development Nangia 1
2 Looking Beyond p-values in Evaluation of Results More relevant for most studies is Pr[δ > Δ* Data] where Δ* is a difference worth having e.g. Target Product Profile (TPP) Establish success criterion by specifying a probability threshold, e.g., Pr[δ > Δ* Data] > 0.7 to be taken as good evidence of meeting TPP Pr[δ > Δ* Data] < 0.2 to be taken as enough evidence of not meeting TPP and any other result being equivocal The probability thresholds (as well as Δ*) are set by informally considering the utilities associated with the final decisions Exploit totality of data for decision-making at an interim stage or at the end of the dose response study to initiate next stage of development.
3 General Approach Build a longitudinal model to impute yet to be observed data at an interim stage for the endpoint. The longitudinal model is updated dynamically from available, accumulated data Characterize the dose response for a single primary or multiple efficacy endpoint(s) using totality of data available at an interim stage or at the end of the study Develop a multivariate dose-response (DR) model that enables the primary efficacy endpoint to borrow strength from other correlated efficacy endpoints in evaluating probability of success. Develop a model that incorporates tolerability in decision-making 3
4 Incorporating Drug Tolerability in Decision-Making Tolerability can be quantified and expressed as overall dropout rates Dropout rates commonly increase as the dose is up-titrated Approximate dropout rates based on historical data or reliable sources such as notable publications or agencies guidance As an example, assume the following overall moderate dropout scenario Dropout Scenario Pbo 6 mg 9 mg 12 mg 15 mg 18 mg Active Moderate 17% 30% 30% 30% 35% 35% 24% 4
5 Clinically Significant Minimum Utility (Efficacy and Tolerability) Define utility functions that quantitatively describe efficacy and tolerability as one 1-dimentional component utility function, separately Component utility function for efficacy e as U E (e) Component utility function for safety s as U S (s) Balance them by combining both component utility functions into one 2- dimentional bivariate function. Multiplicatively, i.e., U E, S(e,s) = U E (e) U S (s) 5

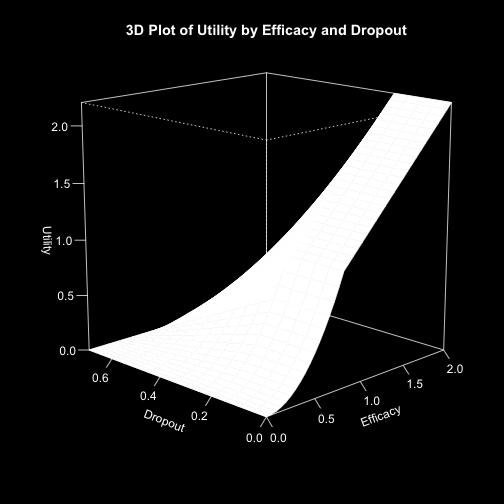

6 Combining Utilities 6
7 Stopping for Futility Sample stopping rules: Probability that d Umax would be superior to placebo in a future randomized Phase 3 trial Pr (Success in Phase 3 for d Umax ) < 0.10 Probability that d Umax would have a clinically significant difference (CSD) over placebo Pr (θ dmax - θ 0 > CSD) < 0.10 d Umax maximum effective utility dose Probability that the utility function U for the dose with the best utility value (d Umax ) is better than the clinically significant minimum utility (CSMU) Pr (U > CSMU) <
8 Stopping for Success The trial can be stopped for success if ALL success criteria are met: Sample stopping rules: Pr (Success in Phase 3 for d Umax ) > 0.85 Pr (θ dmax - θ 0 > CSD) > 0.85 Pr (U > CSMU) > 0.85 Optimizing Adaptive Design for Phase 2 Dose Finding Trials Incorporating Long-term Success and Financial Considerations JSM 2015 Copyright 2015 AbbVie 8
9 Summary Bayesian approach facilitates decision-making in early drug development using totality of data combining information across time (longitudinal model) and endpoints at an interim stage in a clinical trial. Dose-response model exploits relationship among adjacent doses and longitudinal model exploits relationship among observed responses at different time point for a dose. Incorporating correlation between the endpoints in a bivariate doseresponse model provides a more efficient and informative estimate of probability of success/futility, resulting in using more information for decision-making as well as considerable cost and time savings by stopping the trial early especially for futility. The Bayesian model for real time monitoring of probability of success/futility for decision-making at an interim stage in a longitudinal clinical trial can be implemented using R and OpenBUGS. 9