Real-Time PCR Principles and Applications
|
|
|
- Arleen Anthony
- 5 years ago
- Views:
Transcription
 Asst. Prof.")
1 Real-Time PCR Principles and Applications Dr Esam Ibraheem Azhar (BSc, MSc, Ph.D Molecular Medical Virology) Asst. Prof. Medical Laboratory Technology Department
2 Objectives Real-Time PCR Principles and Applications This Lecture will provide an understanding of the following: Limitations of traditional PCR Introduction to Real-Time PCR Methods Advantages of Real-Time chemistries over traditional PCR
3 PCR analysis From classical to real time
4 Some definitions Molecular biology : the study of gene structure and function at the molecular level. Gene : hereditary unit that is composed of a sequence of DNA and occupies a specific position or locus. The genes carry the instructions for making all the thousands of proteins that are found in a cell. DNA : is a long fiber made from two strands that stick together with a slight twist.
5 PCR analysis : refreshment G A T C The 4 bases are linked together to form a chain or single strand of DNA: G C T T A T G C A T
6 PCR analysis : refreshment Most DNA is double stranded and pair in a unique way: G C T A 3 5 C G A A T A C G T A G C T T A T G C A T 5 3
7 PCR analysis Start Start
8 Cycle 2 Cycle
9 Amplicons production vs Cycles Copie number Cycle number
10 Temperature Curve Temperature 94 C 74 C 54 C Time
11 The Polymerase Chain Reaction PCR Traditional PCR; gel-based detection Real-Time PCR; fluorescence-based detection

12 Post-PCR PCR Analysis

13 The Evolution of PCR to Real-Time PCR has completely revolutionized the detection of RNA and DNA. Traditional PCR has advanced from detection at the end-point of the reaction to detection while the reaction is occurring.


14 real-time real-time real-time PCR real-time hardware 5700 Applied Biosystems icycler BioRad 7700 Applied Biosystems LightCycler Roche FluorTracker Stratagene FluorImager Molecular Dynamics
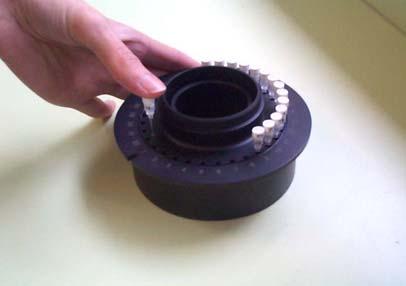
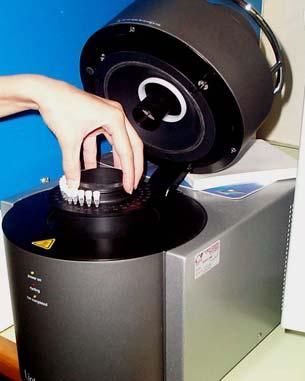
15 real-time real-time LightCycler real-time Set Up
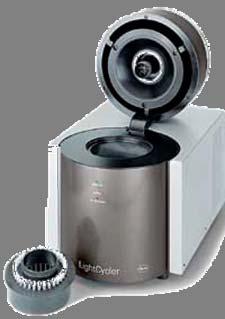
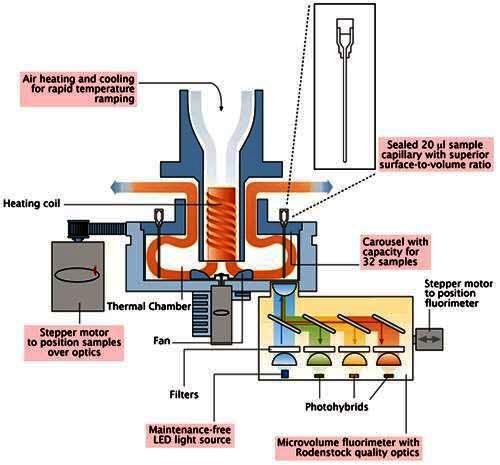
16 real-time real-time LightCycler real-time Hardware
17 Real-Time Vs Traditional PCR Real-Time chemistries allow for the detection of PCR amplification during the early phases of the reaction. Measuring the kinetics of the reaction in the early phases of PCR provides a distinct advantage over traditional PCR detection. Traditional methods use Agarose gels for detection of PCR amplification at the final phase or end-point of the PCR reaction.
18 Limitations of End-Point PCR Agarose gel results are obtained from the end point of the reaction. Endpoint detection is very time consuming. Results may not be obtained for days. Results are based on size discrimination, which may not be very precise. As seen later in the section, the end point is variable from sample to sample. While gels may not be able to resolve these variabilities in yield, real-time PCR is sensitive enough to detect these changes. Agarose Gel resolution is very poor, about 10 fold. Real-Time PCR can detect as little as a two-fold change!
19 Problems with End-Point Detection Poor Precision Low sensitivity Low resolution Non - Automated Size-based discrimination only Results are not expressed as numbers Ethidium bromide for staining is not very quantitative Post PCR processing

20 Agarose Gel Samples in the gel contain 10 copies and 50 copies, respectively. It is hard to differentiate between the 5-fold change on the Agarose gel. Real-Time PCR is able detect a two-fold change (i.e. 10 Vs. 20 copies).
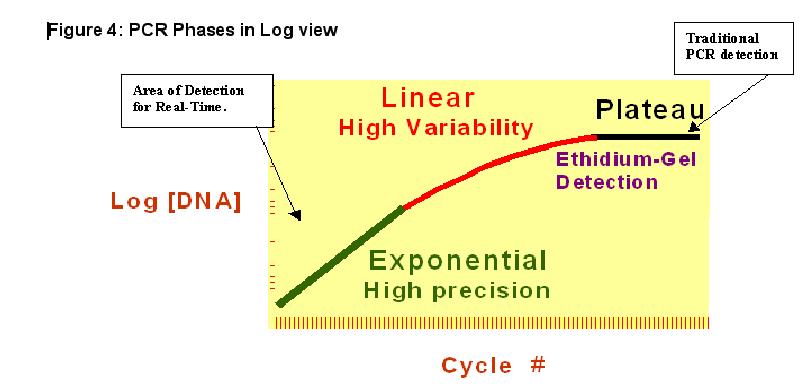
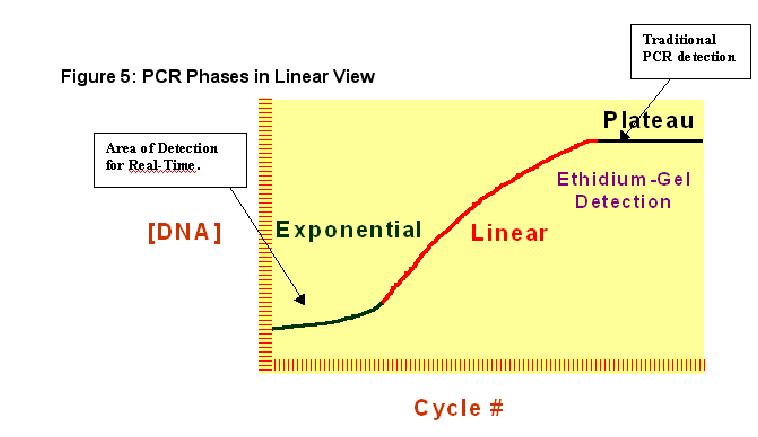
21 PCR Phases To understand why end-point PCR is limiting, it is important to understand what happens during a PCR reaction. A basic PCR run can be broken up into three phases: Exponential: Exact doubling of product is accumulating at every cycle (assuming 100% reaction efficiency). The reaction is very specific and precise. Linear (High Variability): The reaction components are being consumed, the reaction is slowing, and products are starting to degrade. Plateau (End-Point: Gel detection for traditional methods): The reaction has stopped, no more products are being made and if left long enough, the PCR products will begin to degrade.
 occurs every cycle. This type of amplification occurs in the exponential phase.")
22 PCR Phases Shows three replicates of a sample. The replicates have the same starting quantity. As the PCR reaction progresses, the samples begin to amplify in a very precise manner. Amplification occurs exponentially, that is a doubling of product (amplicon) occurs every cycle. This type of amplification occurs in the exponential phase. Exponential amplification occurs because all of the reagents are fresh and available, the kinetics of the reaction push the reaction to favor doubling of amplicon.
23 However, as the reaction progresses, some of the reagents are being consumed as a result of amplification. This depletion will occur at different rates for each replicate. The reactions start to slow down and the PCR product is no longer being doubled at each cycle. This linear amplification can be seen in the linear phase of the reaction. The three samples begin to diverge in their quantities during the linear phase. Eventually the reactions begin to slow down and stop all together or plateau. Each tube or reaction will plateau at a different point, due to the different reaction kinetics for each sample. These differences can be seen in the plateau phase. The plateau phase is where traditional PCR takes its measurement, also known as endpoint detection. Previous Figure shows that the three replicate samples, which started out at the same quantity in the beginning of the reaction, reflect different quantities at the plateau phase. Since the samples are replicates they should have identical quantities. Therefore, it will be more precise to take measurements during the exponential phase, where the replicate samples are amplifying exponentially. The amplification phases can be viewed differently to assess the PCR phases. The figures that follow show the phases of PCR in a Logarithmic scale view and a Linear scale view (Figures 4 and 5).
24
25

26 Problems with detection in the Plateau phase of PCR As stated earlier, the plateau region is the end-point of the reaction and is representative of the amount of product that you would see on garose Gels. The 96 replicates in the exponential phase are very tight in both the linear and logarithmic views.
27 Real-time PCR is The ability to monitor or visualize accumulation of PCR products using fluorescence Real-Time chemistry provides fast, precise and accurate results. Real-Time PCR is designed to collect data as the reaction is proceeding, which is more accurate for DNA and RNA quantitation and does not require laborious post PCR methods.
28 Why Real-Time PCR? To : Permit rapid target Id; <30 min Eliminate post-pcr processing Be highly specific Allow multiplexing Permit quantification
29 Real-Time PCR Definitions Growth Curve Plot of Fluorescence vs Cycle #
30 Real-time Growth Curve: fluorescence vs cycle number Log-linear Plateau Baseline
31 Real-time Requirements Real Time PCR is : the ability to monitor or visualize accumulation of PCR products using fluorescence Target sequence must be amplified in the presence of a fluorescent reporter Increase in fluorescence must be proportional to the increased amount of DNA (amplicon)
32 Reporter methods Intercalating Dyes : SYBR Green I Hybridization Probes FRET probes : LC640, LC705
33 SYBR Green The simplest and cheapest principle is based on intercalation of double-stranded DNA-binding dyes. This technology can be easily applied to already established PCR assays and does not need any additional fluorescence-labelled oligonucleotide. However, specific and nonspecific PCR products are both detected. Therefore, these assays require careful optimization of the PCR conditions and a clear differentiation between specific and nonspecific PCR products using meltingcurve analysis.
34 Intercalating Dyes Binds to all double stranded DNA, non-sequence specific Identify amplicon purity and melting temperature (T m ) by melt curve analysis Example : SYBR Green I
35 SYBR Green Dye 1) Denaturation (95 C) SYBR Green Primer 2) Hybridization (50 60 C) 3) Extension (72 C) Polymerase
36 SYBR Green I EXCITATION NO EMISSION EXCITATION DETECTED EMISSION Annealing ssdna dsdna SYBR GREEN
37 Melt Curve Analysis Following amplification, temperature is slowly increased to separate(melt) paired DNA strands, the intercalating dye is released and fluorescence decreases. Melt Curve plot of temperature vs fluorescence signal
38 Melting Temperature (T m ) Temperature at which 50% of the DNA is double stranded and 50% is single stranded What is it used for? To determine purity of amplification product To identify amplification product(s) To optimize assay annealing temperature


39 Post-PCR PCR Melt Analysis of Amplification with SYBR Green Correct product Fluorescence primer dimer Negative first derivative primer dimer 77.1 C 86.3 C
40 Quantitation Theoretically, there is a quantitative relationship between amount of starting target sample and amount of PCR product at any given cycle number. Real-Time PCR detects the accumulation of amplicon during the reaction. The data is then measured at the exponential phase of the PCR reaction. Traditional PCR methods use Agarose gels or other post PCR detection methods, which are not as precise. As mentioned earlier, the exponential phase is the optimal point for analyzing data. Real-Time PCR makes quantitation of DNA and RNA easier and more precise than past methods.

41 PCR Monitoring with Hybridization Probes The Hybridization Probe format is used for DNA detection and quantification and provides a maximal specificity for product identification. In addition to the reaction components used for conventional PCR, two specially designed, sequence specific oligonucleotides labeled with fluorescent dyes are applied for this detection method. This allows highly specific detection of the amplification product.

42 The sequences of the two oligonucleotides are selected such that they hybridize to the amplified DNA fragment in a head to tail arrangement. Why is this design important? When the oligonucleotides hybridize in this orientation, the two fluorescence dyes are positioned in close proximity to each other.
 is highly dependent on the spacing between the two dye molecules.")
43 When the two dyes are in close proximity, the emitted energy excites the LC Red 640 attached to the second hybridization probe that subsequently emits red fluorescent light at an even longer wavelength. This energy transfer, referred to as FRET (Fluorescence Resonance e Energy Transfer) is highly dependent on the spacing between the two dye molecules. Only O if the molecules are in close proximity (a distance between nucleotides) is the energy transferred at high efficiency. The increasing amount of measured fluorescence is proportional to the increasing amount of DNA generated during the ongoing PCR process. Since LC Red 640 only emits a signal when both oligonucleotides are hybridized, the fluorescence measurement is performed after the annealing step.

44 PCR Monitoring with Hybridization Probes
45 Hybridization Probes Based on complementary sequence Sequence specific Use Fluorescence Resonance Energy Transfer (FRET) technology. FRET is affected by two factors -Distance between the donor and acceptor -Spectral overlap between donor fluorescence emission and acceptor excitation
46 Fluorescence Resonance Energy Transfer Fluorescence Resonance Energy Transfer occurs when electronic excitation of a molecule is transferred to another molecule without emission of photon Close Far
47 Hybridization probes Principle: adjacent hybridisation and FRET EXCITATION NON DETECTED EMISSION EXCITATION FRET EMISSION DETECTED AMPLICON AMPLICON Annealing 1-5nt Fluorescein (donor) LC RED640/705 (acceptor) Phosphate
48 Hybridization system Option 2 : FRET probes Second fluorochrome is the Reporter Advantage : lower background Disadvantage : Use large part of the spectrum =>limited multiplex capability (two targets mean four emissions wavelengths to manage)
49 Hybridization system FRET emission probes Requirements: 2 probes one labeled with an acceptor dye and one labeled with a donor dye Both probes must hybridize to target head to tail within 1-5 bases Mechanism: Donor dye excited Energy transferred to acceptor dye which emits at longer wavelength
50 FRET Technology 1) Denaturation (95 C) Primer Fluorophore 1 Probe 1 F1 Fluorophore 2 F2 Probe 2 2) Hybridization (50 60 C) F1 F2 3) Extension (72 C) F1 F2 Polymerase

51 Real-time Growth Curve: Plot of fluorescence vs cycle number Plateau Log-linear Baseline
52 Real-Time PCR Definitions Cycle Threshold (C T ) The first cycle in which there is a significant increase in fluorescence above a specified threshold.

53 Primary Signal with Threshold Cycle threshold value Threshol d value Cycle Threshold Threshold line (fluorescent units)

54 Advantages and limitations of real-time PCR

55 Applications of realtime PCR in molecular diagnostics