Principles of Coagulation Testing. Andy Nguyen, MD 8/4/2010
|
|
|
- Lee Peters
- 5 years ago
- Views:
Transcription
1 Principles of Coagulation Testing Andy Nguyen, MD 8/4/2010
2 FSP and D-Dimer
3 FDP vs. D-DIMER Fibrin is formed as the end result of coagulation cascade activation Fibrinolysis causes cleavage of fibrinogen, fibrin, and fibrin clot, yields FSP (FDP) Only cleavage of fibrin clot (cross-linked fibrin) yields D-dimer -> D-dimer is more specific for DIC

4 FORMATION OF FIBRIN Fibrinogen Soluble Fibrin Fibrin monomer monomer XIII Cross-linked Fibrin
5 D-dimer FIBRINOLYTIC SYSTEM Activators: Tissue plasminogen activator (tpa) Urokinase plasminogen activator (upa) Inhibitors: Plasminogen activator inhibitor-1 (PAI-1) α2-antiplamin
6 Testing: FSP and D-dimer Semi-quantitative FSP Qualitative D-dimer Semi-quantitative D-dimer Quantitative D-dimer
7 SEMI-QUANTITATIVE FSP The first test developed (in the early 70 s) Latex agglutination, FSP antibodies are bound on latex beads, if sample contains FSP, agglutination can be detected
8 SEMI-QUANTITATIVE FSP Semi-quantitation: Serial dilution of sample (1: 20 through 1:640) A positive result at 1:20 corresponds to 20 μg/ml of fibrinogen equivalent units (FEU)
9 SEMI-QUANTITATIVE FSP Early generation FSP polyclonal antibodies cross-react with fibrinogen Must use serum or plasma in tubes with bovine thrombin (consumes fibrinogen) Current FSP monoclonal antibodies do not cross react with fibrinogen Can use plasma or serum False-positive result with rheumatoid factor Clinical application: DIC, hyperfibrinolysis
10 QUALITATIVE D-DIMER Monoclonal antibodies directed against D-dimer domain More specific for in-vivo fibrin clot formation Manual latex agglutination technique (as for FSP), plasma or serum sample: Cut-off value: 0.5 μg/ml FEU Semi-quantitative format: dilutions 1:2 through 1:16 Abnormal result in DIC Normal result in primary fibrinolysis False-positive result by rheumatoid factor
11 QUANTITATIVE D-DIMER Automated ELISA, immuno-turbidimetry Increased in DIC (>0.66 μg/ml) Quantitative D-dimer also has high negative predictive value for venous thromboembolism (VTE including DVT, PE): <0.4 μg/ml, VTE can be ruled out Very sensitive but not specific: high Negative Predictive Value / low Positive Predictive Value
12 Clotting Factor Assay
13 Factor VIII assay Factor VIII level is inversely proportional to PTT A standard curve (PTT vs F VIII) is first set up using commercial assayed samples Mutiple dilutations of patient s sample (using F VIII-deficient substrate) are tested for PTT. These PTT s are plotted on the standard curve to intrapolate for F VIII Each F VIII is multiplied by the dilutation factor to obtain the actual F VIII before dilution F VIII level is the mean of F VIII s from multiple dilutions
14 Factor VIII Standard Curve PTT (sec) F VIII (%)
15 Ristocetin Cofactor
16 α
17 vwf:rco Standard Curve Tan(α) vwf:rco (%)
18 vwf Multimer Analysis

19 Multimer analysis
20 Lupus Anticoagulant
21 Evaluation of lupus anticoagulant Mixing studies Mix equal parts patient and control plasma aptt will correct if prolongation due to factor deficiencies If LA present will fail to correct aptt Usually immediate acting (before incubation)
22 Dilute Russell Viper Venom Time Phospholipid Normal plasma drvvt sec Plasma with lupus anticoagulant drvvt > 43 sec
23 Evaluation of lupus anticoagulant Neutralization study: Addition of phospholipid will neutralize lupus anticoagulant Two common neutralization tests: Platelet neutralization: lysates of frozen, thawed and washed platelets Hexagonal phase phospholipid neutralization: hexagonal phospholipid with high affinity for lupus anticoagulant
24 LA Confirmatory Tests Platelet Neutralization Sta Clot-LA Prolonged aptt Shortened aptt Prolonged aptt Shortened aptt Clotting time >8 seconds shorter after addition of PL = + for LA
25 Anticardiolipid Antibodies
26 Anticardiolipin Antibodies ACA: IgG, IGM, IgA Laboratory: ACA by ELISA; high levels are associated with high risks of thrombosis
27 Anticardiolipin Antibodies (cont d) Normal range Clinically insignificant Moderate risk High risk IgG < 15 GPL > 80 IgM < 12.5 MPL > 80 IgA < 15 APL > 80
28 Factor VIII Inhibitor Assay
29 Factor VIII Inhibitor Assay Measured in Bethesda Unit (BU) 1 BU = quantity of inhibitor in patient s plasma that results in loss of 50% factor activity in normal plasma sample (1:1 mix) after incubation for 2 hours at 37 C Positive for inhibitor: > 0.5 BU High responding inhibitor: titer > 5 BU Low responding inhibitor. titer < 5 BU despite repeated exposure
30 Platelet Aggregation
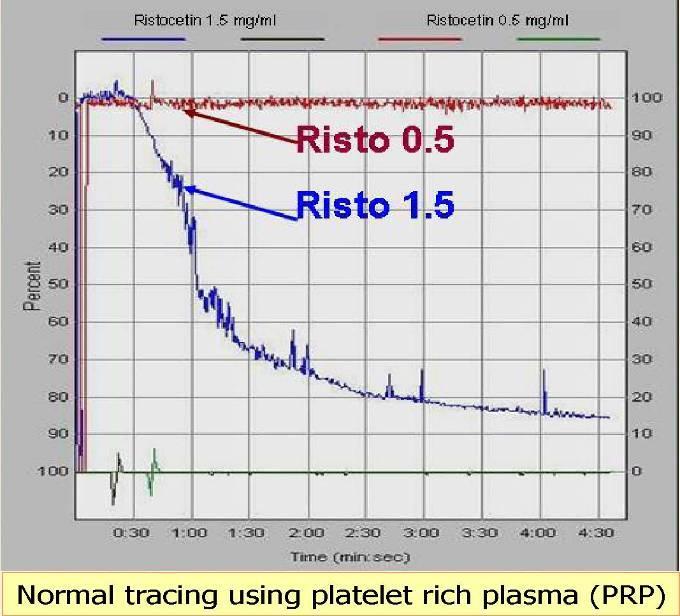
31 Platelet aggregation study Principle: aggregation in response to an added chemical stimulus can be monitored by change in transmittance Stimulating agent: arachidonic acid, ADP, collagen, epinephrine, and ristocetin Platelet functional disorders have typical aggregation patterns
32 Platelet aggregation Poor aggregation reagent added Adequate aggregation
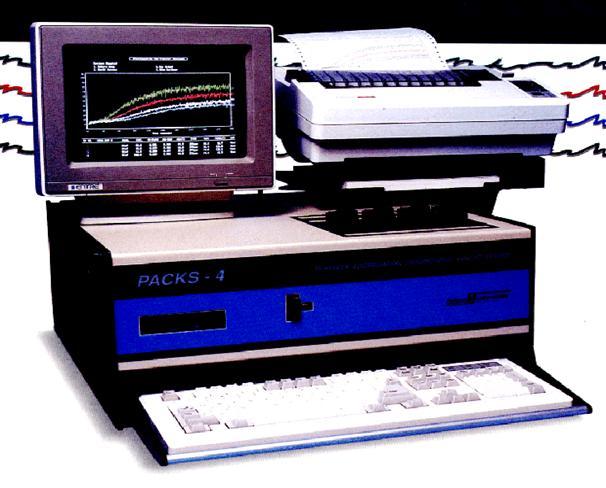
33 Aggregometer

34 Normal pattern ADP and epinephrine exhibit two waves of aggregation, primary and secondary The secondary wave is due to release of endogenous ADP

35 Abnormal platelet aggregation studies VWD and Bernard Soulier have similar aggregation pattern: Aggregation in response to ristocetin is abnormal

36 Abnormal platelet aggregation studies: Glanzmann s thrombasthenia Primary wave defect for all reagents except Ristocetin Autosomal recessive
 Secondary waves to ADP and epinephrine")
37 Abnormal platelet aggregation studies: Storage pool disease or defective release of storage pool contents (aspirin-like defect) Secondary waves to ADP and epinephrine absent
38 Heparin-associated Antibody
39 Testing for Heparin Antibody Heparin-induced platelet aggregation: sensitivity 70%, specificity 85% Serotonin release assay: sensitivity 80%, specificity 85%, limited use due to radioisotope ( 14 C) Heparin-PF4 antibody (ELISA): sensitivity 82%, specificity 70%
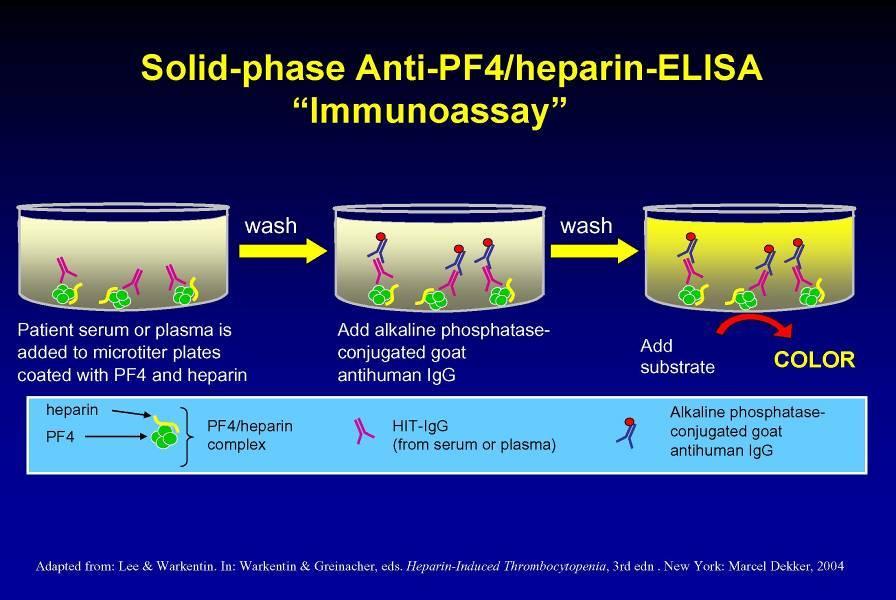
40 ELISA
41 Heparin Antibody Testing by Heparin-induced platelet aggregation Negative for HIT Heparin added Positive for HIT

42 Serotonin release assay Heparin/PF4 complex HIT IgG Radiolabeled serotonin released from platelets
43 ADAMTS-13 Testing
44 Assay Methods for ADAMTS-13 Used to assess ADAMTS-13 activity levels Substrate VWF (purified or recombinant) VWF unfolding urea or guanidine Activation BaCl 2 Detection decrease in related function ADAMTS-13 activity inhibited by EDTA Must use citrate instead
45 Collagen-Binding Assay Gerritsen, et. al. Small vwf fragments do not bind collagen; large forms do Dilutions of patient s plasma mixed with purified vwf Incubation for 2 hours ELISA Microtiter plates coated with collagen type III Collagen-bound VWF quantified using labeled antibodies: detection of (large) vwf bound to collagen by ELISA indicates poor ADAMTS-13 activity
46 Bethesda Inhibitor Assay Mixing studies Normal human plasma mixed with patient s plasma Residual activity measured via ADAMTS-13 assay One Bethesda Unit = quantity of inhibitor that neutralizes 50% of the ADAMTS-13 activity in normal plasma Increase in Bethesda units is exponential Normal is 0.3 Bethesda Units
47 When ADAMTS-13 assay is ordered here at MHH Sent to the Blood Center of Southeastern Wisconsin Reference Laboratory Gerritson method and Bethesda Inhibitor Assay Sample collected in citrate and sent frozen Assay run 2x per week Turnaround time 7-10 days
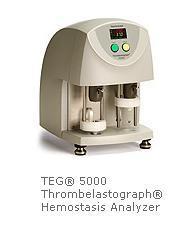
48 Thromboelastograph
49 Thromboelastograph (TEG): principles Measuring the mechanical properties of the developing clot: The time it takes until initial fibrin formation. The kinetics of the initial fibrin clot to reach maximum strength. The ultimate strength and stability of the fibrin clot, ie. its ability to mechanically impede hemorrhage without permitting inappropriate thrombosis.
50
51 The TEG analyzer has a sample cup that oscillates back and forth constantly at a set speed through an arc of 4 45'. Each rotation lasts ten seconds. A whole blood sample of 360 ul is placed into the cup, and a stationary pin attached to a torsion wire is immersed into the blood. When the first fibrin forms, it begins to bind the cup and pin, causing the pin to oscillate in phase with the clot. The acceleration of the movement of the pin is a function of the kinetics of clot development.
52
53 The torque of the rotating cup is transmitted to the immersed pin only after fibrin-platelet bonding has linked the cup and pin together. The strength of these fibrinplatelet bonds moves the pin directly in phase with the cup motion. Thus, the magnitude of the output is directly related to the strength of the formed clot. As the clot retracts or lyses, these bonds are broken and the transfer of cup motion is diminished. The rotation movement of the pin is converted by a mechanicalelectrical transducer to an electrical signal which can be monitored by a computer.
54 The resulting hemostasis profile is a measure of: -The time it takes for the first fibrin strand to be formed, -The kinetics of clot formation, -The strength of the clot (in shear elasticity units of dyn/cm2), and -Dissolution of clot.

55 Parameters of clot dynamics α MA
56 Parameters of clot dynamics Clotting time Clot kinetics Clot strength Hemostasis profile Clot stability R K alpha MA,G CI LY30 The period of time of latency from the time that the blood was placed in the TEG analyzer until the initial fibrin formation (MA= 2 mm). A measure of the speed to reach a specific level of clot strength (MA= 20 mm). Measures the rapidity of fibrin build-up and cross-linking (clot strengthening) A direct function of the maximum dynamic properties of fibrin and platelet bonding via GPIIb/IIIa and represents the ultimate strength of the fibrin clot. Coagulation Index, which is a linear combination of the above parameters. Measures the rate of amplitude reduction 30 minutes after MA.
57 Patterns of TEG Tracings α MA

58 Patterns of TEG Tracings α Thromboelastograph
59 Factor V Leiden
60 Testing for Factor V Leiden Clot-based testing (blue top tube) Polymerase chain reaction (PCR) testing (purple top tube)
61 Clot-based Testing Determines the resistance to APC, using plateletpoor plasma Principle of test: in patient with APC resistance, Factor V is not inactivated by APC, hence (PTT with APC) is not prolonged. This will shorten the APC Ratio (APCR)
62 Clot-based Testing (cont d) APCR = (PTT with APC)/(PTT without APC) APCR > 2 -> negative for APC resistance APCR < 2 -> positive for APC resistance Considerable overlap between FV Leiden heterozygous and normal Note: cut-off value is dependent on particular test kits
63 Clot-based Testing (cont d) Inaccurate result with: intrinsic factor deficiency, lupus anticoagulant, anticoagulant (need to get pre-treatment sample) New generation test (COATEST by Chromogenix) 1. Predilution of patient sample with FV deficient plasma before testing: alleviates coumadin interference 2. Polybrene: alleviates heparin intereference
64 PCR Testing Amplifies the mutated gene fragment. Results: negative, heterozygous, homozygous. Results not effected by factor deficiency, lupus anticoagulant, anticoagulant PCR testing cannot detect APC resistance that is not due to FV Leiden
65 PCR Testing (cont d) Genomic DNA from lymphocytes DNA sequence flanking the mutation site is amplified by PCR, resultant product is analyzed by restriction enzyme digestion Normal (wild type): two normal FV alleles Heterozygous: one abnormal allelle Homozygous: two abnormal allelles
66 New PCR Testing: LightCycler (Roche) Melting curve analysis method Real time analysis 35 thermal cycles in 25 min, followed by melting curve analysis in 5 min -> results in 30 min Batch of 32 samples Designed for clinical lab setting Optional module for automated DNA extraction (60 min for 32 sample extraction)

67 MagNA Pure LC and LightCycler

68 Magnetic Bead Technology for DNA Extraction
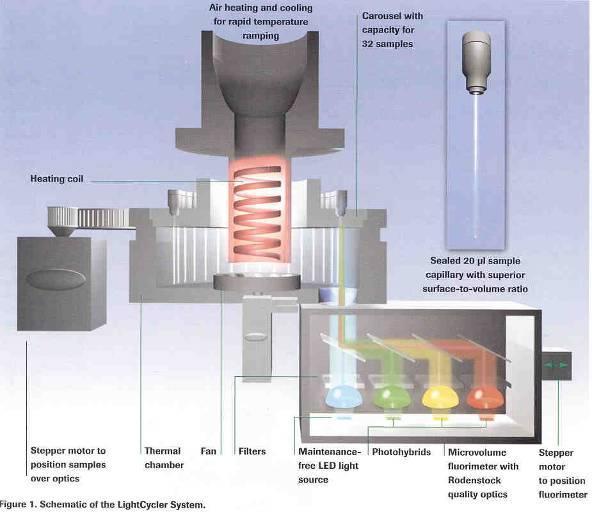
69 LightCycler Schematics
70 FV Leiden Mutation: Hybridization Probe with Fluoresence Resonance Energy Transfer (FRET)

71 FV Leiden Mutation: Melting Curve Analysis