used at a final concentration of 5 ng/ml. Rabbit anti-bim and mouse anti-mkp2 antibodies were
|
|
|
- Miles Ross Arnold
- 5 years ago
- Views:
Transcription
1 1 Supplemental Methods Reagents and chemicals: TGFβ was a generous gift from Genzyme Inc. (Cambridge, MA) and was used at a final concentration of 5 ng/ml. Rabbit anti-bim and mouse anti-mkp2 antibodies were purchased from BD Pharmingen (San Diego, CA). Mouse anti-p-erk (E4), rabbit anti-erk2 (C-14), rabbit anti-hsp90 (H-114) were purchased from Santa-Cruz Biotechnology (Santa Cruz, CA). Rabbit anti-cleaved caspase 3 (Asp175, 5A1), anti-phospho Smad2 (Ser465/467) and anti-phospho Smad3 (Ser423/425) were purchased from Cell Signaling (Danvers, MA). Secondary antibodies were purchased from the following vendors: anti-mouse IgG-HRP from Accurate Antibodies (San Diego, CA) and anti-rabbit-igg-hrp from Bio-Rad (Hercules, CA). Cycloheximide and Actinomycin D were purchased from SIGMA. Murine recombinant IL-3 and IL-7 were purchased from BioSource International (Camarillo, CA). Protease inhibitor mixture tablets and the Cell Death Detection ELISA Plus kit were purchased from Roche Diagnostics (Indianapolis, IN). Lipofectamine transfection reagents and the Superscript III RT kit were obtained from Invitrogen. prl-tk-renilla luciferase and the Dual-Luciferase Reporter Assay system were purchased from Promega (Madison, WI). Opti-MEM cell culture medium, Antibiotic/Antimycotic and Fetal Bovine Serum were purchased from Invitrogen (Carlsbad, CA). All primers were obtained from IDT technologies (Coralville, IA ). All other reagent chemicals were purchased from Sigma. Total RNA Isolation, RT-PCR and PCR: Total RNA was isolated using RNeasy Kit (Qiagen) according to the manufacturer s protocol. Reverse transcription and PCR was performed as follows: 5 µg of RNA was reverse transcribed according to the protocol described by the manufacturer. cdna (200 ng) was used for further amplification of target genes by PCR using 2U of Hot Start Taq polymerase, 10 pmol each of sense and antisense primers and 200 µm dntp. The primers used in this study are as follows: DUSP1 sense: 5 - tacacttccctgtttccatccc 3 ; DUSP1 antisense: 5 -
2 2 cctttctcttctgccctgttttg 3 ; DUSP4 sense: 5 - gcctacctgatgatgaagaagcg -3 ; DUSP4 antisense: 5 - caaggagaaatggagacggagc -3 ; Smad3 sense: 5 - tactacgagctgaaccagcg -3 ; Smad3 antisense: 5 - aagatcttcaggttgcagcc -3 ; Bim sense: 5 - tctgagtgtgacagagaaggtggac -3 ; Bim antisense: 5 - cagctcggtgtgcaatccgtatc -3 ; β-actin sense: 5 - ccaaggccaaccgcgagaagatgac -3 ; and β-actin antisense: 5 - agggtacatggtggtgccgccgccagac -3. To confirm the genotype of the MKP2KO pro-b cells, the primers used were sense: 5 - gcatccccgtcgaagacaacc -3 and antisense: 5 - gtaggccaggcagatggtggc -3. For cloning of the DUSP4 gene, primers used for amplification of full-length gene were sense: 5 - cgggatccatggtgacgatggagga -3 ; anti-sense: 5 - cgggtcgacctaacagctgggggag 3. The amplified gene product was directionally cloned into the EcoRI and HindIII sites of ptag2b vector. Generation of AML-3DN cells: The plasmid encoding Smad3DN, wherein the last 4 amino acids (SSVS) bearing the phosphorylation sites have been deleted, has been previously described (Patil et al, 2000). AML-3DN cells were generated by retroviral transfection of AML-12 WT cells with the Smad3DN plasmid and selecting for puromycin resistance. Smad3DN expression was verified by immunoblotting the lysates with α-flag (Patil et al, 2000). Transient Transfection of COS-7 and AML-12 cells and Luciferase assays: Transient transfection to analyze the expression of recombinant constructs was accomplished with Lipofectamine PLUS using the manufacturer s protocol. For reporter assays, Lipofectamine 2000 was used for transient transfection. Briefly, AML-12 cells were seeded at a density of 8 x 10 4 cells/well in 24 well plates and grown overnight. Each well was transfected with 1 µg of MKP2-luc or SBE-luc along with 10 ng of TK-Renilla control. After transfection, cells were treated with TGFβ for indicated times. Cells were washed with ice-cold PBS and Luciferase assays were carried out using the Dual Luciferase Reporter Assay system according to the manufacturer s protocol. The luciferase acitvity was deteremined using
3 3 Luminometer. Shown is the mean +/- SD of three independent experiments performed in duplicate (n=3). Cell Death Detection: Cell death after TGF-β treatment was detected by ELISA using the Cell Death Detection Kit according to the manufacturers protocol. Primary pro B-lymphocytes or AML-12 cells were seeded at a density of ~ 10 5 cells/well in a 24 well plate. The next day they were either stimulated with TGFβ or transfected with MKP-2. Cell pellets were collected at indicated time intervals and viable cells were counted. The pellets were solubilized in 200 µl of lysis buffer provided in the kit for 30 min and centrifuged at 200 x g for 10 min to separate the cytosolic fraction. Soluble lysate (20 µl) was incubated in streptavidin coated wells to capture the cytosolically released nucleosomal-dna components of the nucleosomes. The bound DNA components were detected photometrically at 405 nm as described by the manufacturer. The raw values obtained were corrected for total cell count in each of the sample and normalized to the respective negative control (-TGFβ). The negative control (- TGFβ) was set as 1 and the graph was plotted as fold change in apoptosis above control. Shown is the mean +/- SD of three independent experiments performed in duplicate (n=3). Supplemental Figure Legends Fig S1. Gene array results for TGFβ-treated AML-12 hepatocytes. Microarray analysis was performed using the Illumina Mouse-6 BeadChip platform. Total RNA was prepared from control and TGFβ-treated (30 min and 1h) AML-12 hepatocytes in two separate experiments. crna synthesis, hybridization and washing were performed using Illumina reagents and followed the manufacturer s directions. The data output from the Illumina BeadChip scanner was normalized using the rank invariant method and analyzed using BeadStudio software. The original data are available from the
4 4 ArrayExpress database ( and the accession number is (E-TABM- 503). All of the DUSPs represented in the array are listed numerically on the far left, with their common names listed in the next column to the right. The normalized values for control and corresponding 1 h TGFβ-treated samples are shown. (nd = not detectable). Fig S2. Genotype analyses of Smad3- (A&C) and MKP2-deficient (B) pro-b lymphocytes. (A) Top panel; genotype of Smad3 wild-type (+/+) and Smad3 knock-out (-/-) pro-b lymphocytes. Middle panel; RT-PCR was used to analyze Smad3 expression in wild-type (+/+) and Smad3-knockout (-/-) B- cells, as well as in wild-type AML-12 hepatocytes. The 320 bp product was generated using an annealing temperature of 59 o C and 28 cycles of amplification. The DNA ladder used to estimate the size of the product is shown on the left. Bottom panel, same as the middle panel except that β-actin expression was analyzed using an annealing temperature of 66 0 C and 21 cycles of PCR. The product is 587 bp. (B) Top panel; genotype analysis of MKP2 wild-type (+/+) and knock-out (-/-) pro-b lymphocytes. 200 ng of genomic DNA was amplified with AccuPrime Taq (InVitrogen) using an annealing temperature of 72 0 C for 32 cycles to generate a 1.4 kb product. The DNA ladder used to estimate the size of the product is shown on the left. Bottom panel, same as the top panel except that the genotype of elongation factor 1α (EF1α) was examined. Primers were obtained from Active Motif (Carlsbad, CA) and used to generate a 233 bp product after 35 cycles using an annealing temperature of 55 0 C. (C) AML-12, Ba/F3 pre-b lymphocytes, WT and Smad3KO pro-b-lymphocytes were stimulated with TGFβ for 4 h and WCL were prepared for immunoblotting with α-phospho-smad3 antibody. To detect phospho-smad3 proteins, 200 µg of WCL from WT, Smad3KO and Ba/F3 lymphocytes, and 100 µg of WCL from AML-12 was loaded per lane; 50 µg of Flag-tagged-Smad3 overexpressing Cos7 WCL was loaded as a reference for Smad3.
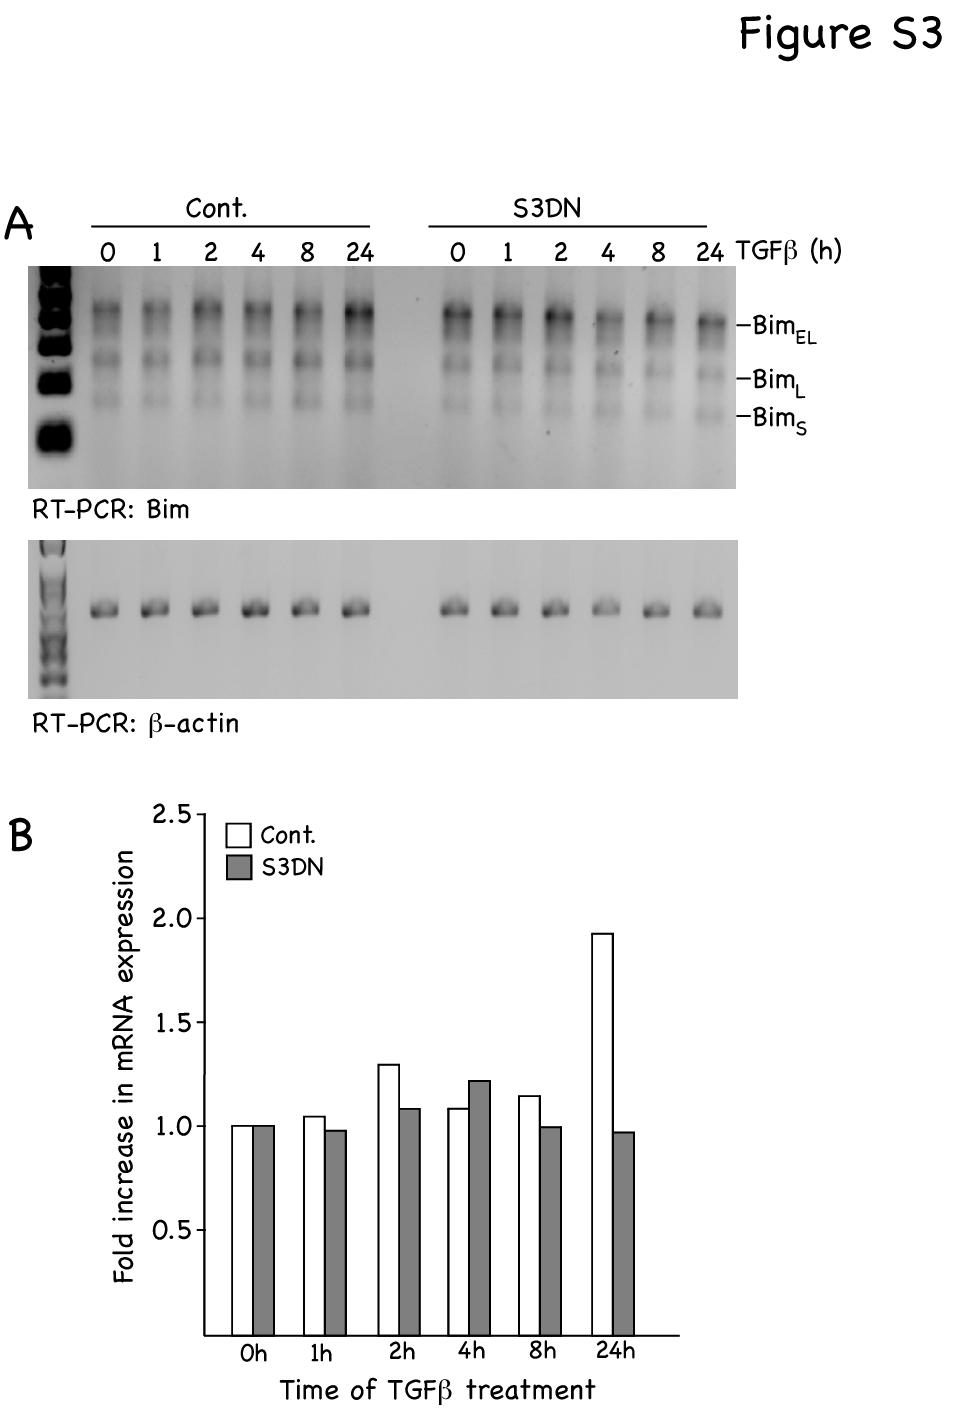
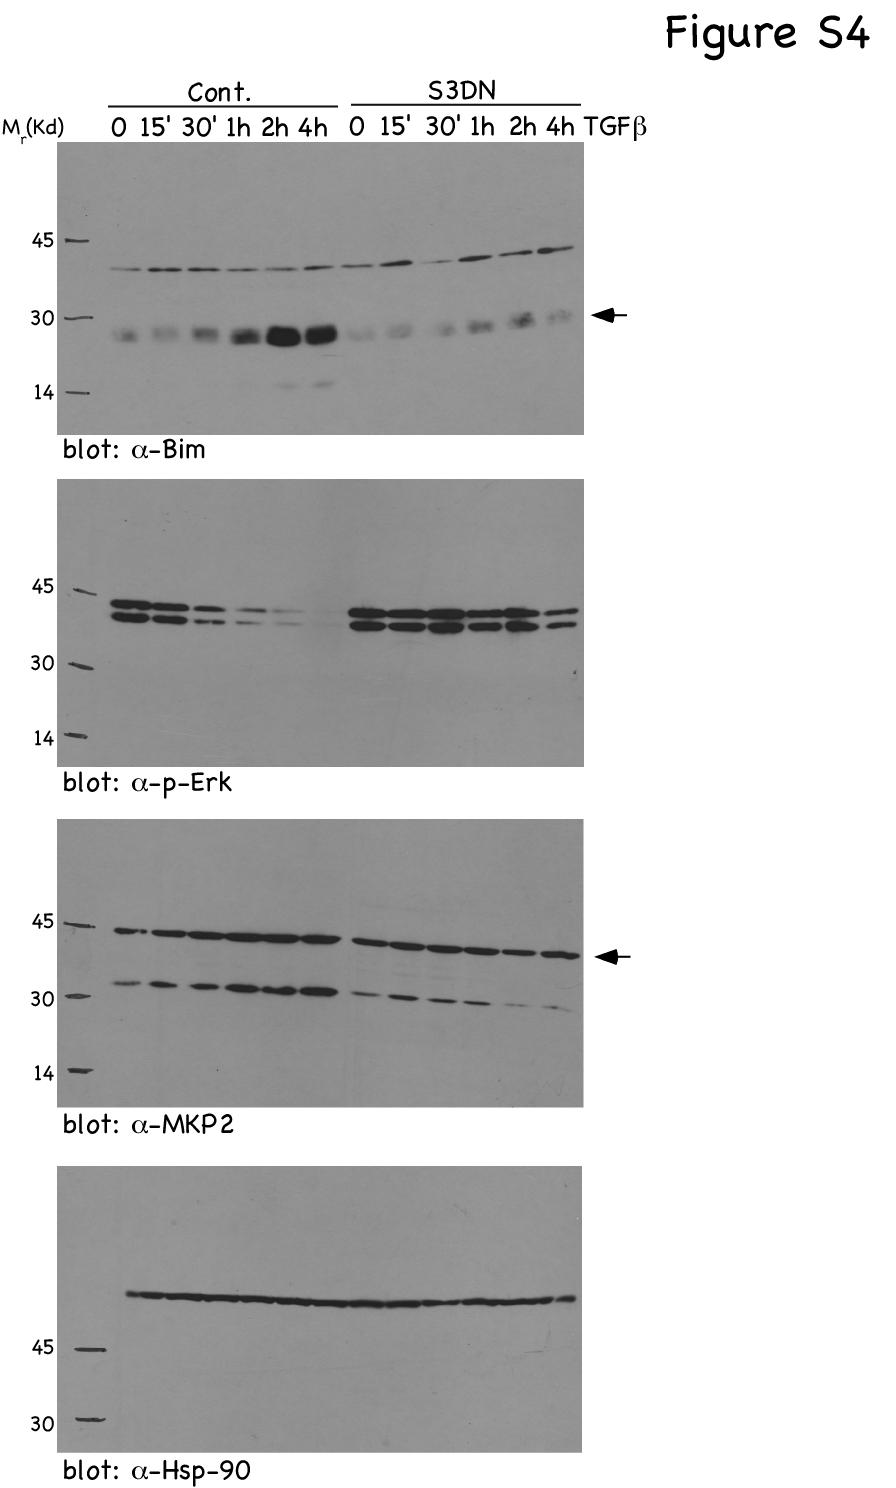
5 5 Fig S3. TGFβ mediated effects on Bim transcription in AML-12WT and AML-3DN cells. Control AML-12 (vector alone transfected) and AML-12 cells stably expressing a dominant-negative form of Smad3 (S3DN) were treated with TGFβ for the indicated times. (A) RNA was analyzed by RT-PCR with primers specific for Bim and β-actin (loading control). The three amplified isoforms, BimEL, BimL and BimS, have been shown. (B) The bands corresponding to Bim and actin were quantified using ImageQuant software and the values obtained were normalized and plotted as fold increase in expression. Fig S4. Immunoblots. Sample immunoblots for Bim, p-erk, MKP2, and Hsp-90 depicted relative migration of these proteins relative to known molecular weight markers. Fig S5 and S6. Graphical representation of changes in protein and mrna expression upon TGFβ stimulation. Immunoblotted gels or RNA (RT-PCR) gels used in this study were scanned and quantitated using ImageQuant software. In all, the values obtained for the protein of interest was normalized with the corresponding loading control, Hsp90 or total Erk, and the normalized values were expressed as fold change over control untreated cells (-TGFβ). The data shown in the graphs represent mean +/- SD of three independent experiments. Supplemental Reference Patil S, Wildey GM, Brown TL, Choy L, Derynck R, Howe, PH (2000) Smad7 is induced by CD40 and protects WEHI-231 B-lymphocytes from TGFβ-induced growth inhibition and apoptosis. J Biol Chem 275:
6
7
8
9
10
11