The 2012 PRG study: Assessing longitudinal variability in routine peptide LC-MS/MS analysis
|
|
|
- Nancy Hampton
- 5 years ago
- Views:
Transcription
1 The 2012 PRG study: Assessing longitudinal variability in routine peptide LC-MS/MS analysis
 - North Carolina Central University Tracy M Andacht - Centers for Disease Control and Prevention Keiryn Bennett - Center for Molecular Medicine of the Austrian Academy of Sciences Cory")
 - Proteomics Core UC Davis Genome Center To Our Participants!")
2 Thanks! 2012 PRG Maureen K. Bunger (Chair) - North Carolina Central University Tracy M Andacht - Centers for Disease Control and Prevention Keiryn Bennett - Center for Molecular Medicine of the Austrian Academy of Sciences Cory Bystrom - Quest Diagnostics Larry Dangott - Texas A&M University John Leszyk - University of Massachusetts Medical School Henrik Molina - The Rockefeller University Robert L Moritz - Institute for Systems biology Brett S Phinney (EB liaison) - Proteomics Core UC Davis Genome Center To Our Participants! RG LC-MS/MS Dr Rich Eigenheer -UC Davis Genome Center Christian Knoll -CeMM, Companies that contributed PRG adhoc members and other supporters J. Will Thompson Duke University Matthew Chambers- Vanderbilt University David Tabb Vanderbilt University Paul Rudnick National Institutes of Standards and Technologies
3 Key Goals Measure intra-laboratory variation in LC-MS performance over time Survey types of QC procedures implemented in proteomics facilities Survey elements of system design/setup that correlate with variability Educate and Inform
4 Study Design Principles Provide labs with purified, digested, aliquotted protein mixture Expect one run per month for 9 months Expect fresh aliquot to be used each time Expect user to implement same settings for each run, but settings they determine based on their typical setup/comfort User only needs to upload raw data
5 Other study designs that were considered Providing labs with both complex (biological organism) and simple protein mixtures Too time consuming and expensive labs may not want a compelx biological on system sample availability limited Requiring targeted MS1 level approach (e.g. monitoring 5-10 peptides) May be out of comfort zone for many Uncertain how results would translate to a more standard DDA identification analysis
6 Bovine 6 protein mix (Michrom) Tryptic digest of the following Proteins: glutamate dehydrogenase 1, mitochondrial precursor serum albumin precursor beta-lactoglobulin precursor carbonic anhydrase 2 lactoperoxidase precursor alpha-s1-casein precursor 1 pmol (total material) equimolar mix provided in each aliquot (approx 166 fmol of each protein)
7 Timeline Data collection Data processing J F M A M J J A S O N D 2012 J F M 2013
8 Data pipeline Participant Bioproximity Proteome Cluster Vanderbilt University PRG
9 QuaMeter Metrics MS2.4C Fraction of total MS2 scans ID'd in the third quartile of peptides sorted by MS1 max intensity MS2.4A Fraction of total MS2 scans ID'd in the first quartile of peptides sorted by MS1 max intensity MS2.4D Fraction of total MS2 scans ID'd in the fourth quartile of peptides sorted by MS1 max intensity MS2.4B Fraction of total MS2 scans ID'd in the second quartile of peptides sorted by MS1 max intensity C.1A Fraction of all peptides ID'd at least 4 minutes earlier than max MS1 for ID C.1B Fraction of all peptides ID'd at least 4 minutes later than max MS1 for ID IS.3A Number of 1+ peptides over 2+ IS.3C Number of 4+ peptides over 2+ IS.3B Number of 3+ peptides over 2+ MS2.1 MS2 ion injection time in ms (multiplied by 0.01) MS1.1 MS1 ion injection time in ms IS.1B Number of times where MS1 signal greatly increased between adjacent scans more than 10 fold IS.1A Number of times where MS1 signal greatly decreased between adjacent scans more than 10 fold MS1.2A Median signal to noise value (ratio of maximum to median peak height) for MS1 spectra MS1.2B Median TIC value for ID'd peptides up to and including C.2A (time period) MS1.3A Ratio of 95th over 5th percentile MS1 maximum intensity values for ID'd peptides MS1.3B Median maximum MS1 value for ID'd peptides DS.3A Ratio of MS1 maximum to MS1 value at sampling for median decile of peptides by MS1 maximum intensity DS.3B Ratio of MS1 maximum to MS1 value at sampling for bottom 50% of peptides by MS1 maximum intensity DS.2B Number of MS2 scans taken of C.2A (times 0.001) C.2B Ratio of peptides per minute ID'd during C.2A DS.2A Number of MS1 scans taken over C.2A (times 0.01) C.2A Time period over which 50% of peptides were ID'd (times 0.1) C.3B Measure of the distribution of the peak widths C.3A Median peak widths for all ID'd unique peptide(s) P.3 Ratio of semi/fully tryptic peptide IDs (times 100) IS.2 Median m/z for all ID'd peptides(unique ions) times DS.1A Ratio of peptides ID'd by one spectrum to number ID'd by two spectra DS.1B Ratio of peptides ID'd by two spectra to number ID'd by three spectra P.2C Number of unique tryptic peptide sequences ID'd P.2B Number of tryptic petide ions ID'd; ions differeing by charge state and/or modification are counted separately P.2A Spectral count * Taken from Rudnick P.A., et al Molecular and Cellular Proteomics. p.225
10 Metrics part II: The Survey Variables Maintenance Chromatography Mass Spectrometry Sample Calibration Tuning Preventative Maintenance Column change Gradient Flow rate Column Specifics Mobile Phases DDA settings Exclusion list settings Load amount Dissolution solution
11 Testing Data example: IQ RT period for IDs 30 C2a IQ RT period for ID s 30 C2a IQ RT period for ID s RG participant 1 Velos-Orbitrap RG participant 2 LTQ
12 Testing Data Example: Median Peak widths C-3a Median peak widths C-3a Median peak widths M343-F01-BT-P M343-F01-BT-P3... M343-F02-BT-P3... M358-E05-BT-... M358-E06-BT-P3... M358-E09-BT-P3... M358-F01-BT-... M358-F RG participant 1 Velos-Orbitrap RG participant 2 LTQ
13 Contaminants lactotransferrin precursor [Bos taurus] alpha-s2-casein precursor [Bos taurus] superoxide dismutase [Cu-Zn] [Bos taurus] cationic trypsin precursor [Bos taurus]
14 Number of Participants Started with approximately 100 requests Scared about 30 people away by sending out an that required a response before we would send out the samples. Approximately 70 remaining
")
15 Percent Participant Demographics Other (Austrailia, Turkey, Singapore, Israel, South Africa, India) Europe North America

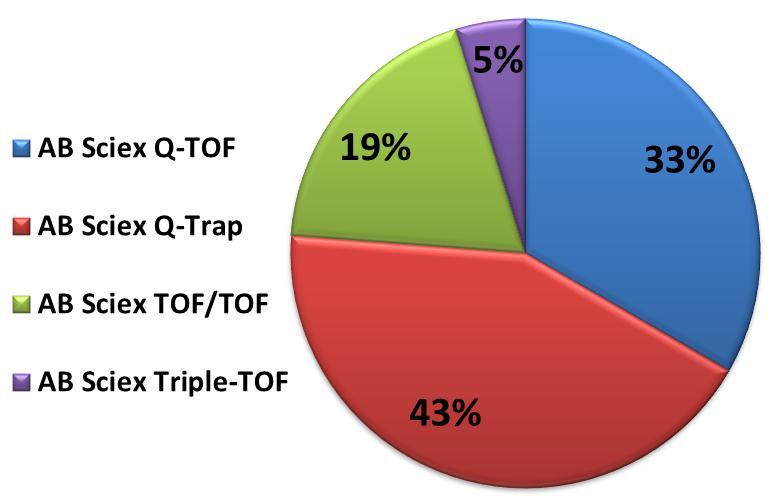
16 Instrument diversity

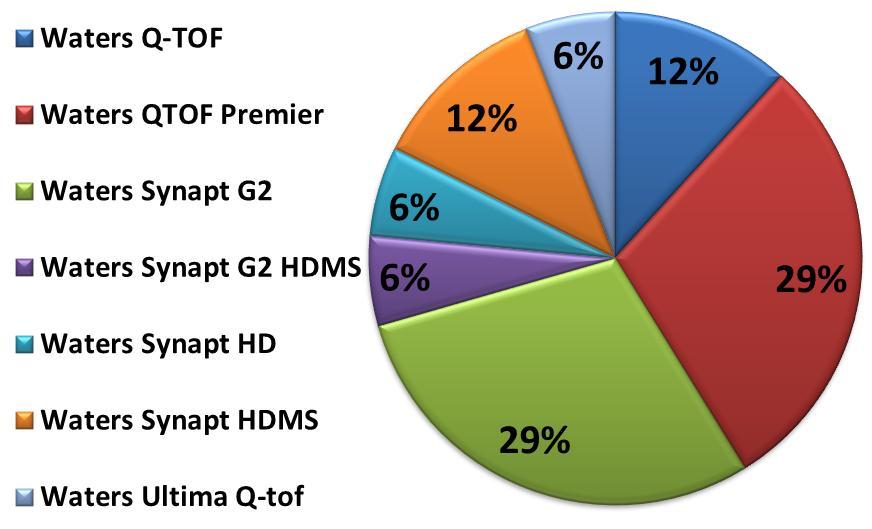
17 Instrument Diversity part II

18 Initial upload info: 42 Survey entries 75% of participants have more than 5 years experience
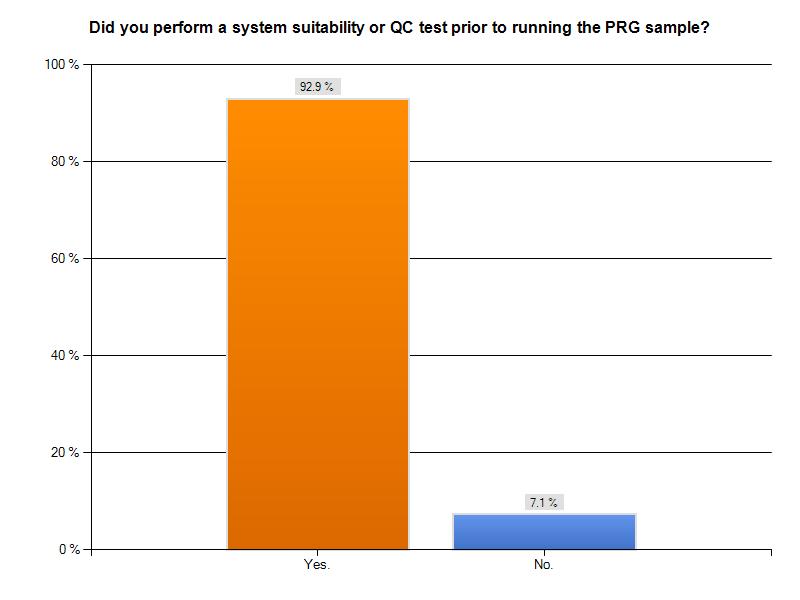

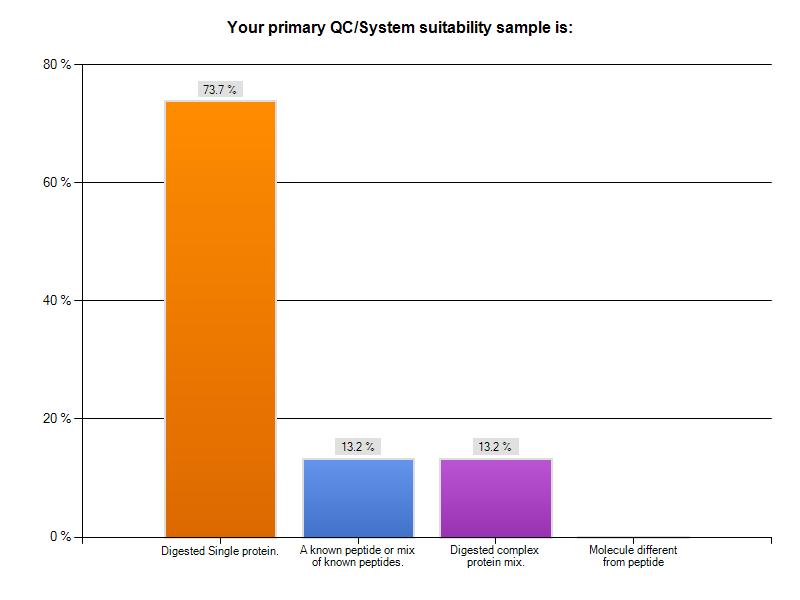
19 QC variability among participants
20 Other Variables Flow rate: range 100nL/min 2uL/Min (one reported 150uL/min) Amount injected: range 40fmol 1pmol Resolving gradient: range 11 min 100 min
 Goals for next")
21 Collect Data Harass participants Decide what Metrics vary most across labs Try to determine what metrics correlate with each other Correlate survey data with variability data Try to figure out a long term solution to make sure the raw data is available for future studies or different tools (1-2TB) Goals for next year: