Understanding PCR. Total allelic product Peak height Back stutter Forward stutter Variability in peak height
|
|
|
- Eugene Clark
- 5 years ago
- Views:
Transcription
1 Understanding PCR Total allelic product Peak height Back stutter Forward stutter Variability in peak height 1
2 Total allelic product (TAP) Total allelic product, T a = height of allele plus height of stutter peaks T a =O a-1 +O a +O a+1 Back stutter Allele a a-1 a+1 Forward stutter 2
3 Effects on TAP Template Degradation Locus specific effects Additivity 3
4 average peak height (rfu) amount of DNA added to PCR (pg)
5 5 Profile slopes/degradation
6 Theory Consider that the degradation of the DNA strand was random with respect to location. Consider a fragment of length l. If the probability of a break is p, at any of the locations 1 l the chance of the full fragment being amplified is (1-p) l. Since 1-p is less than 1 this equation describes an exponential decline in peak height. 6
7 Bacteria, UV, others Positive probability Negative Positive Fragment length 7
8 log(o a /E a ) m a
9 Linear Exponential log(o a /E a ) m a
10 4. Locus specific amplification
11 4. Locus specific amplification Observation that some loci amplify more efficiently than others This effect varies with time Results in varying peak heights off the general trend Locus offset at each locus allows for this variation 11

12 Locus specific amplification example 12
13 Assumption of additivity For many years we have assumed that the contribution from various sources adds Often termed stacking in the US, Allele + allele, allele + stutter Logical, based on the fact that the enzymes don t know the origin of the template 13
14 Recent questioning of additivity Keith Inman, Norah Rudin, Kirk Lohmueller California State University East Bay Presented at California Association of Criminalists Meeting if the relative contributions are not additive, then that calculation is not supportable. 14 To determine if this practice is scientifically supportable, it would be useful to query a large data set of mixtures created from known profiles, designed specifically to answer this question.
15 log(o/e) Expected heights developed by fitting a model of template and degradation 0.5 Perfect would be all points on Variance higher at low peak height 0.3 (see x axis) Expected height of peak 15 log O E l a l a vs l E a allele
16 Expected heights developed by fitting a model of template and degradation log(o/e) log(o/e) log(o/e) Expected height of peak allele is minor allele non minor Expected height of peak Expected height of peak allele composite stutter log O E l a l a vs l E a 16

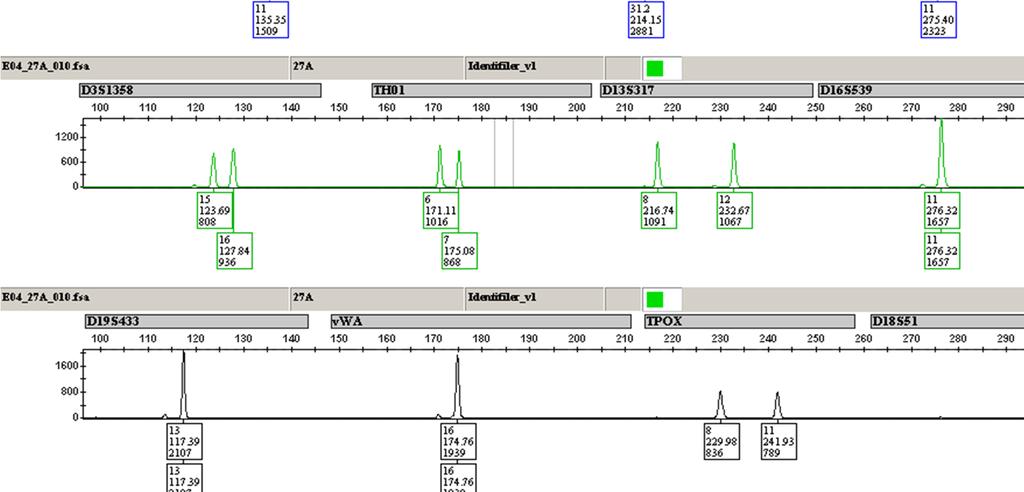
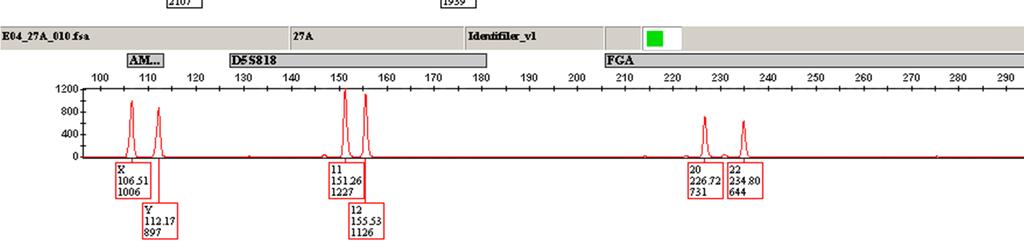
17 Stutter By-product of PCR process Generally one repeat unit smaller than target allele An epg of a heterozygote D19S433 13,15.2 displaying stutter peaks one repeat unit less than the parent alleles
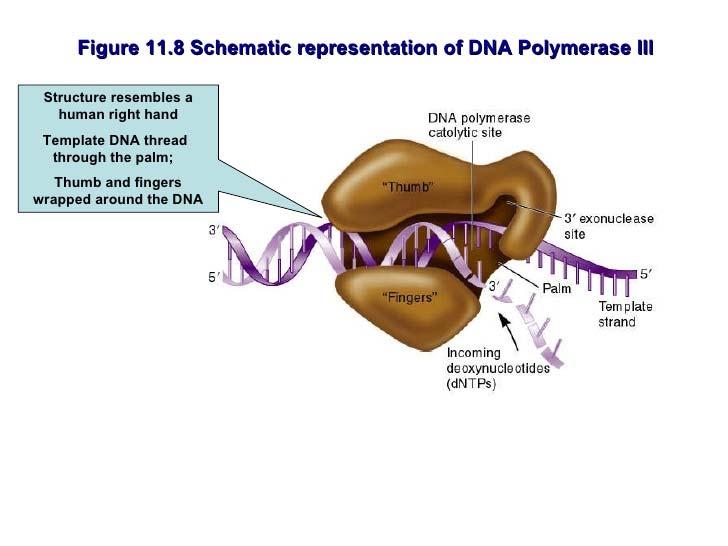
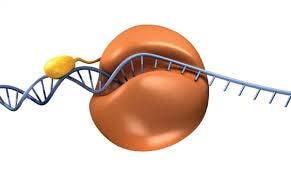
18 Stutter mechanism A proposed mechanism is slipped strand mispairing (SSM). During PCR the DNA polymerase enzyme stalls, dissociates from the DNA, the template strand loops out, and the new strand is one repeat unit shorter than the template strand
19 Stutter rates Degree of stutter formation is related to the type of repeat STRs with di- and trinucleotide repeat structures are known to stutter more than tetra- and pentanucleotide repeats Most forensic markers are tetranucleotide repeats Primer Flanking region STR AATG AATG AATG AATG AATG AATG Flanking region Primer
20 Summary (& additional forms of stutter) Type of stutter Possible mechanism Back stutter (minus one full repeat) Forward stutter (plus one full repeat) Double back stutter (minus 2 full repeats) Minus 2 base pair Slipped strand mis pairing (SSM) A loop of one repeat units forms in the nascent strand, resulting in insertion of one repeat A loop of two repeat units forms in template strand resulting in deletion of two repeats (some new evidence suggesting this might be two single stutters) SSM but of 2 b repeat within the allele (observed as well as 4 base pair repeat)
21 Nascent strand Template strand Or breathing 21
22 Stutter ratios Back stutter is typically quantified as a stutter ratio (SR): SR O O a 1 where O a-1 refers to the observed height of the stutter peak, and O a the parent peak a
23 Stutter ratios Forward stutter is typically quantified as a stutter ratio (FSR): FSR a O O where O a+1 refers to the observed height of the stutter peak, and O a the parent peak a 1 a
24 Stutter ratios Traditionally we apply a filter at analysis to remove stutter e.g. 15% Locus specific Profile/Kit specific Stutter filters remove the label, but not the peak
25 25
26 Stutter ratios This is an in/out (binary) decision Most important when the minor POI is approximately same height as stutter Such a peak may be stutter or stutter/allelic Making an in/out decision may be incorrect and have consequences
27 Stutter products The products are allelic in all aspects Not distinguishable from true allelic products Contribute to the complexity of profile interpretation Especially when a true contributor s alleles are approximately the same height as the stutter product from another contributor.
28 Stutter ratios Stutter ratios are actually allele specific
29 29 TH01 stutter
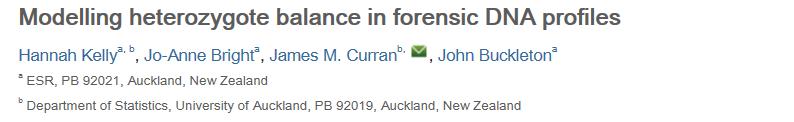
![TH01 repeat structure Common TH01 allele sequences Repeat structure Allele LUS [AATG] 6 6 6 [AATG] 7 7 7 [AATG] 8 8 8 [AATG] 9](/docs-images/85/93044116/images/30-0.jpg "9 9 [AATG] 6 ATG[AATG] 3 9.")
30 TH01 repeat structure Common TH01 allele sequences Repeat structure Allele LUS [AATG] [AATG] [AATG] [AATG] [AATG] 6 ATG[AATG] Longest uninterrupted stretch (LUS) of basic repeat motifs is a good predictor of stutter ratio 30
31 31 TH01 Stutter ratio versus LUS
32 Allele versus LUS, NGM Select loci Stutter ratio Allele y = x LUS R 2 = 27% R 2 = 61% R-squared is a statistical measure of how close the data are to the fitted regression line 32
33 21.2 [AAAG] 2 AG [AAAG] 3 AG [AAAG] 9 AA AAAG [AAAG] 11 G AAGG [AAAG] 2 AG 21.2 [AAAG] 2 AG [AAAG] 3 AG [AAAG] 11 AA AAAG [AAAG] 9 G AAGG [AAAG] 2 AG 22 [AAAG] 2 AG [AAAG] 3 AG [AAAG] 22 G [AAAG] 3 AG 22.2 [AAAG] 2 AG [AAAG] 3 AG [AAAG] 7 AA AAAG [AAAG] 14 G AAGG [AAAG] 2 AG 22.2 [AAAG] 2 AG [AAAG] 3 AG [AAAG] 8 [AG] 5 [AAAG] 12 G AAGG [AAAG] 2 AG 22.2 [AAAG] 2 AG [AAAG] 3 AG [AAAG] 9 AA AAAG [AAAG] 12 G AAGG [AAAG] 2 AG 33
34 O-E Allele SR m max li 5.83,0 c i 34
35 21.2 [AAAG] 2 AG [AAAG] 3 AG [AAAG] 9 AA AAAG [AAAG] 11 G AAGG [AAAG] 2 AG 21.2 [AAAG] 2 AG [AAAG] 3 AG [AAAG] 11 AA AAAG [AAAG] 9 G AAGG [AAAG] 2 AG 22 [AAAG] 2 AG [AAAG] 3 AG [AAAG] 22 G [AAAG] 3 AG 22.2 [AAAG] 2 AG [AAAG] 3 AG [AAAG] 7 AA AAAG [AAAG] 14 G AAGG [AAAG] 2 AG 22.2 [AAAG] 2 AG [AAAG] 3 AG [AAAG] 8 [AG] 5 [AAAG] 12 G AAGG [AAAG] 2 AG 22.2 [AAAG] 2 AG [AAAG] 3 AG [AAAG] 9 AA AAAG [AAAG] 12 G AAGG [AAAG] 2 AG = = = = =
36 36


37 Stutter filters Significantly Over Filtered Not Filtered 3
38 y=0.008x (0.0264) 3
39 39 Forward stutter filters
40 Forward stutter filters usually per locus Locus FSR Locus FSR CSF1PO D2S D10S D3S D12S D5S D13S D7S D16S D8S D18S FGA D19S SE D1S TH D21S TPOX D2S vwa
41 Forward stutter filters exception is D22 41 Back stutter Forward stutter
42 42 Double back stutter


43 Combined Stutter This means you can no longer consider stutter filters on a simple % basis Find back stutter contribution Find forward stutter contribution Add them together 4
44 Total Study Results 64 2 person mixtures Model Over Under After 3SD Total New Traditional NA person mixtures Model Over Under After 3SD Total New Traditional NA person mixtures Model Over Under After 3SD Total Over/Under New Traditional NA 46 2 Grand total New School 30 Old School 186 4


45 1. Heterozygote balance


46 Heterozygote balance Also called peak height ratio Ratio of two heterozygote peaks at a locus Two common definitions Hb Hb 2 1 O O O O HMW LMW smaller larger PHR Where O is observed peak height

47 Heterozygote balance Hb Hb 1 2 O O O O HMW LMW smaller larger PHR rfu 1700 rfu Hb 1 has the highest information content because it maintains peak order Hb 2 may be obtained from Hb 1 but not vice versa
48 Hb versus average peak height Most ratios look better as logs
49 Consistent across platforms Log(Hb) Log(Hb) Identifiler 28 cycles APH GlobalFiler 29 cycles APH Log(Hb) Fusion 30 cycles APH SGMPlus 34 cycles 49
50 Mock samples v Casework There is a strong propensity towards mock samples in the US But some criticism that these do not model casework 50
51 Mock single source Casework single source Mock mixtures 51
52 Transform The variance of a sum is the sum of the variances (if independent) log Hb log H H HMW LMW log H HMW log H LMW varloghb varlogh varlogh HMW LMW 52
53 Transform varloghb varlogh varlogh HMW LMW Assume varlogh varlogh varlogh HMW LMW i var log Hb 2 var log H i 53

54 the relative error proportional to 1 N 0 on the peak areas is N 0 is the number of starting template 54
55 What would a perfect model look like? If we compare the observed profile to the expected profile Log(O/E) Expected allele height 55
56 What would a perfect model look like? 1 E 56
57 Variance of allele model Mean ~ 0 Variance inversely proportional to E 57
58 Variance of stutter model Mean ~ 0 Variance inversely proportional to E Void is because of drop-out of the stutter 58

59 TM