METHOD VALIDATION TECHNIQUES PREPARED FOR ENAO ASSESSOR CALIBRATION COURSE OCTOBER/NOVEMBER 2012
|
|
|
- Oliver Whitehead
- 5 years ago
- Views:
Transcription
1 METHOD VALIDATION PREPARED FOR ENAO ASSESSOR CALIBRATION COURSE TECHNIQUES OCTOBER/NOVEMBER 2012 Prepared by for ENAO Assessor Calibration B
2 SCOPE Introduction House Rules Central Tendency Statistics Population vs Sample Variance Statistics (Measures of Dispersion) Probability Distributions Central Limit Theorem Standard Error of the Mean Sample Distribution of the Sample Mean Z & t statistics Confidence Intervals
3 SCOPE (CONTD) Hypothesis testing One & Two Tailed Tests Outlier Test Student t-test ANOVA (Analysis of Variance) Ruggedness Linear regression; Correlation and Linearity Selectivity/Sensitivity Working Range
4 SCOPE (CONTD) Limit of Detection Limit of Quantification Historical use of Data Historical Repeatability Historical Reproducibility Historical Trueness Historical Calibration Linearity Historical LOD & LOQ Validation vs Verification Summary
5 INTRODUCTION 1 Objective: To equip ENAO Assessors with the necessary tools required to assess the technical aspects of method validation and performance capability. Statistical tools need to be understood in terms of their principles, applications and constraints. One size does not fit all and never will each case is unique because of the approach that each laboratory manager will take.
6 INTRODUCTION 2 As assessors you need to be equipped with the knowledge to assess if the laboratory has adequately validated or verified its methods using whatever tools the laboratory has seen fit to use and make an objective decision if its methodology and approach is comparable in outcome to the outcome that would be achieved using the statistical methodologies described in this workshop.
7 HOUSE RULES CELL PHONES OFF!!! METHODOLOGY INTERACTION EVALUATION
8 CENTRAL TENDENCY Mean: Average value based on the sum of all the observations divided by the number of observations (arithmetic mean). Median: Middle observation (equal number of observations to the left and right of the median) Mode: Most frequent observation (Refer PT Example for Mean & Median). Find the mean, median & mode of the following set of data: 23, 23, 20, 22, 23, 21, 33, 85.
9 POPULATION VS SAMPLE In most cases (not all) it is impossible to determine the population statistics and a sample of the population needs to be taken to a) describe the sample data behaviour in terms of central tendency and dispersion and b) to estimate by means of inferential statistics the distribution of the populations
10 MEASURES OF DISPERSION Variance of a population: Standard deviation of a population:
11 MEASURES OF DISPERSION Variance of a Sample: Standard deviation of a Sample:
12 PRACTICE Determine the mean of the following two sets of sample data: 2, 2, 3, 4, 5, 5 0, 0, 3, 5, 7, 7 Determine the variance and standard deviation
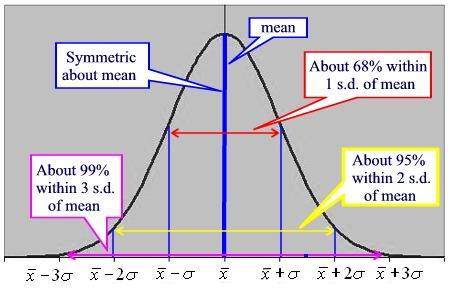
13 NORMAL DISTRIBUTION
14 CENTRAL LIMIT THEOREM The central limit theorem states that: Given a population with a finite mean and a finite nonzero variance 2, the sampling distribution of the mean approaches a normal distribution with a mean of and a variance of 2 /n as n, the sample size, increases.
15 SAMPLING DISTRIBUTION OF THE SAMPLE MEANS The resulting frequency distribution is called the Sampling distribution of the sample means and it has a mean which equals and a standard deviation or Standard error of the mean :

16 SAMPLING DISTRIBUTION OF THE SAMPLE MEANS
17 EXAMPLE 1 SAMPLE DISTRIBUTION OF SAMPLE MEANS: ONE-TAILED The average person drinks 2,0 litres of water, when active, with a standard deviation of 0,7 litres. You have arranged for a full day walk for 50 people and will bring 110 litres of water. What is the probability that you will run out of water? Refer Handout (H1): One-tailed example
18 EXAMPLE 2 SAMPLE DISTRIBUTION OF SAMPLE MEANS: TWO-TAILED You sample 36 apples from your farms harvest of over apples. The mean weight of the sample is 112g (with a 40 g sample SD). What is the Probability (P) that the mean weight of all apples is within 100 and 124 g? Refer Handout (H2): Two-tailed example

19 EXAMPLE 2 SAMPLE DISTRIBUTION OF SAMPLE MEANS: TWO-TAILED
20 Z- & T- STATISTICS
21 CONFIDENCE INTERVALS Where n = sample size; t is dependent on n.
22 HYPOTHESIS TESTING

23 ONE & TWO TAILED TESTS
24 OUTLIER TEST Use the Dixon Q-test: Use with caution & never more than once in a data set. Order the results in ascending order


25 OUTLIER EXAMPLE Bestlabs has started to validate its method for Kjeldajl-N in foodstuffs and has produced the following replicate analyses of a soybean reference material:
26 STUDENT T-TEST The student t-test is used extensively to validate trueness (or bias) Three typical applications: A. Comparison of an experimental mean with a known value. B. Comparison of two experimental means. C. Comparison of two sets of paired data.
27 A. COMPARISON OF MEAN AGAINST KNOWN VALUE Whenever the laboratory wants to evaluate for lack of bias, e.g. by testing a CRM or RM, the following t- test formula can be applied:


28 EXAMPLE 1: COMPARISON AGAINST A KNOWN VALUE A gold ore CRM was tested by Gold Forever Lab Inc over a period of 1 day by one analyst. The CRM value is 8,6 mg/kg with an MU of 0,75 mg/kg. The stated coverage factor is x2.


29 EXAMPLE 2:COMPARISON AGAINST A KNOWN VALUE A beer CRM was tested by Flexi-Labs over a period of 1 day by 1 analyst. The CRM value is 4,56 % alcohol with an MU of 0,21%. The stated coverage factor is x2.


30 EXAMPLE 3: COMPARISON AGAINST A KNOWN VALUE Best-Clinical Labs has conducted a trial to validate the trueness of its Aspartate Aminotransferase test of human serum. It has tested a series of standards and samples and the results of the low level standard are evaluated below:
31 B. COMPARISON OF TWO EXPERIMENTAL MEANS Whenever a lab wants to: Determine if the results of two methods differ significantly; Determine if the results of two analysts differ significantly; Validate one method against a reference or validated method; The following t-test can be applied: Where,
32 CAUTION: COMPARISON OF TWO MEANS FORMULAE Can be expressed in different ways: 1) 2) 3)

33 EXAMPLE 1: COMPARISON OF TWO MEANS Bestlabs have introduced a new ICP to replace its old ICP instrument. It conducts a trial to determine the relative performance of each instrument on the determination of Cu in water. The results of the trial are as follows:


34 EXAMPLE 2: COMPARISON OF TWO MEANS Bestlabs want to introduce a new AA in addition to its group of older models, based on which the Method XYZ has been validated. They want to commission the new instrument and ensure that it meets the performance capability of method XYZ. They conduct the following experiments:
35 C. COMPARISON OF TWO SETS OF PAIRED DATA Comparison of different samples using two different methods for testing: or


36 EXAMPLE: COMPARISON OF TWO PAIRED DATA SETS Best-Clinical Labs has purchased a new spectrometer for the performance of chemical testing on human serum and it wants to perform duplicate tests on a series of samples using the old manual spectrometer and the new automated spectrometer to determine if there is a difference in the means of the paired results. The following results were obtained for cholesterol in human serum:
37 ANALYSIS OF VARIANCE (ANOVA) Student t-tests can only be used for comparison of two data sets for hypothesis testing. ANOVA is used when three or more data sets need to be compared and is commonly used in testing of ruggedness/robustness. It can be used to evaluate the data sets produced by different analysts; different instruments; and in general different variable inputs usually used during method development and validation. Explain by example.

38 EXAMPLE 1 - ANOVA The following results were obtained for a replicate test of a reference material by three analysts in the same laboratory: H o = There is no difference between the means at the confidence of level 95% H a = There is a difference between the means at the confidence level of 95%.

39 EXAMPLE 1 - ANOVA

40 EXAMPLE 2 - ANOVA Best Clinical Labs is unable to calibrate its centrifuge and wants to prove that it has no significant affect on the results of its Alkaline Phosphatase test on human serum. The test requires the blood to be centrifuged at 1500 rpm for 5 mins so it conducts a series of tests with varying rpm on blood a blood sample.
41 EXAMPLE 2 - ANOVA

42 RUGGEDNESS Youden Approach to Ruggedness determination:

43 RUGGEDNESS Factor matrix for Method Ruggedness: See Ruggedness Handout
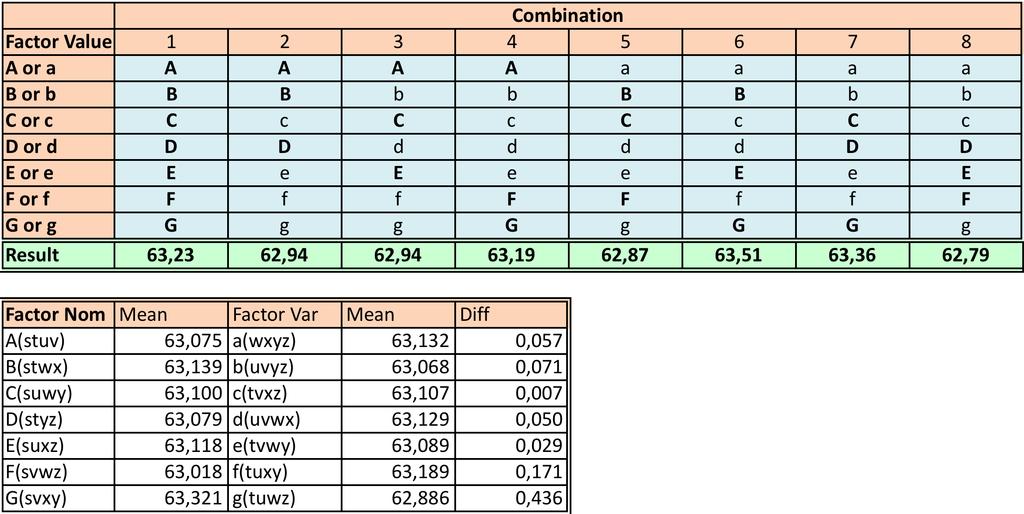
44 RUGGEDNESS EXAMPLE

45 YOUDEN SIGNIFICANCE TESTING
46 LINEAR REGRESSION, CORRELATION & LINEARITY Least squares method provides an estimated regression equation that minimizes the sum of the squared differences between the observed values of the dependent variable, y, and the estimated values of the dependent variable. The resulting linear regression equation can be expressed as where and
47 LINEAR REGRESSION, CORRELATION & LINEARITY
48 LINEAR REGRESSION, CORRELATION & LINEARITY Correlation co-efficient, r, provides an estimate of goodness of fit but it does not estimate the extent of linearity: Refer Fig 9: Preparation of Calibration Curves Linearity A) Check for outliers that could cause bias and/or leverage B) Plot residuals (observed estimated dependent variables) and check for normality (refer Fig 7) B) Check F-statistic in regression print-out the larger the more significant linearity is and p-value < 0,05 NOT RECOMMENDED SEE WORKED EXAMPLE
49 SELECTIVITY/SPECIFICITY Both terms relate to the degree to which a method responds uniquely to the target analyte. Typically, selectivity studies investigate the effects of of likely interferents usually by adding the potential interferent to both blank and fortified/spiked samples and observing the response. Usually used to demonstrate that the practical effects are not significant within specified concentration ranges.
50 WORKING RANGE Working range is not necessarily directly related to the calibration range. The calibration range may have been chosen to optimize linear response Samples may therefore be either concentrated or diluted to ensure that the response is measured towards the middle of the calibration curve. Labs would need to determine the limits of their working range based on either the statement of the standard method or by the constraints of dilution or concentration that might impact on the measurement uncertainty of the result.
51 LIMIT OF DETECTION Practically evaluated by analyzing at least 20 blanks (or a mix of blanks and low conc level samples/standards at or close to stated LOD) and obtaining the mean and SD or the pooled SD. LOD = MEAN + 3 X SD Theoretical calculation from residual standard deviation of regression equation (refer LOD Example Handout)
52 LIMIT OF QUANTITATION Practically evaluated by analyzing at least 20 blanks (or a mix of blanks and low conc level samples/standards at or close to stated LOQ) and obtaining the mean and SD or the pooled SD. LOQ = MEAN + 10 X SD Theoretical calculation from residual standard deviation of regression equation (refer LOQ Example Handout)
53 USE OF HISTORICAL DATA Labs that have had a good QC system established for some time and seek to improve the quality of their service by implementing a quality system in accordance with ISO or ISO/IEC may decide to use historical information to verify/ validate their methods. Such an approach would typically use: Duplicate/replicate results from QC charts; Standard, Reference material or CRM results; PT results.
54 HISTORICAL REPEATABILITY Assuming real samples have been replicated for QC range-chart use (usually duplicates), then Determine the range of each set (pair); Determine the estimated SD using the d 2 quotient; Plot the SD against the mean and perform a regression analysis to determine the relationship. If the correlation is low then use a simple RSD% relationship to estimate the repeatability SD. (Refer Historical Repeatability Handout Example)
55 HISTORICAL REPRODUCIBILITY Assuming the same (stable) sample or standard has been tested over a period of time for QC purposes, then the results can be evaluated to determine the reproducibility precision where sample/standard was tested using different operators; ; over a prolonged period; using different reagents; under different conditions.
56 HISTORICAL TRUENESS (BIAS) Assuming a standard of known value with an assigned MU has been tested over a period of time as a QC sample then the results can be analysed to determine significance at the 95% confidence level in exactly the same way as described for the application of the t-test for comparison of a mean against a known value. This is a more rugged approach than the experimental approach since it takes into account different operators; over a prolonged period; using different reagents; under different conditions.
57 HISTORICAL CALIBRATION LINEARITY Again, assuming the prolonged application of good laboratory QC techniques, the laboratory may be in a position to analyses its calibration data over multiple calibrations to determine if the residuals are normally distributed around zero. This is a more rugged approach than the experimental approach since it takes into account different operators; over a prolonged period; using different reagents; under different conditions.
58 HISTORICAL LOD & LOQ The theoretical LOD & LOQ could be determined from historical information if regression analysis is available for the calibration curves. However, it would be wise to conduct practical evaluations of the LOD & LOQ for comparative purposes as previously described.

59 VALIDATION VS VERIFICATION
60 EMPIRICAL AND MEDICAL METHODS An empirical method is a method agreed upon for the purposes of comparative measurement where the measurand depends on the method in use. i.e. the method defines the measurand. Method bias is zero but laboratory bias needs to be accounted for using RM certified using the particular method or by inter-lab studies.
61 SUMMARY 1 There is no standard that can be used for validation or verification since each case tends to be unique. As assessors you need to be equipped with the knowledge to assess if the laboratory has adequately validated or verified its methods using whatever tools the laboratory has seen fit to use and make an objective decision if its methodology and approach is comparable in outcome to the outcome that would be achieved using the statistical methodologies described in this workshop.
62 SUMMARY 2 Do not have preconceived ideas on how a lab should approach a validation or verification rather look for evidence that the validation is either adequate or not. Apply statistics cautiously (e.g. the fallacy of correlation and the F value in the regression as an indicators of linearity!). Only use statistics where you understand the principles and application. Sometimes an eye is better than a number!