Design Issues in Omics Studies
|
|
|
- Gordon Bailey
- 5 years ago
- Views:
Transcription
1 Design Issues in Omics Studies Patty Solomon University of Adelaide BioInfoSummer 30 November 2010 Walter and Eliza Hall Institute, Melbourne
2 Why design matters in omics studies We still have little intuition about what makes sense in high dimensions. So, if we are to use genomic signatures as biomarkers, we need to know that the underlying data and analyses are correct, and checkable. The role of design is to ensure the study is feasible, that the questions of interest can be answered, and to avoid disaster. Statistical efficiency comes a long way behind these.
3 Genome = DNA double helix DNA makes RNA makes protein
4 Transcriptome I : coding RNA mrna

5 Transcriptome II : non-coding RNA micro-rna trna rrna
6 Types of omics studies I Most are comparative e.g., mutant vs wild-type, tumour vs normal, drug-treated vs control cells,.... If the assigned treatments are under the control of the investigator, the study is an experiment e.g., response surface designs. Most are observational i.e., the investigator determines which units are studied and the observational process e.g., match serrated (case) with conventional (control) polyps in colon cancer study. There is rarely a single objective or hypothesis. Often, the study is a screen where the aim is to identify genes associated with a condition or outcome.
7 Types of omics studies II Classification: of samples into groups given a priori. Association: of gene expression with e.g. survival time. Exploratory: seeking sets of genes sharing observed patterns, or sets of samples which cluster in a meaningful way. All these studies have characteristics in common: * lots of complex measurement processes in wet lab. * followed by the application of a piece of industrial-strength biotechnology equipment * which produces lots of measurements.
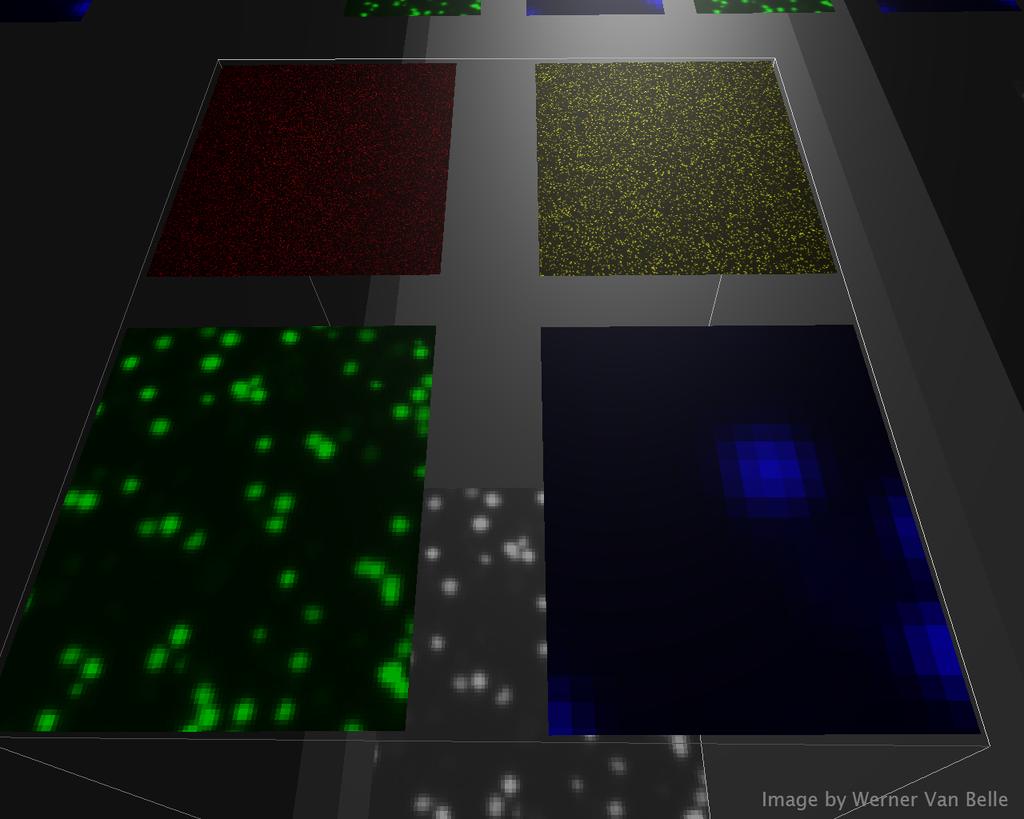
8 Biotechnology I: cdna microarray assay for gene expression Make cdna reverse transcript Label cdnas with fluorescent dyes Clinical sample Hybridisation to microarray Control Experimental Laser excitation Laser emission + = Cy3 Cy5 Cy5/Cy3


9 enomics Biotechnology nce and Engineering - ETHIIZurich P ROTEOMICS Custom arrays, high-density ethylation What Do the Data Look Like? Array oligonucleotide arrays, exon, Analysis tiling arrays,... Deep-sequencing nscriptome High-throughput PCR surements PCR (a single gene is copied) Genes Array PCR CHIP-SEQ Proteomic mass spectrometry novo Sequencing Discovery of copy Array 1/Array Ar to fra
10 More characteristics of omics studies: The notion of replicate can be subtle. The cdna and short oligo technologies The cdna and short oligo technolo Biological replicates usually clear. But technical replicates arise at a number of levels, depending on how much of the process they share: Cells Extract RNA Always: # replicates << # measurements
11 Common characteristics concluded: Biological variability is reasonably well understood. But after that, things get more complicated. There are variability hierarchies, depending on context. For example: variability between organisms/organs > variability between tissues > variability between cell samples > variability between single cells So, in fitting models to your data, + σ 2 may be fantasy.
12 Design encompasses all the structural and material aspects of a study or experiment. The key design principles are: Randomisation Control (or blocking) Replication Blinding Their purpose is to avoid bias and confounding, among other things. The SCALE of experimentation in bioinformatics is highlighting the presence of batch effects.
13 Case Study 1: Cancer subtypes Researchers at MD Anderson Texas, conducted an experiment on serum samples from patients with Chronic myelogenous or Acute lymphoblastic leukaemia. SELDI-TOF-MS was applied for protein profiling of the serum samples. Aim: to identify the protein peaks that uniquely defined a given leukaemia subtype (CML or ALL). The raw spectra were pre-processed using in-house routines for SPDBC, followed by normalisation to total ion current. Performed hierarchical clustering of all samples to evaluate the ability of the peaks to discriminate between cancer subtypes. Surprisingly...
14 Hierarchical clustering of samples Run date effects can be larger than biological effects
15 Case Study 1: Cancer subtypes cont. Spectra from QC material run concurrently showed the same clustering pattern as the biological samples. Attempts to apply simple additive shifts to align the QC samples to fix the problem failed (Hu et al, 2005). What to do? Avoid running samples as they come in. Include some members from each contrasting sample in each laboratory-run group. If the run groups are large, randomise the run order. Record all relevant and clinical information.
16 Case Study 2: Try to avoid disaster... Lancet, 359, 2002: ovarian cancer patients; 100 normal controls; 16 patients with benign disease. Used 50 cancer and 50 normal spectra to train a classifier and tested it on the rest. Correctly classified 50/50 of the cancer cases; 46/50 of the controls, and 16/16 of the benign disease as other.
17 Case Study 2: Almost immediately, various questions about oddities in the data are raised by Keith Baggerly and others... The results are not reproducible from the same data. There was an apparent change of protocol near the end of the dataset. No time-m/z calibration. No evidence that the order of processing was randomised. Perfect classification of peaks is achieved in the noise region of the data (see next slide)...
18 Perfect Separation, using a completely different pair. Further, look at the masses: this is the noise region. Case Study 2: Disaster unfolding PROTEOMICS Another Bivariate Plot: M/Z = (2.79,245.2)
19 Case Study 2: The abortive followup In January 2004, three companies announced plans to offer a home brew diagnostic assay called Ovacheck. In July 2004, Conrads et al* processed samples with their original SELDI technology and also with a higher resolution instrument called the QqTOF. They added some QA/QC steps to remove bad spectra. They demonstrated 100% sensitivity and 100% specificity for identifying cancer from normal, and stated that this emerging paradigm is ready to go to a full-scale clinical study. What was going on? * Endocrine Related Cancer , 2004
20 Here is their Figure 6A Day 1 Day 2 Day 3
21 *All* of the controls were run before *all* of the cancers
22 Case Study 2: Concluded A better machine will not save you if the study design is poor! Obviously, there is no way a woman should be told she needs an oophorectomy based on this test. In June 2004, the US FDA blocked its use pending further validation... and we are still waiting for such.
23 Case Study 3: 1000 Genomes Project Tackling the widespread and critical impact of batch effects in high-throughput data Jeffrey T. Leek, Robert B. Scharpf, Héctor Corrada Bravo, David Simcha, Benjamin Langmead, W. Evan Johnson, Donald Geman, Keith Baggerly and Rafael A. Irizarry NATURE REVIEWS Their definition of batch effects includes laboratory conditions, reagent lots and personnel. When these effects are correlated or (worse) confounded with the biological outcome of interest, we get wrong answers.
24 Case Study 3: 1000 Genomes Project We consider the analysis of second-generation sequencing data from 131 individuals in 6 Hapmap populations, and a 3.5 Mb region from chromosome 16. Chromosome 16 was binned into 10Kb regions and total number of reads aligned to each bin for each individual was the statistic (counts were then quantile normalised). Feature data were standardised across samples: blue 3 s.d. < average and orange 3 s.d. > average. Samples are ordered by processing date...

25 Batch effects for second-generation sequencing data Each row is a different individual, all from same processing group The largest batch effect occurs between days 243 and 251
26 Case Study 3: Continued Further analysis showed that 32% of features were associated with processing date. But up to 73% were associated with the second Principal Component (ranked in order of variability explained) - in a situation where the PCs cannot be explained by the biology. This strongly suggests other (unknown) sources of batch variability are present. What to do?
27 Case Study 3: Concluded Use clinical trial design principles, including distributing biological contrast groups equally across centres in a multi-centre study; use identical protocols. Randomise run order within centres, etc, as before. Record all relevant information and clinical variables so that potential confounding effects and unwanted structure can be checked by the statistician (e.g., using PCA or clustering). Use statistical analysis solutions as well, and if possible.
28 Stages of a study/experiment 1. Planning and preparation The statistician should be involved from the outset to discuss: the aims or hypotheses (if you have any) the study population (people, organs, cadavers, cell lines,...) especially sources of variability, potential replication, choice of control; the type of study (observational, time course,...) the choice of technology/platform important clinical and epidemiological variables (e.g., age and tumour stage at diagnosis, date of death).
29 2. Samples and cells This stage is about obtaining the cell samples without selection bias from the original organisms/organs. Depending on context, this involves choosing the samples, the number of samples, extracting tissue/blood/cell samples from these. Using randomisation wherever possible. And blinding. This may take days/weeks/months, so time may be an issue (temporal trends, mode of storage, time spent in storage, degradation of samples,...). Records should be kept - dates, changes in lab. personnel, how the lab. technician performs the extractions, protocols,....
30 3. Molecular samples This stage is about starting with cells samples and ending up with molecular samples for measuring. That is: extraction, amplification, pooled vs unpooled, probe labelling, etc. And, deciding on the nature and amount of replication. Amplification is a major source of variation, but there are others, such as quality of RNA. Record everything, including times, reagents and equipment used, protocols, operators,....
31 4. Assay design This stage is about assigning the molecular samples to components of the technology. For example: pairing(dye-swaps) in twochannel microarrays (direct comparisons versus reference design); allocating samples to runs in single-channel (Affymetrix) microarrays. µ 0 µ 1 µ 2 µ 3 Day Issues to watch out for: choice of reference (esp. in common reference design) or control. References: Kerr & Churchill, Glonek & Solomon, Mukherjee, and others
32 Case study 4: Cushing s Disease Is a rare disease of the pituitary gland which causes it to release too much ATCH. Symptoms in adults include obesity, moon face, and a large adrenal gland. Researchers in Adelaide approached the AMF to conduct a microarray experiment on 3 brothers with Cushing s Disease; a Pedigree of the family was also being established. Tissue samples from the brothers and 4 controls were hybridised using Human GeneChip Arrays. Early on, the choice of controls was an issue, because control tissue was scarce...

33 Cushing s Disease and PCA

34 More Cushing s Disease and PCA
35 Case Study 4: Cushing s Disease The 2 Clontech pooled control samples were from male and female cadavers, years old, with? tissues. Unlikely to help shed light on the genotype of Cushing s Disease. Controls like Bruce, matched on sex and age would be better, if they could be obtained. PCA is a useful exploratory tool - we may know structure in the data exists, but it can tell us how to respond.
36 5. Assay execution In this crucial stage of the study, the (now prepared) molecular samples are run on the equipment. This is probably the most important stage for the statistician to be directly involved, but they usually aren t.
37 Case Study 5: Biostatistics vs Lab Research Here s how *not* to consult with your statistician...

38
39 A few more recommendations... Your data will become publicly available... documentation is often poor - make sure yours isn t, and ensure your results are reproducible. You do not want your research to feature as one of Keith Baggerly s Case Studies in Forensic Bioinformatics.

40 Acknowledgements Chris Bagley, Hospira Greg Goodall Keith Baggerly Terry Speed
41 Custom array for chromosome screening spot by spot log ratios Spot vs Genepix Yq11.2 Yp Y (X ) Y (Hong) X Inv Positive Control Negative Control chromosome_22 chromosome_21 chromosome_20 chromosome_19 chromosome_18 chromosome_17 chromosome_16 chromosome_15 chromosome_14 chromosome_13 chromosome_12 chromosome_11 chromosome_10 chromosome_09 chromosome_08 chromosome_07 chromosome_06 chromosome_05 chromosome_04 Spot Genepix chromosome_03 chromosome_02 chromosome_ log intensity ratio
42 Custom array for chromosome screening Log ratio difference: Spot Genepix _C max 0 max +