Supplementary
|
|
|
- Gary Lawrence
- 5 years ago
- Views:
Transcription
1 Supplementary information Supplementary Material and Methods Plasmid construction The transposable element vectors for inducible expression of RFP-FUS wt and EGFP-FUS R521C and EGFP-FUS P525L were derived from the enhanced piggybac (epiggybac) vector epb-bsd-tre described in Rosa and Brivanlou, Briefly, a cassette encoding for the rtta- Advanced protein (Clontech) was fused to the Puromycin or Blasticidin resistance coding sequences through a T2A self-cleavage peptide element, and put under the control of the ubiquitous pubc promoter in the epb-bsd-tre vector. The resulting plasmids (epb-puro-tt and epb-bsd- TT) hold on the opposite direction the tetracycline-responsive promoter element (TRE), followed by a short multicloning site. Therefore both elements of the TET-ON system are present in the same vector. The RFP and EGFP coding sequences, devoid of the stop codon, were then inserted in the epb-puro-tt and epb-bsd-tt plasmids, respectively, generating the epb-puro-tt-rfp and epb- Bsd-TT-EGFP. Finally, the coding sequences of FUS, wild type or mutated, were cloned in frame with the fluorescent proteins, generating the epb-puro-tt-rfp-fus wt, epb-bsd-tt-egfp- FUS R521C and epb-bsd-tt-egfp- FUS P525L. Drosha in vitro processing. In vitro processing assay was carried out as previously described (Lee and Kim, 2007 ). Pri-miRNA substrates were prepared by in vitro transcription, using T7 RNA polymerase (Promega), from PCR amplified templates (oligonucleotides are listed in Table II), in the presence of [!-32P]UTP (Perkin-elmer). 100'000 cpm of each pri-mirna transcript were incubated with 15 mg of SK-N-BE nuclear extract cells at 37 C for 90 minutes. Supplementary references!""#$%#&'(#)*#+,--./#!"#$%&'(#012#'1#3'34#055065#748#9:"#0;9'3'96#47#<845:0#;4(=>"?@#)*&+(,-#."/01(2#!"#a#bcde-f# Rosa A, Brivanlou AH (2011) A regulatory circuitry comprised of mir-302 and the transcription factors OCT4 and NR2F2 regulates human embryonic stem cell differentiation. EMBO J 30: Supplementary Figure Legends Figure S1. (A) mirna and protein levels during SK-N-BE cells differentiation. SK-N-BE cells were induced to differentiate with retinoic acid (RA) and incubated for the indicated times (0, 1, 3, 6 and 10 days)., mir-125b and mir-132 were analyzed by Northern blot using corresponding specific oligonucleotides. 5.8S rrna was used as internal control. The histogram indicates the relative levels normalized for the 5.8S signal. Lower panel: Western blot analysis of N-Myc and FUS proteins at the same time points. (B) mirna profiling in SK-N-BE and HeLa cells treated with anti-fus sirna () or with AllStars Negative Control sirna (). SK-N-BE cells were cultured in RA for 6 days. Pie charts and tables showing the percentage of mirna derelegulated more than 0,2 fold. Figure S2. FUS interference. (A) Levels of neuronal-specific mirnas in RA-treated SK-N-BE cells in two different sets of RNAi experiments where the residual FUS levels were 45% and 20% respectively. AllStars Negative Control sirna () were utilized as control. Left panels: Western blot analysis of FUS and GAPDH proteins. Relative quantification (RQ) of FUS versus GAPDH is shown with respect to the condition set to a value of 1. Right panels: histograms of mirna levels analysed by qpcr normalized for the snorna-u25 internal control. The values are
2 the average from 3 independent experiments and are expressed with respect to the condition set to a value of 1. (B) SK-N-BE cells were treated with sirnas against the 3 UTR of FUS (- 3 ) or scrambled sirna () and maintained in retinoic acid (RA) for 6 days. mirna levels were analyzed by RT-qPCR. The histogram represents the average of 3 different measurements. mirna levels were normalized for the snorna-u25 internal control. Figure S3. Coomassie staining showing the quality of purified recombinant GST-FUS WT and GST- FUS R521C. Different amounts of BSA protein are used as quantity control. Marker of molecular weight is also shown. Figure S4. Intracellular localization of wild type and mutated FUS proteins. (A) Schematic representation of the epb-puro-tt-rfp-fus wt, epb-bsd-tt-egfp-fus R521C and epb-bsd-tt- EGFP-FUS P525L constructs. Triangles indicate the 5 and 3 Terminal Repeats (TR) of the epiggybac vector. (B) SK-N-BE cells were co-transfected with epb-puro-tt-rfp-fus wt and epb-bsd-tt- EGFP-FUS R521C (top panels) or with epb-puro-tt-rfp-fus wt and epb-bsd-tt-egfp-fus P525L (bottom panels), together with a plasmid encoding for the epiggybac transposase. After selection with 1"g/ml Puromycin and 10 "g/ml Blasticidin, stably transfected cells were induced with 0,2"g/ml Doxycyclin for 3 days. Images were taken with a Zeiss Axio Observer A1 fluorescence microscope at 20X magnification. Scale bar=20 "m. Figure S5. FUS depletion does not affect Drosha-mediated processing in vitro. In vitro processing with 32 P-UTP labelled pri--2, pri-mir-125-b and pri-mir-132 using nuclear extracts from SK-N-BE cells treated either with AllStars Negative Control sirna () or sirna against FUS (). The mock samples with no extract are used as controls. #


3 Figure S1 A B SK-N-BE arbitrary units mir-125b mir days of RA downregulated ,26% unaffected 22 11,70% upregulated 17 9,04% Total ,00% mir-125b mir S N-Myc FUS GAPDH Northern blot Western blot HeLa downregulated 53 30,46% unaffected 59 33,91% upregulated 62 35,63% Total ,00%

4 Figure S2 A FUS GAPDH RQ FUS GAPDH RQ 1 0,45 1 0,20 arbitrary units arbitrary units 1,2 0,9 0,6 0,3 0,0 1,2 0,9 0,6 0,3 0,0 mir-125b mir-132 mir-125b mir-132 B 1,2-3' 1,0 0,8 0,6 0,4 0,2 0,0

5 Figure S3 KDa 115 M g of BSA 0,2 0,5 GST-FUS WT GST-FUS R521C % gel Coomassie
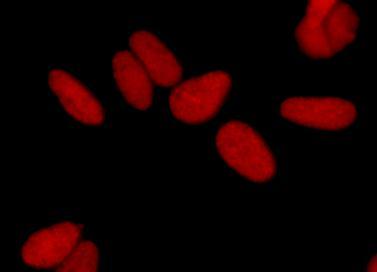


6 Figure S4 A epb-puro-tt-rfp-fus wt epb-bsd-tt-egfp- FUS R521C/P525L B EGFP-FUS R521C RFP-FUS WT merge 20 m EGFP-FUS P525L RFP-FUS WT merge


7 Figure S5 pri--2 pri-mir-125b-2 pri-mir-132 mock mock mock pre-mirna