Deformation Drives Alignment of Nanofibers in Framework for Inducing Anisotropic Cellulose Hydrogels with High Toughness
|
|
|
- Arlene Berry
- 5 years ago
- Views:
Transcription
1 Supporting information Deformation Drives Alignment of Nanofibers in Framework for Inducing Anisotropic Cellulose Hydrogels with High Toughness Dongdong Ye, Qiaoyun Cheng, Qianlei Zhang, Yixiang Wang, Chunyu Chang,,* Liangbin Li, Haiyan Peng, ǁ and Lina Zhang,* College of Chemistry and Molecular Sciences, Wuhan University, Wuhan , China. National Synchrotron Radiation Lab and College of Nuclear Science and Technology, University of Science and Technology of China, Hefei , China Department of Agricultural, Food and Nutritional Science, University of Alberta, Edmonton, Alberta, T6G 2P5, Canada ǁ Key Laboratory for Material Chemistry of Energy Conversion and Storage, School of Chemistry and Chemical Engineering, Huazhong University of Science and Technology, Wuhan , China * (L. Zhang); (C. Chang). S-1
2 Crosslinking density of loosely chemically crosslinked cellulose hydrogel. The crosslinking density was determined from the swelling value, which were measured after subjecting the loosely crosslinked cellulose hydrogels (LCHs) to water at room temperature for totally swelling. The swelling coefficient, Q was defined as: Q= (1) The number average of molecular weight between cross-links,, was calculated from the [1, 2] formulae according to the Flory-Rehner theory modified by Peppas: = / (2) γ= (3) Where is the number average molecular weight of the polymer before crosslinking. V = 1/ 1+ is the volume fraction of the cellulose in the swollen hydrogels. V is the molar volume of the solvent (18 cm 3 /mol). d is the density of polymer. is the polymer-solvent interaction parameter (1.18 in the cellulose-water system). [3] Table S1. Crosslinking density of LCHs. Sample Crosslinking density (mol/m 3 ) Molecular between crosslinks (kg/mol) LCH LCH LCH LCH LCH LCH LCH S-2
3 Figure S1. Pictures of cotton linter pulps, cellulose solution, and properties of cellulose dilute solution. (a) Cotton linter pulps. (b) Transparent cellulose solution (6wt%). (c) AFM height images, phase images and corresponding 3D images of cellulose chains and aggregates in dilute cellulose solution with the concentration of mg/ml and mg/ml. Inset: the altitudinal curves of cellulose chains and aggregates. (d) R h distribution of cellulose in alkali-urea aqueous solution at different concentration with the scatting angle θ of 30. S-3
4 Figure S2. Solid state 13 C NMR of physically cross-linked cellulose hydrogel (PCH), TCHs, and LCH. Solid-state 13 C NMR measurements were carried out on a Bruker AVANCE-III spectrometer operating at 400MHz using the combined technique of cross-polarization, magicangle spinning (CP/MAS). The spinning speed of rotor was set at 5 khz for all dried hydrogel specimens. The contact time for cross-polarization was 3 ms; the acquisition time was 50 ms; the recycle delay time was 1 s. A typical number of 2000 scans were acquired for acquiring each spectrum. S-4
5 Figure S3. X-ray diffraction profiles of the physically cross-linked cellulose hydrogel (PCH), TCHs, and LCH. The XRD patterns of the aforementioned cellulose hydrogels were recorded on a Riguka smartlab 9k diffractometer operated at 45 kv, 200 ma in reflection mode for CuK α (λ= nm) with a scan speed of 2 /min and a step size of 0.05 in 2θ. S-5
6 Figure S4. Appearance of cellulose hydrogels. (a-b) Photographs of LCH specimen before and after compression. (c) LCH specimen holding in hands. (d-e) Pictures of TCH specimen before and after compression. (f) TCH specimen under stretching deformation. Scar bar: 1cm. S-6
7 Figure S5. AFM height images and FE-SEM images of cellulose hydrogels. (a) LCH. (b) TCH- 7. (c) TCH-5. (d) TCH-1. Inset: the magnified surface images of the corresponding hydrogels. S-7


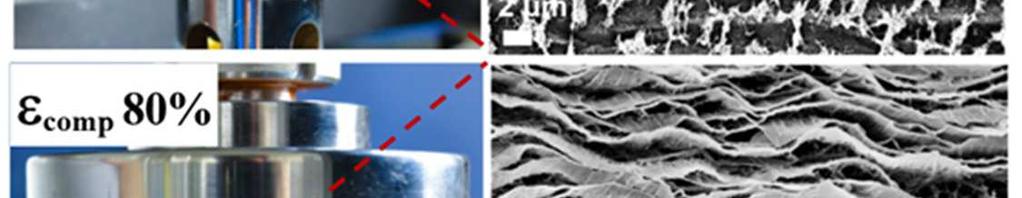


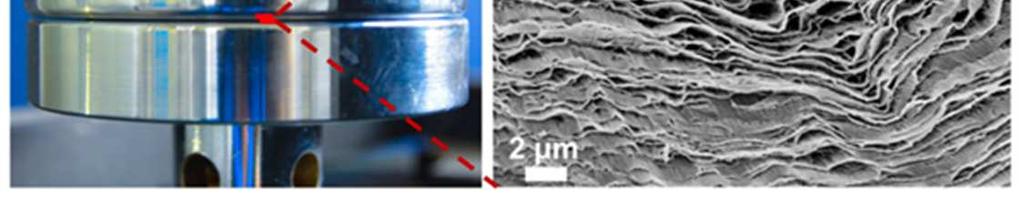
8 Figure S6. Photographs of compressed TCH specimens and corresponding SEM images of TCH cross-section under various compressive strains. S-8
9 Figure S7. Photographs of dried TCH specimens. (a) Photograph of dried gel. (b) Corresponding photograph of dried gel in (a) between crossed polarizers. The normal dried TCH specimen had no birefringence indicating the inexistence of anisotropic architecture in dried gel. (c) Photographs of deformed xerogels. (d) Corresponding photographs of deformed xerogels in (c) between crossed polarizers. The deformed xerogel specimens demonstrated the iridescent birefringence patterns under polarized light indicating the presence of anisotropic architecture, which was derived from the realignment of cellulose microfibrils induced by external force in deformed hydrogels. S-9
10 Figure S8. Wide angle X-ray scattering results of TCH-5 hydrogels with different stretching strains. (a) 2D WAXS patterns of TCH-5 hydrogels with different stretching strains (e.g. 0%, 30%, 60%, 90%, 100%, 110%, 120% and 130%). (b) Azimuthal-integrated intensity distribution curves, where 0 o represents the perpendicular direction. (c) Effect of tensile strains on orientation parameter. S-10
11 Figure S9. Obtaining 2D WAXS pattern of cellulose in orientated cellulose hydrogel through eliminating the interference from both air and water background. 2D WAXS patterns of the representatively oriented cellulose hydrogel (a), pure water (b), and air atmosphere (c) under the same conditions. The 2D WAXS pattern of cellulose in deformed cellulose hydrogel was calculated through eliminating the contribution from internal water and external air (d). The arrows appearing in the colors of white, red and blue represented the signal of cellulose, water and air, respectively. And the corresponding intensity-diffraction angle integrated curves were put down on the 2D WAXS patterns. S-11
12 Figure S10. Wide angle X-ray scattering results of the dried TCH specimens with different stretching strains. (a) X-ray diffractograms of the anhydrous hydrogels with the tensile stretching from 0% to 140% in surface plane direction (beam perpendicular to tensile direction of the anhydrous gels). (b-c) Azimuthal intensity distribution profiles of the (110) scattering plane obtained from X-ray diagrams of anhydrous cellulose hydrogels in the plane directions. Note: the signal concentrated from holders of samples was eliminated in Intensity-azimuthal angle curves. (d) Herman s orientation parameters (f c ) as a function of tensile strain, calculated with WAXS data. S-12
13 Figure S11. Small angle X-ray scattering results of TCH-5 hydrogels with different stretching strains. (a) 2D WAXS patterns of TCH-5 hydrogels with different stretching strains (e.g. 0%, 30%, 60%, 90%, 100%, 110%, 120% and 130%). (b) Azimuthal-integrated intensity distribution curves, where 0 o represents the perpendicular direction. (c) Effect of tensile strains on orientation parameter. (d) 2D SAXS patterns of TCH-5 hydrogels with different stretching strains (e.g. 0%, 30%, 60%, 90%, 100%, 110%, 120% and 130%). (e) Azimuthal-integrated intensity distribution curves, where 0 o represents the perpendicular direction. (f) Effect of tensile strains on orientation parameter. S-13
14 Figure S12. Small angle X-ray scattering results of TCH-5 specimen under gradually increasing of compressive strains. (a) 2D SAXS patterns of compressed TCH-5 specimen with the beam perpendicular to the compression direction. (b) Azimuthal-integrated intensity distribution curves calculated from (a). (c) Effect of compressive strains on orientation parameter. (d) 2D SAXS patterns of compressed ECH-5 specimen with the beam parallel to the compression direction. (e) Azimuthal-integrated intensity distribution curves calculated from (d). (f) Effect of compression strains on orientation parameter. S-14
15 Figure S13. Mechanical properties of LCH. (a) Representative tensile stress-strain curve of LCH. (b) corresponding tensile stress-strain test of LCH during loading-unloading cycles of varying maximum stretching. (c) Representative tensile stress-strain curves of LCHs during 5 times loading-unloading cycles at 40% and 50% strain, respectively. (d) Representative compressive stress-strain curve of LCH. (e) Typical compressive stress-strain test of LCH during loadingunloading cycles of varying maximum stretching. (f) Representative compressive stress-strain tests of LCHs hydrogels during 5 times loading-unloading cycles at 40%, 50%, 60% and 65% strain, respectively. S-15

 hydrogels as swollen elastic networks. J. Appl.")


16 Figure S14. 3D elasticity map of TCH-7 from nano-indentation measurements. The grid scan was points, and the point-to-point pitch was 20 µm. REFERENCES 1. Peppas, N. A.; Merrill, E. W. Crosslinked poly (vinyl alcohol) hydrogels as swollen elastic networks. J. Appl. Polym. Sci. 1977, 21, Canal, T.; Peppas, N. A. Correlation between mesh size and equilibrium degree of swelling of polymeric networks. J. Biomed. Mater. Res. 1989, 23, Matsuguchi, M.; Umeda, S.; Sadaoka, Y.; Sakai, Y. Characterization of polymers for a capacitive-type humidity sensor based on water sorption behavior. Sensors and Actuators B. 1998, 49, S-16