Process simulation of biomass torrefaction for energy applications
|
|
|
- Martin Barrett
- 5 years ago
- Views:
Transcription

1 Process simulation of biomass torrefaction for energy applications Tirivaviri Augustine Mamvura University of South Africa

2 UNIversity of South Africa (UNISA) Largest open distance learning (ODL) institution in Africa Enrols 1 Τ3 of all South African students Offer short courses, certificate programmes, 3 4 year degrees & diplomas Has over current students & graduates close to students annually
3 Introduction Lignocellulose based biomass (Fig 1) being used for renewable energy applications as an alternative to coal Organic waste finding application also reduces waste at landfill sites & clean the environment Drawback: biomass has less energy density, more moisture & more volatiles when compared to coal Solution: Torrefaction (Fig 2) used to improve these properties Products: solid biochar & torrefaction gases consisting of volatiles & permanent gases Products depend on type of biomass being used
4 Fig. 1: Biomass structure Proximate analysis: Moisture (MC) Ash Fixed Carbon(FC) Volatile Matter (VM) Unbound moisture LIGNOCELLULOSIC BIOMASS ORGANIC MATTER ASH HEMICELLULOSE: 20 30wt% CELLULOSE: 40 44wt% LIGNIN: 18 35wt% Carbon Hydrogen Oxygen Nitrogen Sulfur Ultimate Analysis:
 Inert")
5 0 < Residence time 0.5 hr 200 Temp 300 o C Important gases: CO; H 2 ; CH 4 (Balance) Inert atmosphere ( 60 95%) Fig. 2: Torrefaction process
6 Experimental studies: mass & energy yields, product distribution, biomass grindability, biomass hygroscopic properties & heat recovery from combustion of torrefaction gases reliable data for torrefaction reactor design Setback1: Different types of biomass with varying proximate & ultimate analysis tedious to perform experiments for each type of biomass to determine optimum conditions Setback2: Woody biomass give rise to more solid char, plant or waste biomass give rise to more torrefaction gases Setback3: Change one parameter in experimental studies optimum conditions chosen from specific experimental conditions no longer valid Alternative solution: process simulation & modelling Bergman et al., (2005) Torrefaction for biomass co-firing in existing coal-fired power stations, Energy Research Centre of The Netherlands, ECN Biomass Report ECN-C
7 Design & synthesis problems rely on predictions of process models, nonlinear in nature nonlinear programming(nlp) NLP problems represented as: Minimize f x subject to ቊ h x = 0 g(x) 0 Simulation & modelling software used to perform rigorous (& sometimes expensive) search procedure to find unique solution Here Aspen Plus, MATLAB & MS Excel used to optimise process parameters for biomass torrefaction
8 Torrefaction Modelling & Simulation Modelling of biomass torrefaction is a challenge no known exact chemical formula (Fig 3) Solution: non-stoichiometric modelling no knowledge of reaction mechanism required Setback: change in solid product not fully realized, only solid yield & torrefaction gas composition modelled Full analysis requires kinetic modelling Teh, Y. S. and Rangaiah, G. P. (2002) A study of equation-solving and Gibbs free energy minimization methods for phase equilibrium calculations, Chemical Engineering Research and Design, 80(7),
9 Hemicellulose: o C During Torrefaction Heat k ph, k pgases H 2 O, CO 2 + CO + Acetic acid + Formic acid + Methanol + Lactic acid + Furfural + Hydroxy acetone Cellulose: o C Heat k pc, k pgases 30 40% unreacted cellulose + H 2 O + CO 2 + CO + Acetic acid Lignin: o C Heat 40 50% Unreacted lignin + k pl, k H 2 O + CO 2 + CO + Methanol + pgases Furfural
10 1 x simulation in Aspen Plus Methodology 2 x simulations in MATLAB: MATLAB-SQP & MATLAB-LM 2 x simulations MS Excel: Excel-EOS & Excel-LM 11 different biomass at 27 different temperatures Conversion (mass Yield, MY) & Torrefaction gases (TG) composition investigated MY = m torr m raw m raw : mass of raw biomass after drying; m torr mass of torrefied biomass (biocoal) Nanou et al., (2016) Detailed mapping of the mass and energy balance of a continuous biomass torrefaction plant, Biomass and Bioenergy, 89,
11 Aspen plus Matlab-SQP Matlab-LM Excel- EOS Excel-LM Simulate drying Yes No No No No Simulate torrefaction Yes Yes Yes Yes Yes Property method Peng-Rob N/A N/A Peng-Rob N/A Proximate & Ultimate analysis Yes Yes Yes Yes Yes T & P Yes Yes Yes Yes Yes G f o No Yes Yes Yes Yes Biomass LHV Yes No No No No Molecular weights No Yes Yes Yes Yes Guess starting n i No Yes Yes Yes Yes Optimization function penalty function method fmincon: sqp algorithm lsqnonlin: trust-regionreflective algorithm MS Excel solver: GRG non-linear algorithm Aspen Plus (2000) Aspen Plus User Guide, Version 10.2, Aspen Technology, Inc, Cambridge, USA, Cutlip, M. B. and Shacham, M. (2008) Problem Solving in Chemical and Biochemical Engineering with POLYMATH, Excel, and MATLAB, Pearson Education, Massachusetts, USA. Kitchin, J. (2011) Finding equilibrium composition by direct minimization of Gibbs free energy on mole numbers, Accessed 18 September Lwin, Y. (2000) Chemical equilibrium by Gibbs energy minimization on spreadsheets, International Journal of Engineering Education, 16(4), Yaws, C. L. (2012) Yaws' Critical Property Data for Chemical Engineers and Chemists, Knovel E-books, Norwich, N.Y., Online version available at:

12 Aspen Plus

13 Matlab-SQP & Matlab-LM
14
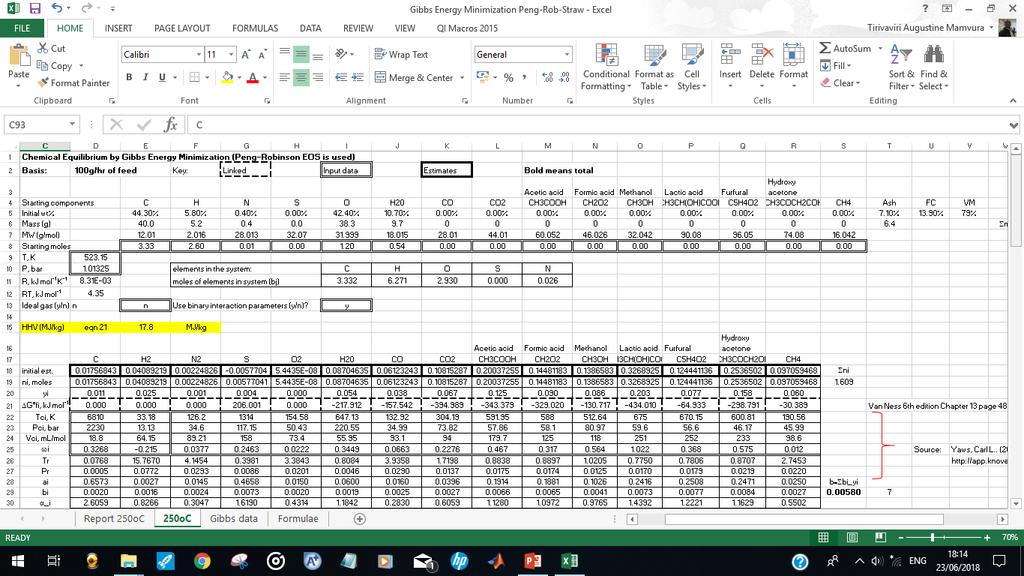
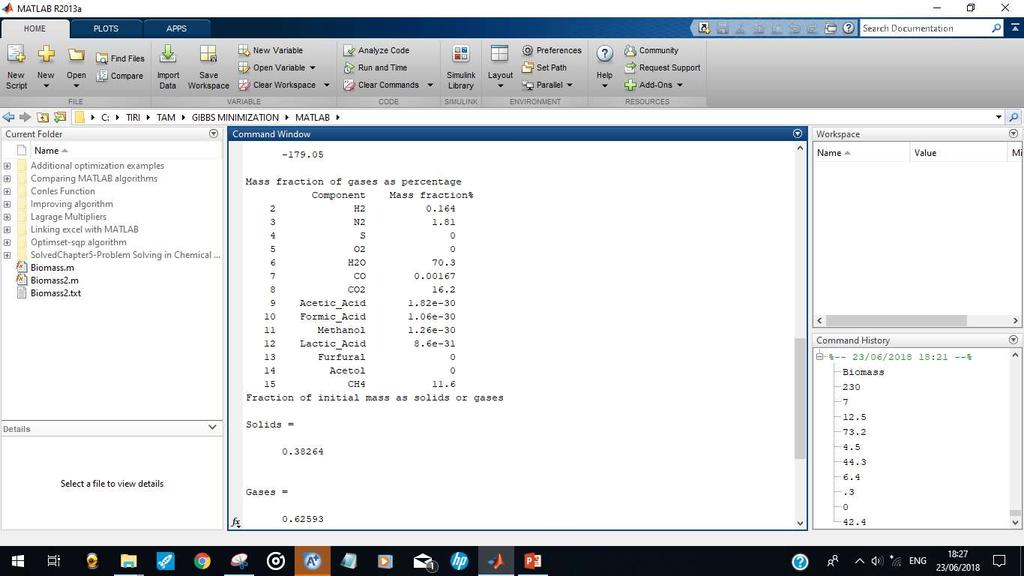
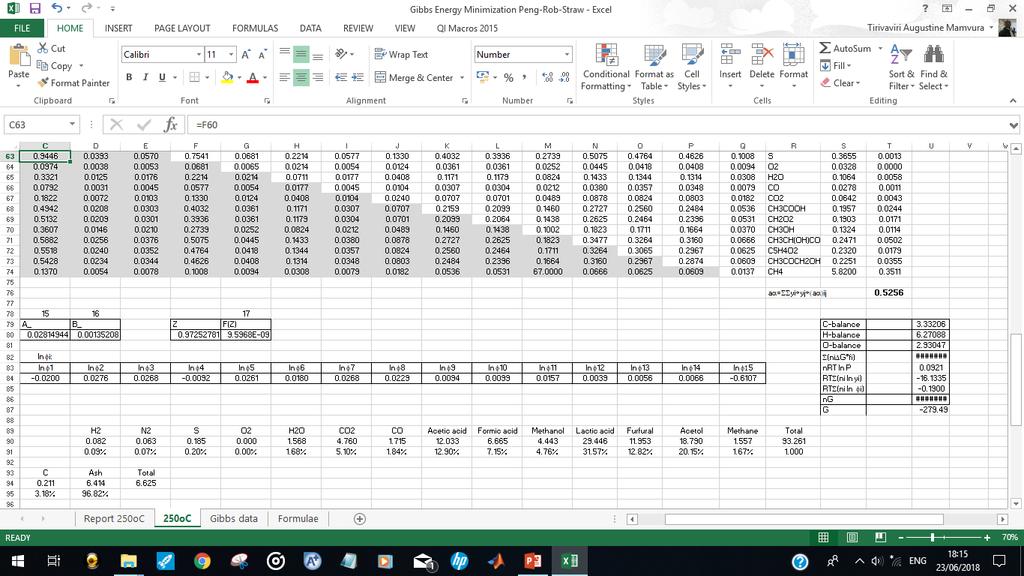
15 Excel-EOS
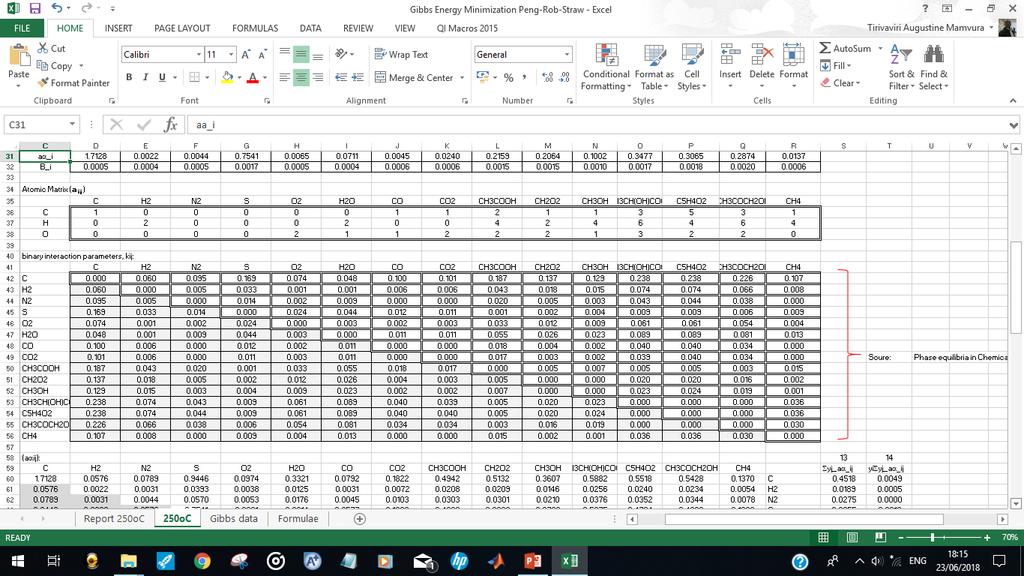
16
17
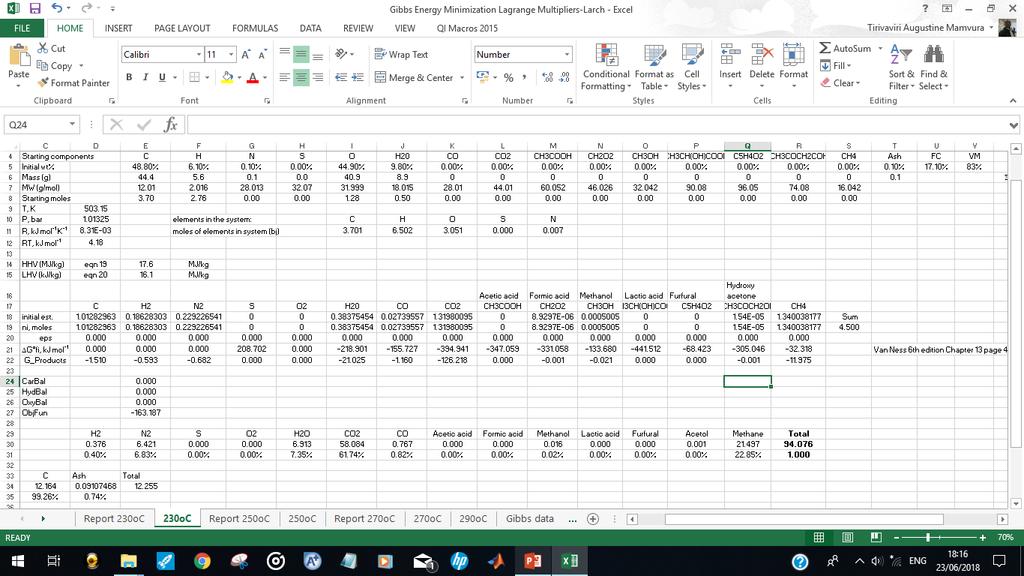
18 Excel-LM
19 Biomass & conditions used: Biomass H/C O/C Ash Conditions Larch T = 230, 250, 270, 290 Straw 0.13; ; ; 10.6 T = 250, 260 Willow T = 230, 250, 260, 270, 280, 300 Beech ; T = 220, 250, 280, 300 Poplar T = 280 Pine T = 297 Spruce T = 289 Bagasse T = 270 Road side grass T = 268 RDF T = 240, 260, 280 Trockenstabilat T = 240, 260, 280 Bates, R. B. and Ghoniem, A. F. (2012) Biomass torrefaction: Modeling of volatile and solid product evolution kinetics, Bioresource Technology, 124, Nocquet et al., (2014a) Volatile species release during torrefaction of wood and its macromolecular constituents: Part 1 Experimental study, Energy, 72, Nocquet et al., (2014b) Volatile species release during torrefaction of biomass and its macromolecular constituents: Part 2 Modeling study, Energy, 72, Prins, M. J. (2005) Thermodynamic analysis of biomass gasification and torrefaction, Eindhoven: Technische Universiteit Eindhoven DOI: /IR Prins et al., (2006) Torrefaction of wood Part 2. Analysis of products, Journal of Analytical and Applied Pyrolysis, 77(1), Verhoeff et al., (2011) Torrefaction technology for the production of solid bioenergy carriers from biomass and waste, Energy Research Centre of the Netherlands, ECN-E
")
 Aspen Plus; (ii) MATLAB-SQP; (iii) Excel-LM")
20 Success rate 100% 90% 80% 70% 60% 50% 40% 30% 20% 10% 0% Excel-LM Excel-EOS Matlab-LM Matlab-SQP Aspen Plus T (oc) Results: MY Aspen Plus Matlab-SQP Matlab-LM Excel-EOS Excel-LM MY predicted by (i) Aspen Plus; (ii) MATLAB-SQP; (iii) Excel-LM & (iv) Excel-LM

 Matlab-LM, (ii) Excel-EOS &")
21 Success rate 90% 80% 70% 60% 50% 40% 30% 20% 10% 0% Excel-LM Excel-EOS Matlab-LM Matlab-SQP Aspen Results: TG Component Aspen Matlab-SQP Matlab-LM Excel-EOS Excel-LM TG predicted by (i) Matlab-LM, (ii) Excel-EOS & (iii) Excel-LM
22 Use Excel-LM to predict mass yield & compare with Matlab- SQP Use MATLAB-LM to predict CO 2, CO & Acetol; supported by Excel-LM to predict H 2 O; & Excel-EOS to predict Acetic acid and Methanol 6 out of 8 components predicted within required tolerance Formic acid & Lactic acid difficult to predict with reasonable accuracy Use MATLAB-SQP to check H 2 O and CO 2 Use Aspen to check H 2 O
23 Validation of Model Biomass & conditions used: Type of biomass H/C O/C Ash Conditions Oil palm fiber T = 300; O 2 % = 0, 5, 10, 15 & 21 Coconut fiber Eucalyptus Cryptomeria japonica Rice Straw T = 200, 250, 300 o C Spruce T = 280 o C Pine Fir SPF Pine bark SPF shavings T = 240, 270, 300, 340 o C Chen et al., (2014) Non-oxidative and oxidative torrefaction characterization and SEM observations of fibrous and ligneous biomass, Applied Energy, 114, Peng et al., (2013) Torrefaction and densification of different species of softwood residues, Fuel, 111, Deng et al., (2009) Pretreatment of agricultural residues for co-gasification via torrefaction, Journal of Analytical and Applied Pyrolysis, 86(2),

24 Oxidative torrefaction MY Error 90% Oil palm fiber Coconut fiber Eucalyptus Cryptomeria japonica 80% 70% 60% 50% 40% 30% 20% 10% 0% 0% 5% 10% 15% 21% O2 conc Good prediction of MY at lower O 2 conc except for Eucalyptus
25 ln Ke ln Ke Activation energy for Straw 3.50 CO CO y = x R² = y = x R² = /T (1/K) /T (1/K) Component Actual E a (kj/kmol) Calculated E a (kj/kmol) Error CO % CO %

26 MY Error MY 16% 14% 12% 10% 8% Non-oxidative torrefaction Good prediction of MY within torrefaction temp range 6% 4% 2% 0% Spruce Pine Fir SPF Pine bark 80% 70% 60% SPF SHAVINGS 50% Good prediction of MY for different biomass 40% 30% 20% 10% 0% T (oc)
27 Biomass & conditions used: Type of biomass H/C O/C Ash Conditions Birch T = 230, 250, 280 o C Salix Miscanthus Wood pellets Straw pellets Pine Bagasse Lucern Ferro et al., (2004) Torrefaction of agricultural and forest residues, Cubasolar 2004, April 12-16, 2004, Guantánamo, Cuba, 8 pages. Pach et al., (2002) Torrefied biomass a substitute for wood and charcoal, 6 th Asia-Pacific International Symposium on Combustion and Energy Utilization, May 2002, Kuala Lumpur, 6 pages. Zanzi et al., (2004) Biomass torrefaction, 2nd World Conference on Biomass for Energy, Industry and Climate Protection conference, 4 pages.
28 MY Error 30% Birch Salix Miscanthus Wood pellets Straw pellets Pine Bagasse Lucern 25% 20% 15% 10% 5% 0% T (oc) Good prediction of MY within torrefaction temp range for different biomass types
29 CO Error CO 2 Error 30% 25% 20% 15% Good prediction of CO 2 within torrefaction temp range & different biomass types 70% 10% 60% 5% 50% 0% T (oc) 40% 30% Birch Salix Miscanthus Wood pellets Straw pellets Pine Bagasse Lucern 20% 10% Poor prediction of CO & CH 4 within torrefaction temp range & different biomass types 0% T (oc) Birch Salix Miscanthus Wood pellets Straw pellets Pine Bagasse Lucern
 Good prediction of MY")
 Optimization of palm kernel shell torrefaction to produce energy densified bio-coal, Energy Conversion and Management, 88, 1086")
30 MY mins MY Biomass & conditions used: Type of biomass H/C O/C Ash Conditions Palm kernel shells (PKS) T = 200, 250, 275, 300, 325, 350 o C 70% 60% 50% 70% 60% 50% 40% 30% 20% 10% 0% T (oc) Good prediction of MY within torrefaction temp range 40% 30% 20% 10% 0% Time (mins) Good prediction of MY up to 30 mins Asadullah et al., (2014) Optimization of palm kernel shell torrefaction to produce energy densified bio-coal, Energy Conversion and Management, 88,
31 Gas composition Error Biomass & conditions used: Biomass H/C O/C Ash Conditions PKS T = 200, 250, 270, 300 o C 100% 90% 80% 70% 60% 50% 40% 30% 20% 10% 0% T (oc) Within torrefaction temp range: Good prediction of CO 2 & CO except at 200 o C for CO Poor prediction of CH 4 & H 2 CO2 CO Li et al., (2014) Process simulation of co-firing torrefied biomass in a 220 MWe coal-fired power plant, Energy Conversion and Management, 84,
32 Conclusions Torrefaction difficult to model thermodynamically Thermodynamic model used as 1 st stage to have rough ideal of what to expect as model can predict mass yield & composition with reasonable accuracy Effect of change in proximate & ultimate analysis together with impact of temperature change studied with the given model Can be used for oxidative torrefaction & high-p torrefaction Can give plots of Conversion vs O/C or H/C or FC/VM to see effect of these parameters No running away from kinetic studies done on specific biomass
33 Recommendations Impact of particle size being considered Co-firing with coal for energy product is being considered


34 Acknowledgements Special thanks to the Department of Chemical Engineering, University of South Africa Any questions? Contact details