BIOINF/BENG/BIMM/CHEM/CSE 184: Computational Molecular Biology. Lecture 2: Microarray analysis
|
|
|
- Stanley Dennis
- 5 years ago
- Views:
Transcription
1 BIOINF/BENG/BIMM/CHEM/CSE 184: Computational Molecular Biology Lecture 2: Microarray analysis

2 Genome wide measurement of gene transcription using DNA microarray Bruce Alberts, et al., Molecular Biology of the Cell, 4 th Edition
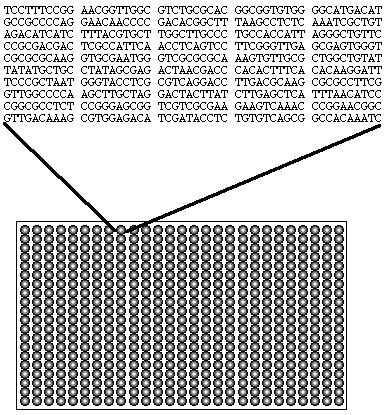
3 What is a microarray

4 A 2D array of DNA sequences from thousands of genes Each spot has many copies of same gene Allow mrnas from a sample to hybridize Measure number of hybridizations per spot
5 How to make a microarray Method 1: Printed Slides (Stanford) Use PCR to amplify a 1Kb portion of each gene Apply each sample on glass slide Method 2: DNA Chips (Affymetrix) Grow oligonucleotides (25bp) on glass Several words per gene (choose unique words) If we know the gene sequences, Can sample all genes in one experiment!

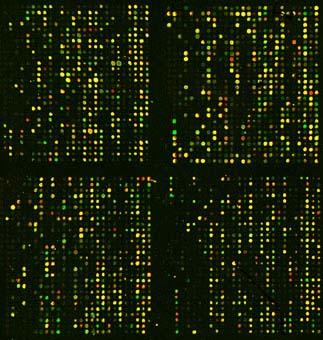
6 Sample Data
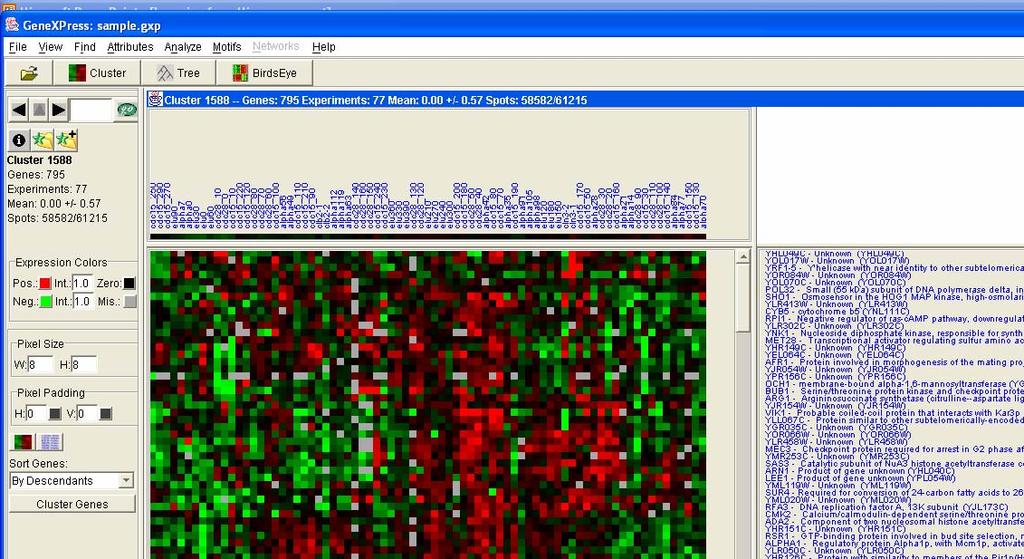
7 Visualization Tools
8 Goal of Microarray Experiments Measure level of gene expression across many different conditions: Expression Matrix M: {genes} {conditions}: M ij = gene i in condition j Deduce gene function Genes with similar function are expressed under similar conditions Deduce gene regulatory networks parts and connections- system level description of biology
9 Analysis of Microarray Data Clustering (unsupervised learning) Use the primary data to group together measurements, with no information from other sources. Classification (supervised learning) Use known groups of interest (from other sources) to learn the features associated with these groups in the primary data, and create rules for associating the data with the groups of interest.
10 Analysis of Microarray Data Clustering Idea: Groups of genes that share similar function have similar expression patterns Hierarchical clustering k-means / fuzzy k-means Bayesian approaches Principal Component Analysis
11 Analysis of Microarray Data Classification Idea: A cell can be in one of several states (Diseased vs. Healthy, Cancer X vs. Cancer Y vs. Normal) Can we train an algorithm to use the gene expression patterns to determine which state a cell is in? Support Vector Machines Decision Trees Neural Networks K-Nearest Neighbors


12 Why cluster? Place genes with similar expression profiles into clusters. What is the gene s function? Place experiments / samples with similar expression profiles into clusters. What is the expression profile of a particular disease or phenotype?
13 Eisen et al. (1998) PNAS 95: Cholesterol biosynthesis Cell cycle Immediate-early response Signaling and angiogenesis Wound healing and tissue remodeling
14 Hierarchical clustering Technically, Eisen uses average-link agglomerative hierarchical clustering. Similarity between genes is measured using a modified Pearson correlation coefficient. Simple implementation is easy; fast implementation is hard.
15 Expression matrix experiments genes A B C D
16 Pearson correlation ( ) = n Y Y n X X n Y X X Y Y X r i i i i i i i i i i i i i i i ,
17 Correlation matrix experiments genes genes A B C D genes


18 Find maximal correlation experiments genes genes A B C D genes 0.756


19 Merge and calculate correlations experiments genes genes A B CD genes A B C D As a side effect, the algorithm produces a dendrogram.
20 Hierarchical clustering Given: m n-element expression vectors Compute an m by m similarity matrix Iterate Find the maximal off-diagonal value Join the corresponding genes Average together their profiles The order in which the genes are joined determines the topology of a tree.
21 Similarity measures Pearson correlation Euclidean distance Others?
22 Clustering variants Agglomerative: start with all examples separate, then merge. Divisive: start with one big cluster, then split.
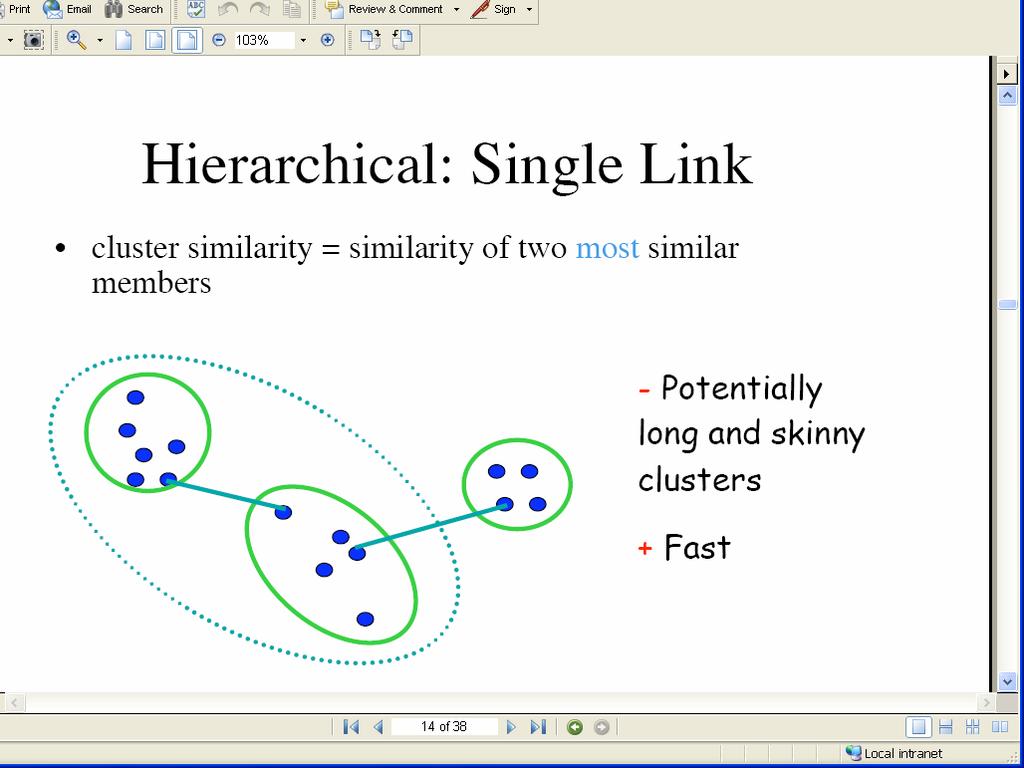
23 Linkage variants The similarity between two clusters is Single-link: The maximum of the pairwise similarities of the elements. Complete link: Same, but use minimum. Average link: The average of the pairwise similarities. Centroid link: The similarity of the centroids of the clusters.
24
25
26
27
28
29
30
31
32
33
34
35
36
37 Post hoc analysis Select clusters. Select ordering of genes for visualization. Determine cluster labels. Determine significance of clusters.

38 Eisen et al. (1998) PNAS 95: Cholesterol biosynthesis Cell cycle Immediate-early response Signaling and angiogenesis Wound healing and tissue remodeling
39 K-Means Clustering Algorithm Randomly initialize k cluster means Iterate: Assign each genes to the nearest cluster mean Recompute cluster means Stop when clustering converges
40 K-Means Algorithm Randomly Initialize Cluster Means
41 K-Means Algorithm Assign data points to nearest clusters
42 K-Means Algorithm Recalculate Cluster Means
43 K-Means Algorithm Recalculate Cluster Means
44 K-Means Algorithm Repeat
45 K-Means Algorithm Repeat
46 K-Means Algorithm Repeat until convergence
47
/3 = [19.7 21] ([1 3] + [4 2])/2 = [2.5 2.")
48 Randomly choose gene 3 and 5 as initial centers Assign genes to clusters: r 13 < r 15 => gene 1 in cluster A New center: ([22 21] + [19 20] + [18 22])/3 = [ ] ([1 3] + [4 2])/2 = [ ] Repeat Cluster B Cluster A 4 5
49 Yeast Cell Cycle date clustered by K-means (k=10)

50 Yeast Cell Cycle date clustered by hierarchical clustering
51 K-Means Clustering Algorithm Really fast How to select k? random or prior knowledge How to choose initial cluster centers? Randomly pick a gene then find the most dissimilar ones as other centers
52 Readings: 1. Eisen MB, Spellman PT, Brown PO, Botstein D Cluster analysis and display of genome-wide expression patterns. Proc Natl Acad Sci U S A Dec 8;95(25): Kim TH, Ren B. Genome-Wide Analysis of Protein-DNA Interactions. Annu Rev Genomics Hum Genet. 2006;7: