Distribution-Based Clustering: Using Ecology To Refine the Operational Taxonomic Unit
|
|
|
- Ella Ward
- 5 years ago
- Views:
Transcription
1 Distribution-Based Clustering: Using Ecology To Refine the Operational Taxonomic Unit The MIT Faculty has made this article openly available. Please share how this access benefits you. Your story matters. Citation As Published Publisher Preheim, S. P., A. R. Perrotta, A. M. Martin-Platero, A. Gupta, and E. J. Alm. Distribution-Based Clustering: Using Ecology To Refine the Operational Taxonomic Unit. Applied and Environmental Microbiology 79, no. 21 (August 23, 2013): American Society for Microbiology Version Author's final manuscript Accessed Fri Sep 21 19:12:35 EDT 2018 Citable Link Terms of Use Creative Commons Attribution-Noncommercial-Share Alike Detailed Terms
2 Page 1 of Distribution-Based Clustering: Using Ecology to Refine the Operational Taxonomic Unit 3 4 Running title: Using Ecology to Refine the Operational Taxonomic Unit Sarah P. Preheim 1#, Allison R. Perrotta 2, Antonio M. Martin-Platero 2, Anika Gupta 2 and Eric J. Alm 1# Department of Biological Engineering, Massachusetts Institute of Technology, Cambridge, MA; 2 Department of Civil and Environmental Engineering, Massachusetts Institute of Technology, Cambridge, MA # Corresponding author ejalm@mit.edu, spacocha@mit.edu 13
3 Page 2 of Abstract 16S ribosomal RNA (rrna) sequencing, commonly used to survey microbial communities, begins by grouping individual reads into operational taxonomic units (OTUs). There are two major challenges in calling OTUs: identifying bacterial population boundaries, and differentiating true diversity from sequencing errors. Current approaches to identify taxonomic groups or eliminate sequencing errors rely on sequence data alone, but both of these activities could be informed by the distribution of sequences across samples. Here we show that using the distribution of sequences across samples can help identify population boundaries even in noisy sequence data. The logic underlying our approach is that bacteria in different populations will often be highly correlated in their abundance across different samples. Conversely, 16S rrna sequences derived from the same population, whether slightly different copies in the same organism, variation of the 16S rrna gene within a population or sequences generated randomly in error, will have the same underlying distribution across sampled environments. We present a simple OTU calling algorithm ("distribution-based clustering") that uses both genetic distance and the distribution of sequences across samples, and demonstrate it is more accurate than other methods at grouping reads into OTUs in a mock community. Distribution-based clustering also performs well on environmental samples: it is sensitive enough to differentiate between OTUs that differ by a single base pair, yet predicts fewer overall OTUs than most other methods. This program can decrease the total number of OTUs with redundant information and improve the power of many down-stream analyses to describe biologically relevant trends.
4 Page 3 of Introduction Identifying meaningful OTUs is a significant bottleneck in the analysis of 16S rrna sequences from complex microbial communities, particularly for large datasets generated by next-generation sequencing. Spurious sequences created by PCR or sequencing errors can greatly inflate the total number of OTUs (i.e. alpha diversity) of a sample if not treated properly (1, 2). Although attempts have been made to address the problem of inflated alpha diversity from erroneous OTUs (1, 3-5), there have been few attempts to make OTUs that more accurately reflect ecologically cohesive bacterial populations. Most common methods of forming OTUs with next-generation sequencing use a single genetic cut-off for creating OTUs. The most common approach for calling OTUs is to cluster sequences into groups based on sequence identity or genetic distances alone [taxonomy-independent (6), taxonomy-unsupervised (7) or de novo (8) clustering]. Sequences are usually aligned using a pairwise or multiple alignment algorithm to create a distance matrix, and sequences are clustered based on a sequence identity cut-off. Many heuristics have been developed to decrease computational demand of OTU calling with varying degrees of accuracy, such as CD- HIT (9), UCLUST (8), DySC (10) and ESPRIT (11), among others. Another approach is to bin sequences into groups within a well- curated database of known sequences [taxonomy-dependent (6), phylotyping (12) or closed-reference (13) clustering]. Sequences that do not match the database are lost, even though they could represent important, novel organisms. To overcome this problem, novel sequences
5 Page 4 of can be retained as distinct clusters ("open-reference"), but this comes at the expense of speed and convenience. All of these commonly applied techniques rely on a genetic cut-off, typically >97% sequence identity, to inform OTU clustering. Although it is common to use a single sequence identity cut-off for clustering, more insight can be gained by adjusting the sequence clustering for individual taxonomic lineages (14, 15) or by using multiple genetic cut-offs for analysis (16, 17). Hunt et al (14) developed a program called AdaptML to infer population boundaries from the ecological information of isolated strains. Different populations were often identified within what would generally be considered one species. Using two closely related populations predicted from AdaptML, Shapiro et al (18) was able to investigate the early events of bacterial speciation. Koeppel et al (15) used a program called EcoSim to infer units of bacterial diversity by estimating evolutionary parameters, such as periodic selection and drift, derived from phylogenetic relationships of isolated strains. This method can detect more total populations than is supported by AdaptML using ecology alone (19). Both Youngblut et al (16) and Nemergut et al (17) repeated their analysis at various levels of clustering. Youngblut et al (16) found that using an inappropriate genetic cut-off would have changed their results. All of these studies demonstrate that more biological insight can be obtained from diversity studies when the clustering is done at different levels for different taxonomic lineages. Sequencing and PCR errors and chimeras are significant issues in nextgeneration 16S rrna libraries of microbial diversity. Inflated diversity estimates have been problematic with 454 pyrosequencing (1, 3-5, 20) and Illumina datasets
6 Page 5 of (21, 22). Many attempts have been made to reduce the impact of sequencing error on the estimate of total diversity from chimeric sequences and PCR and sequencing errors (3-5). With good quality filtering and strict error correcting software, many errors can be detected and removed from the dataset, reducing the effective error rate. However, these methods do not help in identifying how these "cleaned" sequences should be grouped into OTUs for down-stream analyses. We hypothesized that identifying the appropriate grouping for each taxonomic lineage and detecting many methodological errors can be accomplished using the distribution of sequences across samples. Bacteria in different populations will respond uniquely to variation in environmental conditions, resulting in a different distribution across sampled environments. This has been demonstrated for different taxa under a range of conditions (14, 15) and during disturbance (16). Conversely, 16S rrna sequences derived from the same population will have the same distribution across sampled environments, whether the sequences are from slightly different copies of the 16S rrna gene in the same organism, variation of the 16S rrna sequence within a population or sequences generated randomly in error. Thus, whether the underlying distribution is the same for ecological (i.e. same population of bacteria) or methodological reasons (i.e. sequencing error), they should be considered as a group and merged into one OTU. Our goal was to develop a simple algorithm using the distribution of 16S rrna sequences across samples to inform the creation of OTUs for large next generation sequencing studies. This method accommodates differences in the level of genetic differentiation across taxa and reduces the number of redundant OTUs
7 Page 6 of from sequences within the same population or created from sequencing error. To apply this method to 16S rrna surveys created from next-generation sequencing, we developed an algorithm that uses distribution information, the relative abundance of sequences within all samples and genetic distance to inform clustering. We compare this method ("distribution-based clustering" or DBC) to commonly applied closed-reference (i.e. phylotyping), open-reference (i.e. hybrid of phylotyping and de novo clustering) and de novo clustering methods using experimental mock community datasets. We test the accuracy and sensitivity of all clustering methods in identifying true input sequences, clustering sequencing and methodological errors with the input sequences they are derived from, and retaining the information contained in the distribution of sequences across samples. Distribution-based clustering reflects the true distribution of input templates or organisms more accurately than OTUs from methods using sequence identity alone. Finally, we compare the results of each clustering method on a set of unknown samples from a stratified lake, showing that it calls fewer OTUs than either the de novo or open-reference methods, yet is able to discriminate OTUs differing by a single base pair that show evidence of differing ecological roles. The source code, test data and user guide are freely available for download at Materials and Methods Previously generated mock community
8 Page 7 of We used an experimental mock dataset that was previously generated (23) to test our clustering method. Data was downloaded from the Supplemental Data page from the Gordon Lab website for the paper ( The quality filtered, denoised and chimera-free dataset was used for further analysis (Mock_nochimeras.fna) and all sequences were trimmed to 210 bases and the first 14 bases were removed. The input sequences (MockIsolatesV2.fna) and the input distributions from the Supplemental Material [Table S3 in Turnbaugh et al (23)] were also used in the analysis. Distribution information across samples was not included in the Mock_nochimeras.fna file, so it was derived from matching sequences in the cleaned dataset (Mock_cleaned.fna). The representative sequence for Providencia alcalifacien was mislabeled as Providencia rettgeri, as evident from distribution of this sequence across samples [which corresponded to the Providencia alcalifacien distribution (Fig. S1a)] and matched many Providencia alcalifacien strains in NCBI's nr database. The Providencia rettgeri sequence was replaced with the sequence from the dataset that had the correct corresponding distribution (Fig. S1b) and that matched many Providencia rettgeri sequences in NCBI's nr database Mock community generation The second mock community used for much of this analysis was created from an environmental clone library of 16S rrna sequences from a lake sample. DNA templates were 16S rrna sequences on purified, linearized plasmids (i.e.
9 Page 8 of environmental clones) as described in the Supplementary Information (SI) and approximately 800 base pairs were sequenced from the forward primer 27F (24). All clone sequences were submitted to GenBank (accession nos. KC KC192544). The input concentration of each DNA template was measured using the 2100 Bioanalyzer (Agilent Technologies Inc., Santa Clara, CA). DNA templates were mixed together into nine different mock communities ranging from simple (com1) with five DNA templates added to complex (com9) with 40 total DNA templates. DNA templates were mixed to create a range of final concentrations. Specific information about mock community composition can be found in Table S1 and S Library construction and sequencing Mock community libraries for paired-end Illumina sequencing were constructed using a two-step 16S rrna PCR amplicon approach diagramed in Figure S2. The first step primers (PE16S_V4_U515_F : 5' ACACG ACGCT CTTCC GATCT YRYRG TGCCA GCMGC CGCGG TAA- 3'; PE16S_V4_E786_R: 5'- CGGCA TTCCT GCTGA ACCGC TCTTC CGATC TGGAC TACHV GGGTW TCTAA T 3') contain primers U515F and E786R targeting the V4 region of the 16S rrna gene as described previously (25). Additionally, a complexity region in the forward primer (5'-YRYR-3') was added to aid the image processing software used detect distinct clusters during Illumina next generation sequencing. A second-step priming site is also present in both the forward (5'-ACACG ACGCT CTTCC GATCT-3') and reverse (5'-CGGCA TTCCT GCTGA ACCGC TCTTC CGATC T-3') first step primers. The second step primers incorporate the Illumina adapter sequences and a nine base pair barcode
10 Page 9 of for library recognition (PE-III-PCR-F : 5'- AATGA TACGG CGACC ACCGA GATCT ACACT CTTTC CCTAC ACGAC GCTCT TCCGA TCT 3'; PE-III-PCR : 5'- CAAGC AGAAG ACGGC ATACG AGATN NNNNN NNNCG GTCTC GGCAT TCCTG CTGAA CCGCT CTTCC GATCT 3' where N's indicate the presence of a unique barcode listed in Table S3). Real-time PCR before the first-step PCR reaction was done to ensure uniform amplification and avoid over-cycling all templates. Both real-time and first step PCR reactions were done similar to the manufacture's protocol for Phusion polymerase (New England Biolabs, Ipswich, MA) as described in SI. Samples were divided into four 25 μl replicate reactions during both first and second step cycling reactions and cleaned using Agencourt AMPure XP- PCR purification (Beckman Coulter, Brea, CA). Environmental libraries were created as previously described using the two-step primer skipping library protocol (26). Libraries were multiplexed together with other libraries not used in this study and sequenced using the paired-end approach on either the Genome Analyzer IIx or HiSeq 2000 Illumina sequencing machines at the BioMicro Center (MIT, Cambridge, MA). Environmental libraries were sequenced with 2 x 144 bases and mock community samples done with 2 x Pre-and post-clustering quality control Raw data was quality filtered using QIIME (version 1.3.0) (27) before processing with any clustering algorithm. The fastq files were processed using the split_library_fastq.py program of QIIME, truncating sequences when a base quality dropped below Phred quality score 17, which corresponds to a probability of error
11 Page 10 of around 0.02 (--last_bad_character Q -r 0). This quality filter stringency was chosen because it was found to result in the smallest Jensen-Shannon divergence from the true distribution using com9 (Fig. S3). Only sequences at least 99 bps long after quality filtering were retained (-min_per_read_length 99). All other parameters were default parameters. After quality filtering, the complexity region between the adapters and the primer (Fig. S2), along with the primer sequence were removed using the trim.seqs program in mothur (version v ) (28) and trimmed to 76 bp with a custom perl script ( All sequences not matching the first 15 bases of the primer were removed. After each clustering algorithm, representative sequences were picked using QIIME pick_rep_set.py, or a custom perl script ( using the most abundant sequence in the OTU as the representative. These were used to determine which OTUs were correct (i.e. matching an input sequence) or incorrect (i.e. did not match an input sequence). OTUs were removed if the representative sequence did not align to the part of the 16S rrna gene that was amplified (positions to of the silva alignment) with at least 76 bp. OTUs with less than 2 counts, or 11 counts were filtered out using QIIME's filter_otu_table.py (-c 2 or -c 11) for data in Table Closed-reference, open-reference and de novo clustering methods
12 Page 11 of QIIME was used to make closed-reference (i.e. phylotype) and openreference (i.e. hybrid of phylotyping and de novo approaches) OTUs as described above. Closed-, and open-reference clustering was done with the pick_reference_otus_through_otu_table.py flow from QIIME. Both methods used the 12_10 greengenes 97% reference OTU collection ( as the reference, UCLUST as the clustering algorithm (pick_otus:otu_picking_method uclust_ref) and new clusters were suppressed for closed-reference (pick_otus:suppress_new_clusters) but not for open-reference clustering. Example scripts are presented in the SI. mothur (v ) (28) was used to form de novo OTUs using average neighbor hierarchical clustering following some of the standard protocol for processing 16S rrna data ( Sequences were aligned to the Silva reference alignment and trimmed using the align.seqs and screen.seqs/filter.seqs commands, respectively. A distance matrix was created and used to cluster the sequences for the calling of final OTUs using dist.seqs and cluster commands, respectively. A list of commands can be found in the SI. The total number of OTUs was similar after chimera checking and lineage removal. USEARCH (v ; was used to create the USEARCH de novo OTU with custom perl scripts for pre- and post- processing as described in SI, which are available at Distribution-based clustering theory
13 Page 12 of Distribution-based clustering works by identifying bacterial populations at different levels of genetic differentiation for different taxonomic lineages by relying on the distribution of sequences across samples (i.e. the ecology) to determine where to draw population boundaries. Sequences that differ by only one base but that are found in different samples, suggesting they did not arise from the same underlying distribution, and should be considered separately in downstream analyses and put into different OTUs (Fig. 1a). Conversely, 16S rrna sequences drawn from the same underlying distribution across samples could be generated from differences between 16S rrna operons in the same organism, variation of the 16S rrna gene within a population or generated from random sequencing errors from a true sequence in the sample. These sequences should be grouped together and considered as a unit (Fig. 1b). A statistical test (i.e. chi-squared test) can be used to determine whether two sequences have a similar distribution across libraries. Applying these metrics can merge sequences derived from the same population (e.g. sequencing error or inter-operon variation) but retain ecologically distinct sequence types, even if they occur at the same genetic distance. It is important to note that the distribution-based approach will generate more spurious OTUs when sequencing errors are created in a non-random way across samples (i.e. higher error rates in a subset of libraries) Distribution-based clustering algorithm Distribution-based clustering requires two input files, an OTU-by-library matrix and a distance matrix. Both the distribution and abundance are obtained
14 Page 13 of from the OTU-by-library matrix. The distance matrix is important for ordering sequences according to increasing distance from the candidate sequences as described below. Any method can be used to create a distance matrix. We use FastTree (29) with the -makematrix option using both the aligned and unaligned sequences as inputs. This creates Jukes-Cantor corrected distances, and balances speed with accuracy. While this method works well on these mock communities, other distance matrices may be used as input, which may or may not improve accuracy OTUs are built in a step-wise manner (Fig. 2), as described below Step 1.) Choose a candidate sequence. This sequence will either be added to an existing OTU, or create a new OTU with itself as the representative depending on the results of the subsequent steps. Consider candidate sequences from the pool of existing unique sequences, in order of decreasing abundance. Abundance is defined as the number of times each sequence has been seen across all libraries. Step 2.) Choose an OTU from the pool of existing OTUs, sorted by decreasing distances of the representative sequence from the candidate. An OTU is evaluated if the representative sequence of the OTU is within the maximum genetic variation allowed to be within the same population (default -dist 0.1, the Jukes-Cantor corrected distance of 0.1). Jukes-Cantor corrected genetic distances were calculated using the -makematrix flag of FastTree (29), but other distance matrices can be used. The important information is the relative relationship of OTU representatives
15 Page 14 of to the candidate sequence. Additionally, genetic distance is determined from the minimum of aligned and unaligned distance, to reduce the impact of misalignment. If an OTU is found whose representative sequence is within the genetic distance cutoff, proceed to step 3. Otherwise, stop the search and go to step 6. Step 3.) Determine whether the representative sequence of the candidate OTU satisfies the abundance criteria. The abundance of the representative sequence must be greater than a user-defined abundance threshold, defined as a k-fold increase over the abundance of the candidate sequence. To remove sequencing errors, thus creating OTUs that represent true sequences (not populations), 10-fold abundance threshold is appropriate (-abund 10, default). This high abundance threshold restricts the total number of comparisons to OTUs with representatives that are much more abundant than the candidate sequences, which is common for sequences generated in error. To create OTUs that represent populations, a lower abundance threshold should be used, allowing for comparisons with candidate sequences that are at a similar abundance to the OTU representative (-abund 0). This low abundance threshold provides the possibility to merge sequences together that were generated from inter-operon variation or sequence variation with the population. If the representative sequence satisfies the abundance criteria, proceed to step 4. Otherwise, return to step 2 and choose another candidate OTU. Step 4.) Determine whether the candidate and representative sequences are distributed across samples in a similar manner. The candidate sequence will be merged into the OTU unless there is evidence that its distribution is different from the distribution of the representative. The distribution of candidate sequence (i.e.
16 Page 15 of observed distribution) and the OTU representative sequence (i.e. expected distribution) is similar if the chi-squared test results in a p-value above a userdefined cut-off (default = ). Sequences with low counts (e.g. singletons) will also result in high p-values. P-values are calculated using R statistical language (chisq.test) or simulated (chisq.test:simulate.p.value) when the expected is below 5 for more than 80% of the compared values. As an additional option, the Jensen- Shannon divergence (JSD) can be used. JSD is commonly used to measure the distance between two distributions and can be applied when the difference between distributions is statistically significant but distributed in a similar manner (i.e. the chi squared test is too sensitive). JSD will commonly merge distributions that look similar by eye but are found to have statistically significant differences. However, it cannot be used as the sole metric, as it performs poorly on distributions with low counts. If the distributions are different, the next OTU is evaluated (step 2). Otherwise, proceed to step 5. Step 5) Add the sequence to OTU. If the candidate sequence is distributed similarly to the representative sequence of the candidate OTU, the candidate sequence is added to the OTU and step 1 is repeated. Step 6.) Define OTU representatives. If none of the existing OTUs satisfy the criteria outlined above, an OTU is created with the candidate sequence as the representative of the OTU. This new OTU will not be merged with OTUs, but other sequences may be added. 332
17 Page 16 of Default parameters were chosen after varying each parameter in isolation and evaluated based on the total number of correct, merged and incorrect sequences OTUs (Fig. S4). Default parameters were used to cluster the mock community sequences generated in this study. The previously generated, cleaned dataset (23) was clustered with the following parameters: distance cut-off was 0.05, abundance criteria was 0 and the Jensen-Shannon divergence was used with a cutoff of Ideally, these parameters would be optimized for different platforms Complete vs. Parallel algorithm With the "complete" process, all sequences were analyzed together in the analysis. In the "parallel" process, sequences were pre-clustered with a heuristic approach (see below) and sequences in each cluster were processed separately, in parallel. However, sequences could be pre-clustered with different algorithms (e.g. nearest-neighbor single linkage clustering), as long as the number of sequences that are grouped with their nearest neighbor is maximized. Data was pre-clustered with UCLUST into clusters for the new mock and previously generated mock communities respectively using a progressive clustering algorithm ( Clustering was accomplished in several iterations by gradually relaxing the cutoff threshold. Sequences were first sorted by abundance and clustered with the UCLUST algorithm at 0.98 (1 bp difference is already below 0.99). The seeds of these clusters were sorted by abundance and clustered again at This was repeated to the lowest threshold
18 Page 17 of value of 0.9 for the mock generated in this paper, and 0.95 for the Turnbaugh mock community. The resulting files were consolidated to make a list of clustered sequences. The distribution-based algorithm is used in parallel on sequences in these clusters. If the abundance of all members of the group is lower than the abundance threshold, the cluster remains intact (i.e. low count cluster with no information). However, the cluster is divided when two OTU representative sequences are identified Assessment of accuracy We assessed how well the resulting OTUs represent the true input sequences. We expect sequences originating from the same input organism or template to be clustered together and sequences originating from different input organisms or templates to remain distinct, even with as little as one base pair of difference between them. The corresponding input organisms or template for each resulting sequence was determined as the smallest distance (minimum of aligned and unaligned distances) to an input sequence for each unique sequence. Sequences were weighted by abundance, so more abundant sequences result in more total counts. To assess the accuracy of each method against our criteria, we used two measures of a test's accuracy, F-score and MCC. True positives (TP) are defined as a pair of sequences in the same OTU originating from the same input organism or template. False positives (FP) are defined as a pair of sequences in different OTUs originating from the same input. True negatives (TN) are defined as a pair of
19 Page 18 of sequences in different OTUs originating from different inputs. False negatives (FN) are defined as a pair of sequences in different OTUs originating from the same input reference clustering). These were calculated with various scripts using the resulting OTU list from each algorithm along with a mapping file indicating the input (determined as above) and a translation file mapping reads to libraries or if either of a pair of reads was not assigned into an OTU (only affecting closed- ( clustering/tree/master/confusion_matrix_calc). The F-score was calculated as: f - score = 2 precision recall precision + recall where precision is defined as: precision = TP TP + FP and recall is defined as: recall = TP TP + FN Matthew's correlation coefficient (MCC): 394 MCC = TP TN - FP FN (TP+ FN)(TP + FP)(TN + FP)(TN + FN) as previously described (30) with the definition of TP, FP, TN and FN described above Comparison with the input community
20 Page 19 of To compare the resulting OTU by library matrix with the expected distribution [Table S3 of Turnbaugh et al. (23) and Table S2 in SI], we used the JSD from mock community com9 and Uneven2 for comparison. OTUs were paired to an input sequence through the sequence representative (i.e. the most abundant sequence in the OTU) with a match to an input sequence or by the most abundant OTU with a best blast hit to the input organism. The total abundance of reads mapping to each OTU from com9 or Uneven2 was compared to the concentration of each corresponding mock community member (Fig. 3c and 4c). JSD was calculated using dist_mat (metric='js') using PySurvey ( Results Distribution-based clustering goals Our goal was to develop a clustering algorithm that merges sequences derived from the same input organism or template but keep separate those originating from different input organisms or templates (Fig. 1). Sequences derived from the same input could represent micro-diversity from inter-operon variation, closely related organisms within the community with highly similar functions and the same fitness across sampled environments, or sequencing error. However, we also wanted an algorithm that has the sensitivity to detect different populations, even if the similarity between sequences in different populations is greater than what is typically used for species designations (i.e. above 97% sequence identity), or within the range of sequencing error. We compare the resulting method using two
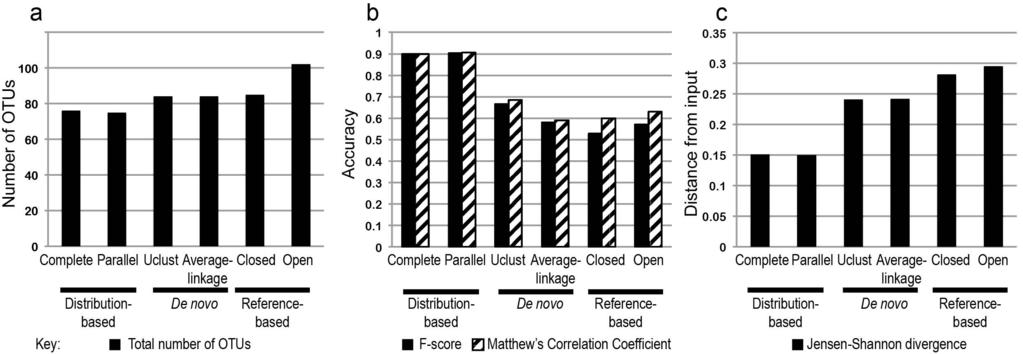
21 Page 20 of different experimental mock communities to demonstrate how this algorithm compares to more commonly applied clustering methods based on sequence identity alone Distribution-based clustering more accurately clusters sequences created in error Distribution-based clustering creates OTUs that more accurately represent the input sequences based on the total number of OTUs, how sequences are grouped together into OTUs and distribution of OTUs across samples. 38 mock template sequences remain in distinct OTUs in both distribution-based and open-reference clustering, resulting in the largest number of OTUs containing at least one of the input sequences ("Correct"; Fig. 3a). De novo clustering has fewer correct OTUs because some sequences are merged into the same OTU. Closed-reference clustering retains fewer correct OTUs because some of the community members do not match the database with sufficient identity. Distribution-based clustering predicts the lowest number of spurious, incorrect OTUs ("Incorrect"; Fig. 3a). Open-reference clustering predicts the largest number of incorrect OTUs of all methods. Distribution-based clustering also groups together reads originating from the same template sequence more accurately. A typical benchmark of OTU accuracy is whether the algorithms cluster sequences that are within a specific genetic distance or sequence identity threshold (12). However, our benchmark is whether reads that originate from the same mock template are grouped together and reads originating from different templates are kept apart. The F-score and Matthew's correlation coefficient are both measures of classification accuracy that have been used
22 Page 21 of previously to benchmark OTU definitions (12). By either metric, distribution-based clustering out-performs all of the other methods at accurately discriminating input sequences (Fig. 3b). De novo clustering predicts more true positives than distribution-based clustering, but also predicts about 10 times more false positives than distribution-based clustering (Table 1) because it tends to over-cluster the closely related true sequences. Closed-reference clustering has the lowest scores due to a large number of false negatives for sequences that do not match the database. Distribution-based clustering produces a resulting community that is more similar to the input community in both total number and relative abundance of OTUs. The number of reads mapping to each OTU from one high quality library (com9) was compared to the input sequences using the Jensen-Shannon divergence (Fig. 3c). Distribution-based clustering (both complete and parallel applications- see Complete vs. Parallel algorithm in Materials and Methods for details) had the smallest Jensen-Shannon divergence from the input community of all clustering algorithms. Both de novo algorithms result in the largest divergence from the true distribution of all clustering methods because some input sequences are merged together. Closed-reference clustering discarded many input sequences that did not match the database, resulting in a larger calculated divergence from the input community. Open-reference clustering does not merge as many input sequences as de novo clustering and does not discard any true sequences like closed-reference clustering, but was still less accurate than distribution-based clustering. 467
23 Page 22 of Filtering out low abundance OTUs Low abundance OTUs are often discarded because they do not contain much information. We have also compared the total number of OTUs remaining after filtering to various levels (Table 2). After filtering out singletons (i.e. OTUs with less than 2 counts), distribution-based clustering still predicts many fewer OTUs than any other method, for the mock community, and fewer than de novo and openreference in the environmental sample. However, the total number of OTUs is similar after filtering out OTUs with 10 or fewer counts DBC more accurately groups sequences from the same organism The mock community generated by Turnbaugh et al (23) provides the opportunity to highlight the power of this approach at grouping together sequences originating from the same organism, while still keeping the power to resolve closely related organisms that have a unique distribution across samples. The input of this mock community came from DNA extracted from 67 organisms. The data in this analysis was previously cleaned, denoised and chimeras were removed (23). Thus, the following results describe how well this method does at clustering sequences in the absence of sequence error. Distribution-based clustering is better than other methods at merging sequences together that originated from the same input organism and accurately representing the input distribution. The complete and parallel versions of distribution-based clustering predicted 76 and 75 total OTUs, respectively, the fewest total number of OTUs of all clustering methods (Fig. 4a). It also more
24 Page 23 of accurately grouped together reads that originated from the same organism (Fig. 4b) and more accurately captured the distribution of the input sequences (Fig. 4c). Closed- and open-reference clustering never grouped together sequences that originated from different organisms (i.e. no false positives), but did not merge as many sequences that originated from the same organism in the same OTUs (i.e. fewer true positives), not clustering together enough sequences (i.e. underclustering). Both de novo approaches tended to merge sequences originating from closely related organisms (i.e. more false positives), but also more often grouped together sequences from the same organism (i.e. more true positives), grouping together too many sequence (i.e. over-clustering). These results highlight the drawback of using genetic information alone, which will necessarily either overcluster or under-cluster sequences, as depicted in the example in Fig 1c. Using the distribution of sequences across samples is the only way to cluster more sequences by their input when the level of genetic variation is different across taxonomic lineages Comparison with unknown samples Along with comparisons between clustering methods on a simple, welldefined mock community, we also applied all clustering methods to an environmental sample set. This sample set was generated from 25 samples from a depth profile of a stratified lake sample (Mystic Lake, Winchester, MA), where different depths corresponded to distinct biogeochemical conditions. We generated two datasets for this analysis. First, we made an Illumina 16S rrna library from
25 Page 24 of DNA extracted from water collected approximately every meter from the surface to the bottom (22 meters depth). Additionally, we generated Sanger-sequencing based 16S rrna libraries from two depths (6 and 21 meters). The distribution of the Illumina library sequences was used in the clustering method and Illumina sequences that match different Sanger clones were used as a control comparison, since these sequences were observed independently in the Illumina and Sanger datasets Closed-reference clustering over-filters environmental data The closed-reference clustering method predicts the fewest number of OTUs of all methods (Fig. 5a). Although the total number of OTUs in the sample is unknown, the Illumina sequences that match the Sanger library mock community can be used to compare clustering methods on the unknown sample. 89 Illumina sequences match one or more of the Sanger sequences. As we saw with the simple mock community, which was generated from clones of these sequences, the closedreference method discards many sequences that are missing representative sequences in the database. Closed-reference clustering discards 15 of the 89 sequences with more than 1000 counts across all libraries. The most abundant discarded sequence is classified as Cyanobacteria with a distribution that corresponds to a peak in oxygen below the thermocline. This suggests that the very low number of OTUs predicted by the closed-reference method is an underestimate and that this method excluded biologically interesting information. 536
26 Page 25 of Over-clustered environmental data De novo, open-, and closed- reference clustering over-clustered the data, resulting in skewed environmental distributions for many OTUs as compared with distribution-based clustering. Merged sequences with different distributions resulted low correlations between the resulting OTU and the matching Sanger clone for different clustering methods because merged sequences had very distinct profiles (such as in Fig. 5b). The distribution of five OTUs formed by de novo (USEARCH) clustering, resulting in correlations below 0.9 with the matching Sanger sequence (Table S4). Three OTUs formed by open- and closed-reference clustering algorithms had low correlations with the matching Sanger sequence (Table S4). However, the correlation of the matching Sanger sequence with distribution-based clustering OTUs was high in all cases. This suggests that other clustering methods are more likely to over cluster sequences with distinct environmental distributions, as compared to distribution-based clustering Distribution-based clustering is accurate and flexible The distribution based clustering method predicted a low number of OTUs yet retained distinct profiles for highly similar sequences. Distribution-based clustering predicted about 9,000 fewer OTUs than both de novo open-reference (Fig 5a). When filtering out singletons (i.e. OTUs with 1 count), distribution-based clustering still predicted a few thousand fewer total OTUs than either de novo or open-reference clustering. However, after filtering out OTUs with less than 10 counts across all libraries, the difference was less obvious (Table 2). Distribution-
27 Page 26 of based clustering was also sensitive enough to keep closely related sequences with distinct distributions in separate OTUs (Fig. 5b). Distribution-based clustering can function to identify all likely sequences in the sample (i.e. remove sequencing error) or be used to group all sequences together that are within a population (i.e. ecologically relevant populations). To eliminate sequencing error, the representative sequence of the OTU must be at least 10-fold more abundant than other sequences in the OTU, since sequences created in error are typically less than 10% of the abundance original sequence. This is comparable to the analysis done with the mock community generated from 16S plasmid templates (Fig. 3). Under these conditions, sequences in Fig. 5c would remain as distinct OTUs. However, it may be redundant to consider each sequence as a separate OTU because they are genetically similar and distributed in a similar manner. Thus, the distribution-based algorithm can also be adjusted to merge sequences in Fig. 5c by using no abundance cut-off and comparing the sequence distributions with JSD (see Materials and Methods for details). This is comparable to the analysis done on the mock community generated from genomic DNA extracted from different organisms (Fig. 4). Under the adjusted parameters, distributionbased clustering predicts 11,871 OTUs total, and created three OTUs with more than one sequence matching Sanger clones, including the sequences in Fig. 5c Run-time of each clustering algorithm The total computational time for distribution-based clustering is much longer than any of the other clustering methods. Table 3 shows typical run times for
28 Page 27 of approximately 500,000 total reads (5,489 unique sequences) in the mock and 7.5 million reads (120,601 unique sequences). Only the parallelized distribution-based clustering used multiple processors to complete, and run time of other methods could be improved even further by using multiple processors. However, it is clear that there is a significant difference in speed between distribution-based clustering and the other methods Issues affecting sequence and distribution accuracy The sequences and distribution of OTUs across libraries should represent the true distribution as accurately as possible. Recommendations made from previous studies were followed during library construction to reduce PCR amplification biases, including reducing the cycle number and pooling replicate PCR reactions (31, 32). While these measures help, the resulting sequences and distributions across libraries is primarily affected by two things: mismatches between the primer and template sequences and sequence-specific errors of the Illumina sequencing platform from a poor quality run Sequence-specific sequencing errors The distribution-based clustering method is sensitive to errors that are generated in a non-random way across samples. Since the algorithm assumes that differences in the distribution of sequences across samples represent important information, this assumption is invalid when differences are due to methodological errors. In our analysis, the most obvious cause of non-random errors results from
29 Page 28 of combining sequencing data from different runs with varying quality scores (Fig. S5), as certain errors were generated at a higher frequency on one flow-cell than the other (Fig. S6a). This causes the erroneous sequences to have a significantly different distribution than the sequences they were derived from (Fig. S6b), and are thus retained as distinct OTUs. As expected, distribution-based clustering performs very well on simulated data when the error rate is constant across libraries, but is substantially worse when error rates are non-constant (Table S5). Thus, distribution-based clustering would be even more accurate had all of the samples been sequenced on the same flow-cell. Sequence specific errors are obvious when a stringent quality filter is applied to a low-quality sequencing lane. After removing templates with primer site mismatches, Fig. 6 shows little decrease in the correlation between the observed and expected frequencies for a good quality sequencing run after quality filtering (Fig. 6a and 6b). In a library from the poor quality lane (Flow 2 lane 1, com4-com6), the correlation with the input concentration is high for unfiltered data (R 2 = ; Fig. 6c). However, the correlation between the input concentration and the resulting sequences breaks down with more stringent quality filtering (R 2 = ; Fig. 6d). This is likely due to sequence specific errors, a problem identified previously with Illumina sequencing technology (33-35). When using data from poor quality sequencing runs, OTUs from more stringent quality filtering represent true sequences, but the relative abundances may be highly skewed Discussion
30 Page 29 of We present a novel method of calling OTUs that uses the ecology of the organisms they represent to inform the clustering. Typically, only genetic information is considered when forming OTUs. Incorporating information such as abundance and distribution into the OTU formation process creates OTUs that more accurately cluster sequences by the template or organism of origin and improves the information content of the resulting OTUs. The gross trends in the data are similar, regardless of clustering algorithms. Principal coordinates analysis (PCoA) plots, which identify the most obvious differences between samples, were similar across clustering methods (Fig. S7 and S8). PCoA are particularly effective when the variable of interest (e.g. depth, disease state) is associated with major changes in community structure, but are less effective at detecting subtle variations in community structure. Furthermore, they cannot pinpoint the specific sequences that drive these associations. Other approaches, such as univariate tests including the Mann-Whitney U test and Fisher's exact test, and statistical learning techniques such as random forest classification can test for associations between bacterial species abundance and environmental metadata (36). Optimizing the clustering algorithm to detect such associations will increase the chances of gaining important biological insight. Thus, accurate OTU formation may not be as critical when trends in the data can be discerned at higher taxonomic levels, such as the ratio of Bacteroidetes to Firmicutes in obesity (37). However, differences between closely related organisms are crucial for identifying evolutionary and ecological mechanisms (18). In such cases, distribution-based
31 Page 30 of clustering may be one of only a few tools that can be used to distinguish the signal from the noise of sequencing errors. Run time is currently a severe limitation to implementing distribution-based clustering on very large datasets. Although many improvements can be made to the algorithm itself to increase the speed of the program (likely with lower accuracy), any implementation will likely be more computationally intensive than other methods since it involves processing additional information. Steps can be taken to reduce total runtime, such as increasing the abundance skew (e.g. 100-fold more abundant representative sequences) or decreasing the total distance cut-off allowed for forming clusters (e.g. cutoff=0.05), or filtering out low abundance sequences (e.g. filter out singletons). All of these steps decrease the total number of pairwise comparisons and reduce runtime. However, these will also decrease accuracy of the algorithm at removing incorrect OTUs (Fig. S4). There are some cases when the distribution-based clustering method should be used with caution. Distribution-based clustering predicts the most accurate OTUs when sequences are distributed in an ecologically meaningful way across samples, as in the mock community or in a stratified lake. However, methodological issues creating non-random errors across samples (e.g. different error rates across sequencing cells or runs) will increase the number of erroneous sequences that distribution-based clustering will keep as distinct OTUs (Table S5). However, distribution-based clustering still creates the most accurate OTUs of all clustering methods, even with the methodological errors found in this analysis. Users should
32 Page 31 of also consider whether grouping sequences using a statistical test of similarity will impact the statistics of their downstream analyses. Although no method formed OTUs that were as accurate as the distributionbased method with these mock communities, there are situations when different methods might be a more appropriate choice. Closed-reference clustering has the advantage of speed and convenience, especially for downstream processing because information about the reference sequences can be pre-computed (e.g. phylogenetic trees, taxonomic information). De novo clustering may be a good choice for higher taxonomic level analyses, as over-clustering species should not affect phylum-level changes across samples, especially when the total number of predicted OTUs can affect the results. Open-reference clustering is less discriminating and tends to grossly over-estimate the number of OTUs. However, it seems to a good alternative when looking for trends between closely related organisms, especially if low abundance OTUs can be filtered out. When applied appropriately, each of the different clustering methods analyzed here can facilitate the discovery of important trends in 16S rrna library sequence data. The introduction of the distribution-based clustering method gives researchers an additional tool that allows distinct OTUs to be retained even if they differ at a single base pair in a background of high micro-diversity or sequencing error Acknowledgements
33 Page 32 of This work conducted by ENIGMA- Ecosystems and Networks Integrated with Genes and Molecular Assemblies ( a Scientific Focus Area Program at Lawrence Berkeley National Laboratory, was supported by the Office of Science, Office of Biological and Environmental Research, of the U. S. Department of Energy under Contract No. DE-AC02-05CH We thank Stuart Levin and the support staff at MIT's BioMicro Center for their help with Illumina sequencing. We thank John Casey for his help improving the clarity of the manuscript References 1. Quince C, Lanzen A, Curtis TP, Davenport RJ, Hall N, Head IM, Read LF, Sloan WT Accurate determination of microbial diversity from 454 pyrosequencing data. Nat Methods 6: Huse SM, Welch DM, Morrison HG, Sogin ML Ironing out the wrinkles in the rare biosphere through improved OTU clustering. Environmental Microbiology 12: Quince C, Lanzen A, Davenport RJ, Turnbaugh PJ Removing Noise From Pyrosequenced Amplicons. BMC Bioinformatics Schloss PD, Gevers D, Westcott SL Reducing the Effects of PCR Amplification and Sequencing Artifacts on 16S rrna-based Studies. Plos One Edgar RC, Haas BJ, Clemente JC, Quince C, Knight R UCHIME improves sensitivity and speed of chimera detection. Bioinformatics 27: Sun Y, Cai Y, Huse SM, Knight R, Farmerie WG, Wang X, Mai V A large-scale benchmark study of existing algorithms for taxonomyindependent microbial community analysis. Brief Bioinform 13: Sul WJ, Cole JR, Jesus Eda C, Wang Q, Farris RJ, Fish JA, Tiedje JM Bacterial community comparisons by taxonomy-supervised analysis independent of sequence alignment and clustering. Proceedings of the National Academy of Sciences of the United States of America 108: Edgar RC Search and clustering orders of magnitude faster than BLAST. Bioinformatics 26: Huang Y, Niu B, Gao Y, Fu L, Li W CD-HIT Suite: a web server for clustering and comparing biological sequences. Bioinformatics 26: Zheng Z, Kramer S, Schmidt B DySC: Software for Greedy Clustering of 16S rrna Reads. Bioinformatics.
34 Page 33 of Sun Y, Cai Y, Liu L, Yu F, Farrell ML, McKendree W, Farmerie W ESPRIT: estimating species richness using large collections of 16S rrna pyrosequences. Nucleic Acids Res 37:e Schloss PD, Westcott SL Assessing and improving methods used in operational taxonomic unit-based approaches for 16S rrna gene sequence analysis. Applied and Environmental Microbiology 77: Caporaso JG, Lauber CL, Walters WA, Berg-Lyons D, Huntley J, Fierer N, Owens SM, Betley J, Fraser L, Bauer M, Gormley N, Gilbert JA, Smith G, Knight R Ultra-high-throughput microbial community analysis on the Illumina HiSeq and MiSeq platforms. The ISME journal 6: Hunt DE, David LA, Gevers D, Preheim SP, Alm EJ, Polz MF Resource partitioning and sympatric differentiation among closely related bacterioplankton. Science 320: Koeppel A, Perry EB, Sikorski J, Krizanc D, Warner A, Ward DM, Rooney AP, Brambilla E, Connor N, Ratcliff RM, Nevo E, Cohan FM Identifying the fundamental units of bacterial diversity: A paradigm shift to incorporate ecology into bacterial systematics. Proceedings of the National Academy of Sciences 105: Youngblut ND, Shade A, Read JS, McMahon KD, Whitaker RJ Lineage-Specific Responses of Microbial Communities to Environmental Change. Applied and Environmental Microbiology 79: Nemergut DR, Costello EK, Hamady M, Lozupone C, Jiang L, Schmidt SK, Fierer N, Townsend AR, Cleveland CC, Stanish L, Knight R Global patterns in the biogeography of bacterial taxa. Environmental Microbiology 13: Shapiro BJ, Friedman J, Cordero OX, Preheim SP, Timberlake SC, Szabo G, Polz MF, Alm EJ Population genomics of early events in the ecological differentiation of bacteria. Science 336: Connor N, Sikorski J, Rooney AP, Kopac S, Koeppel AF, Burger A, Cole SG, Perry EB, Krizanc D, Field NC, Slaton M, Cohan FM Ecology of Speciation in the Genus Bacillus. Applied and Environmental Microbiology 76: Kunin V, Engelbrektson A, Ochman H, Hugenholtz P Wrinkles in the rare biosphere: pyrosequencing errors can lead to artificial inflation of diversity estimates. Environmental Microbiology 12: Degnan PH, Ochman H Illumina-based analysis of microbial community diversity. Isme J 6: Bokulich NA, Subramanian S, Faith JJ, Gevers D, Gordon JI, Knight R, Mills DA, Caporaso JG Quality-filtering vastly improves diversity estimates from Illumina amplicon sequencing. Nat Methods 10:57-U Turnbaugh PJ, Quince C, Faith JJ, McHardy AC, Yatsunenko T, Niazi F, Affourtit J, Egholm M, Henrissat B, Knight R, Gordon JI Organismal, genetic, and transcriptional variation in the deeply sequenced gut microbiomes of identical twins. Proceedings of the National Academy of Sciences of the United States of America 107:
35 Page 34 of Lane DJ S/23S rrna sequencing, p In Stackebrandt E, Goodfellow M (ed.), Nucleic Acid Techniuqes in Bacterial Systemantics. Wiley & Sons, Chinchester. 25. Knight R, Caporaso JG, Lauber CL, Walters WA, Berg-Lyons D, Lozupone CA, Turnbaugh PJ, Fierer N Global patterns of 16S rrna diversity at a depth of millions of sequences per sample. Proceedings of the National Academy of Sciences of the United States of America 108: Blackburn MC Development of New Tools and Applications for High- Throughput Sequencing of Microbiomes in Environmental or Clinical Samples. Master of Science in Chemical Engineering. Massachusetts Institute of Technology, Cambridge, MA. 27. Caporaso JG, Kuczynski J, Stombaugh J, Bittinger K, Bushman FD, Costello EK, Fierer N, Pena AG, Goodrich JK, Gordon JI, Huttley GA, Kelley ST, Knights D, Koenig JE, Ley RE, Lozupone CA, McDonald D, Muegge BD, Pirrung M, Reeder J, Sevinsky JR, Turnbaugh PJ, Walters WA, Widmann J, Yatsunenko T, Zaneveld J, Knight R QIIME allows analysis of high-throughput community sequencing data. Nat Methods 7: Schloss PD, Westcott SL, Ryabin T, Hall JR, Hartmann M, Hollister EB, Lesniewski RA, Oakley BB, Parks DH, Robinson CJ, Sahl JW, Stres B, Thallinger GG, Van Horn DJ, Weber CF Introducing mothur: opensource, platform-independent, community-supported software for describing and comparing microbial communities. Applied and Environmental Microbiology 75: Price MN, Dehal PS, Arkin AP FastTree 2-Approximately Maximum- Likelihood Trees for Large Alignments. Plos One Baldi P, Brunak S, Chauvin Y, Andersen CAF, Nielsen H Assessing the accuracy of prediction algorithms for classification: an overview. Bioinformatics 16: Polz MF, Cavanaugh CM Bias in template-to-product ratios in multitemplate PCR. Applied and Environmental Microbiology 64: Lahr DJ, Katz LA Reducing the impact of PCR-mediated recombination in molecular evolution and environmental studies using a new-generation high-fidelity DNA polymerase. Biotechniques 47: Dohm JC, Lottaz C, Borodina T, Himmelbauer H Substantial biases in ultra-short read data sets from high-throughput DNA sequencing. Nucleic Acids Res 36:e Nakamura K, Oshima T, Morimoto T, Ikeda S, Yoshikawa H, Shiwa Y, Ishikawa S, Linak MC, Hirai A, Takahashi H, Altaf-Ul-Amin M, Ogasawara N, Kanaya S Sequence-specific error profile of Illumina sequencers. Nucleic Acids Res 39:e Minoche AE, Dohm JC, Himmelbauer H Evaluation of genomic highthroughput sequencing data generated on Illumina HiSeq and genome analyzer systems. Genome Biology 12:R Papa E, Docktor M, Smillie C, Weber S, Preheim SP, Gevers D, Giannoukos G, Ciulla D, Tabbaa D, Ingram J, Schauer DB, Ward DV,
36 Page 35 of Korzenik JR, Xavier RJ, Bousvaros A, Alm EJ Non-Invasive Mapping of the Gastrointestinal Microbiota Identifies Children with Inflammatory Bowel Disease. Plos One Ley RE, Backhed F, Turnbaugh P, Lozupone CA, Knight RD, Gordon JI Obesity alters gut microbial ecology. Proceedings of the National Academy of Sciences of the United States of America 102:
37 Page 36 of Titles and Legends to Figures Figure 1 Schematic of how the distribution-based clustering algorithm forms OTUs. Symbols represent sequences originating from the same template, organism or population. Gray coloring represent dominant sequences, and white coloring represent lowly abundant variants or errors. OTUs are represented as ovals encompassing one or more symbols. (a) Hypothetical phylogenetic tree of the genetic relationship between various sequences represented by different symbols and colors. The distribution of two dominant sequences across one environmental parameter is shown. Using both the genetic and distribution information, distribution-based clustering identifies these as sequences originating from different organisms or populations, and puts them in different OTUs. (b) The phylogenetic relationship and distribution of a dominant sequence and a lowly abundant variant across some ecological parameter. Based on the sequence identity and distribution, distribution-based clustering merges these sequences in the same OTU. (c) Using genetic information alone, there is no way to achieve the desired clustering of sequences by symbol. Using a higher percent sequence identity cut-off will keep all dominant sequences in separate OTUs, but will keep some lowly abundant or erroneous sequences in different OTUs. Alternatively, using a lower identity cut-off, all lowly abundant variants will be merged with the abundant variants, but the diamond and square symbols are merged as well. 854
38 Page 37 of Figure 2 An outline of the decision making process used during distribution-based clustering. Rounded rectangles indicate the beginning and end of the process and arrow point to the next step in the process. Hexagons indicate a loop with the sorting criteria indicated within the hexagon. Diamonds indicate a decision step, with the question contained within the diamond and arrows directing how the program will respond. Rectangles indicate action steps, where sequences are categorized as either representatives of a new OTU or merged into an existing OTU Figure 3 Distribution-based clustering results in more correct OTUs, fewer incorrect OTUs and more accurately clustered reads originating from the same template in a mock community. a.) The number of total correct (black- left axis) and incorrect (hatched- right axis) OTUs predicted by each clustering method. A correct OTUs is one in which the representative sequence matches one of the input sequences. b.) The accuracy of each clustering method at grouping together reads originating from the same template as measured by both F-score (black bar) and Matthew's coefficient correlation (hatched bar). c.) The Jensen-Shannon divergence (JSD) is used as a measure of distance from the input of resulting communities created by applying each clustering method Figure 4 Distribution-based clustering predicts fewer OTUs and more accurately clustered reads originating from the same organism in cleaned, denoised and chimera-free mock community. a.) The number of total OTUs predicted by each clustering method. b.) The accuracy of each clustering method at grouping together
39 Page 38 of sequences that originated from the same organism as measured by both F-score (black bar) and Matthew's coefficient correlation (hatched bar). c.) The Jensen- Shannon divergence (JSD) is used as a measure of distance from the input of resulting communities created by applying each clustering method Figure 5 Evaluation of clustering methods on environmental samples from a stratified lake. a.) The total number of OTUs predicted by each clustering method for the entire lake. b.) Sequences displaying distinct ecological distributions but are merged by all clustering algorithms except distribution-based clustering. The solid line is the distribution of the resulting cluster, comprised mainly of two sequences (dotted and dashed lines). Distribution-based clustering keeps the two sequences distinct, but all other methods merge them into one OTU. c.) Sequences that represent micro-diversity within the environmental sample. The distribution-based clustering algorithm can be adjusted such that these sequences either remain distinct or can be clustered Figure 6 Template abundance is highly correlated with input concentration when templates do not have mismatches in the primer-binding site. Additionally, stringent quality filtering can decrease the correlation with input concentration for poor quality sequencing runs. a) and b) show data from a high quality sequencing run and c.) and d.) show data from a low quality sequencing run. a) and c) show unfiltered data and b.) and d.) show filtered data. Abundance is determined as the number of reads with best blast hit to the mock community sequence. Input concentrations
40 Page 39 of were measured experimentally from mock community DNA template. Trendlines and corresponding correlation coefficients (R 2 ) shown for reads with primer site matches only (black square).
41
42

43
44
45
46 1 2 Table 1 The ability of each clustering algorithm to groups reads from the same input sequence together into the same OTU 3 4 TP 1 FP 2 TN 3 FN 4 Distribution-based De novo Reference-based Complete Parallel USEARCH Average 5 Open Closed 8.57E E E E E E E E E E E E E E E E E E E E E E E E TP: True positives when two reads with best blast hits to the same mock community input sequence cluster in the same OTU 2 FP: False positives when two reads with best blast hits to different mock community input sequences cluster in the same OTU 3 TN: True negatives when two reads with best blast hits to different mock community input sequences cluster in different OTUs 4 FN: False negative when two reads with best blast hits to the same mock community and in different OTUs or when one of the reads is not assigned to any OTUs (Closed reference only) 5 Average: Average linkage hierarchical clustering 15
47 Table 2. Total number of OTUs remaining after filtering out low abundance OTUs Mock Community Environmental Sample Method No filter 2 >1 >10 No filter >1 >10 DBC 1 (complete) NA NA NA DBC (parallel) ,234 11,762 6,087 De novo 23,616 17,261 7,875 (USEARCH) De novo (average NA NA NA linkage) Closed reference ,799 7,867 4,046 Open reference ,047 15,833 6,310 1 DBC: Distribution based clustering 2 Filtering criteria: Either all OTUs were included (No filter), or only OTUs with greater than 1 (>1) or greater than 10 (>10) counts were included
48 Table 3. Representative clustering times for mock community samples with various algorithms Total Run Time (hr:min:sec) 1 Clustering Method Mock community 2 Environmental Sample 3 Distribution based 1:09:40 NA 4 clustering (complete) Distribution based 0:21:31 7:58:57 clustering (parallel) 5 De novo (average neighbor) 0:06:36 NA De novo (USEARCH) 0:00:23 0:00:26 Closed reference 0:06:09 1:26:23 Open reference 0:06:05 1:23:25 1 Times are approximated by the difference between the start time and end time in the shell script examples in SI. 2 The mock community contains 565,498 total reads and 5489 unique sequences 3 The environmental sample contains 7,539,779 total reads and 120,601 unique sequences. 4 NA indicates that this method was not performed. 5 The distribution based clustering algorithm was the only one was parallelized different processes were run at one time. Other methods would have had improved speeds if run in parallel.
49 SupplementaryInformation Environmentalsamplecollection WaterwascollectedfromUpperMysticLake,(Winchester,MA,~ N, W)onAug,13,2008usingaperistaticpumpandplasticTygon tubing.tubingwasloweredtoapoint~1mfromthebottom,runningthepumpin reversetopreventwaterfromenteringthetubinguntiltheappropriatedepthwas reached.waterfromdepthwasallowedtoflowthroughthetubingfor5minutes before14mlswerecollectedintoa15mlsterilefalcontubeandimmediatelyplaced ondryice.thefirstsamplewastakenfrom22mdepthandsubsequentsamples weretakeneverymeteruntil3m,thenat1.5mandthesurface.sampleswere transportedondryiceandstoredat 80 Cuntilprocessing(about1yearlater). DNAextraction DNAwasextractedaspreviouslydescribed(Blackburn2010).Briefly,DNA wasextractedwithamodifiedversionoftheqiagendneasybloodandtissuekit (Qiagen,USA).WaterwasfilteredthroughSwinnexfilterholdersonto0.22μm filters(millipore,billerica,ma).filtersweresterilelycutandaddedtoa2mlscrew captubecontaining0.25gof0.1mmzirconium/glassbeads(mobiolaboratories, Inc.,Carlsbad,CA).180μloflysisbufferconsistingof20mMTrisHCl,2mMEDTA, and1.2%triton X100(pH8.0)wasaddedandsampleswereplacedonaMini Beadbeater 1(BioSpecProducts,Inc.,Bartlesville,OK)for1minuteatmaximum speed.180μloflysisbufferwith40mg/mllysozymewasaddedandthesamplewas incubatedat37 Cfor1hrwithshaking(450rpm).50μlofproteinaseKwasadded alongwith400μlofalbuffer(qiagendneasykit)withoutethanol.sampleswere mixedandincubatedat56 Cfor45min.followedbya5min.incubationat95 C. Sampleswerecentrifugedandtheliquidwastransferredtoasterile1.5mltube. 400μlof100%ethanolwasaddedandtheliquidwasaddedtotheQiagenDNeasy column.dnawaswashedonthecolumnfollowingtheqiagendneasyprotocol, including500μlwashwithaw1andaw2andafinalelutionin100μlae. Mockcommunitytemplatepreparation
50 Tomaketheclonelibrary,16SrRNAsequenceswereamplifiedwithPhusion polymerase(newenglandbiolabs,ipswich,ma)and27fand1492rprimers(lane 1991).PCRproductswereclonedintothepCRBluntIIplasmidwiththeZeroBlunt TOPOPCRcloningkit(Invitrogen,Carlsbad,CA)andsequencedinatleastone directionwithsangersequencing(genewiz,southplainfield,nj).plasmidswere purifiedusingtheplasmiddnaisolationreagentsystem(carolinabiologicalsupply Co.,Burlington,NC)anddigestedwithrestrictionenzymeNotI(NewEngland Biolabs,Ipswich,MA)tolinearizetheplasmid. Illuminalibrarypreparation Real timepcrreactionsweredonefirsttonormalizetemplate concentrationsandavoidcyclinganytemplatespastmid logphase.pcrreactions forilluminalibrarieswerecarriedoutasfollows:0.5unitsofphusionwith1xhigh Fidelitybuffer,200µMofeachdNTP,0.3µMofPE16S_V4_U515_Fand PE16S_V4_E786_Rfirststepprimersandapproximately40ngofmixedDNA templatewereaddedforeach25µlreaction.additionally,5xsybrgreeninucleic acidstain(molecularprobes,eugene,or)wasaddedforreal timepcr.samples werecycledwiththefollowingconditions:denaturationat98 Cfor30sec annealingat52 Cfor30secandextensionat72 Cfor30sec.14cycleswasmidlogforallsamplesandwassubsequentlyusedasthenumberofcyclesforthefirst steppcr.thefirststeppcrreactionwascycledasfour25µlreactionsforeach sample.pcrreactionswerepooledandcleanedwithagencourtampurexp PCR purification(beckmancoulter,brea,ca)accordingtothemanufacture'sprotocol. Illuminaspecificadaptorswereaddedduringasecondstepamplification. TheconditionsforthesecondstepPCRweresimilartothefirststep,although4µl ofthepurifiedfirststepreactionwasusedasatemplateand0.4µmofeachpe III PCR Fandthebarcodedreverseprimerwasusedwith9cycles.Sampleswere cycledasfour25µlreactionsandcleanedwithagencourtampurexp PCR purificationsystem.theninelibrariesweresequencedingroupsofthreeacross threelanes(twoflowcells)onboththeilluminagaiiandhiseqatthebiomicro
51 Center(MIT,Cambridge,MA)with93othersamplesperlane. Calculationoferrorratepersample Rawdatafromreadswithanexactmatchtooneoftheninebarcodesusedforthis experimentwereusedforcomparingerrorratesacrossflowcellsandlanes.this wasnecessarybecausethesesamplesweremultiplexedintolanescontainingupto 93additionalunrelatedsamples.Theraw,unfilteredfastqfileswereconvertedinto afastafileusingacustomperlscript.blastwasusedtomaptherawsequencesto themockcommunitymembers,wherethemockcommunitydatabasewastrimmed totheamplifiedregionbetween,butnotincluding,theforwardandreverseprimer site.rawsequenceswereonlyconsideredifthequeryandsubjectstartandstop positionscorrespondedtothefulllengthoftheilluminaforwardread.theperfect match,andsingleanddoublebasemismatches,takenfromtheblastoutput,were calculatedasapercentofthetotalthatmaptothefulllengthilluminasequence(fig. S6).Sequenceswithlessthan100%queryorsubjectcoveragewerenotconsidered inthiscalculation. Commandsusedduringprocessing Thefollowingcommandswereusedduringprocessing. Closed referenceclusteringwithqiime(shell): #!/bin/sh #$ S/bin/bash # cwd source/etc/profile.d/modules.sh moduleloadqiime default moduleloadmothur #fastafilenameinqiimeformatfromfirststringaftercommand FASTAFILE=$1 #outputdirectoryassecondstringaftercommand OUTPUT=$2
52 #referencefastafile(latestgreengenesotus) REFERENCEFA~/greengenes/gg_12_10_otus/rep_set/97_otus.fasta #referencetaxonomies REFERENCETAX=~/greengenes/gg_12_10_otus/taxonomy/97_otu_taxonomy.txt PARAMS~/bin/methods_scripts/closed_ref_params.txt echo"starttime" date+"%m %d %y" date+"%t" pick_reference_otus_through_otu_table.py o${output} i${fastafile} r ${REFERENCEFA} t${referencetax} p${params} pick_rep_set.py input./${output}/uclust_ref_picked_otus/*_otus.txt rep_set_picking_methodmost_abundant fasta_file${fast AFILE} o./${output}/uclust_ref_picked_otus/otus_rep_set.fa echo"endtime" date+"%m %d %y" date+"%t" Closed referenceqiimeparameters: pick_otus:otu_picking_methoduclust_ref pick_otus:refseqs_fp/greengenes/gg_12_10_otus/rep_set/97_otus.fasta pick_otus:enable_rev_strand_matchtrue pick_otus:suppress_new_clusters True Open referenceclusteringwithqiime(shell) #!/bin/sh #$ S/bin/bash
53 # cwd source/etc/profile.d/modules.sh moduleloadqiime default moduleloadmothur #fastafilenameinqiimeformat FASTAFILE=$1 #outputfolder(unique) OUTPUT=$2 #referencefastafile(latestgreengenesotus) REFERENCEFA=/data/spacocha/Qiime_dir/greengenes/gg_12_10_otus/rep_set/97 _otus.fasta #referencetaxonomies REFERENCETAX=/data/spacocha/Qiime_dir/greengenes/gg_12_10_otus/taxonomy /97_otu_taxonomy.txt PARAMS=/home/spacocha/bin/methods_scripts/open_ref_params.txt echo"starttime" date+"%m %d %y" date+"%t" pick_reference_otus_through_otu_table.py o${output} i${fastafile} r ${REFERENCEFA} t${referencetax} p${params} pick_rep_set.py input./${output}/uclust_ref_picked_otus/*_otus.txt rep_set_picking_methodmost_abundant fasta_file${fast AFILE} o./${output}/uclust_ref_picked_otus/otus_rep_set.fa echo"endtime" date+"%m %d %y"
54 date+"%t" Open referenceqiimeparameters: pick_otus:otu_picking_methoduclust_ref pick_otus:refseqs_fpgreengenes/gg_12_10_otus/rep_set/97_otus.fasta pick_otus:enable_rev_strand_matchtrue pick_otus:suppress_new_clusters False DenovoUSEARCH(shell) #!/bin/sh #$ S/bin/bash # cwd #fastafile FASTAFILE=$1 #matfile MATFILE=$2 echo"starttime" date+"%m %d %y" date+"%t" perl~/bin/fasta2uchime_mat.pl${matfile}${fastafile}>${fastafile}.ab ~/bin/usearch _i86linux32 cluster_fast${fastafile}.ab id0.97 uc ${FASTAFILE}.uc perl~/bin/uc2list2.pl${fastafile}.uc>${fastafile}.list perl~/bin/list2mat.pl${matfile}${fastafile}.listeco>${fastafile}.list.mat perl~/bin/fasta2filter_from_mat.pl${unique}.list.mat${fastafile}> ${FASTAFILE}.list.mat.fa
55 echo"endtime" date+"%m %d %y" date+"%t" Mothurcommand(batch) unique.seqs(fasta=unique.uchime.remove.tocluster.fa) align.seqs(fasta=unique.uchime.remove.tocluster.unique.fa, reference=/data/spacocha/tmp/silva.bacteria.fasta) screen.seqs(fasta=unique.uchime.remove.tocluster.unique.align, name=unique.uchime.remove.tocluster.names,start=13862, end=15958,minlength=76) filter.seqs(fasta=unique.uchime.remove.tocluster.unique.good.align,vertical=t, trump=.) unique.seqs(fasta=unique.uchime.remove.tocluster.unique.good.filter.fasta, name=unique.uchime.remove.tocluster.good.names) system(cpunique.uchime.remove.tocluster.unique.good.filter.unique.names final.names) system(cpunique.uchime.remove.tocluster.unique.good.filter.namesfinal.names) dist.seqs(fasta=final.fasta,cutoff=0.15) cluster(column=final.dist,name=final.names) Generationofprincipalcomponentanalysisplots PrincipalcomponentanalysiswasdoneonthefinalOTUbylibrarymatricesforeach clusteringalgorithmusingqiimebeta_diversity_through_plots.py.thelowest numberofsequencesinalibrarywasdeterminedusingqiime'sper_library_stats.py andinputintobeta_diversity_through_plots.py( e).treesoftherepresentative samplesweremadewithfasttree. Simulatedmockcommunitydatawithvaryingerrorratesacrosslibraries
56 Todeterminetheimpactofdifferenterrorratesacrosslibrariesondistributionbasedclusteringperformance,simulatedmockcommunitywasgeneratedusingthe templatesequencesforeachmembersaddedacrosslibraries.thetotalnumberof sequencesgeneratedwasproportionaltomeasuredconcentrationandresultedin thecreationof748,463totalinsilicoreads.thegeometricmean(rversion2.12.1; rgeom)wasusedtocreateerrorratesofboth0.9and0.8tosimulatehighandlow qualitysequencingruns,respectively.theconstanterrorratedatasetusedintable S5was0.9foralllibrarieswhilethevariableerrorratedatasetwas0.90for6 librariesand0.08for3ofthelibraries. Thegeometricmeanwasusedtodeterminewhichofthesimulatedreads wouldcontainerrorsandhowmanyerrorsitwouldcontain.thiswasimplemented inr(version2.12.1)withrgeomusingthetotalreadcountneededforeach sequenceandtheerrorrate.forexample,ifatemplatewassupposedtohave10 readswithanerrorrateof0.8,theresultswouldlooksimilartothefollowing: >rgeom(10,0.8) [1] Wheretwosequenceswouldhaveonebpdifferent,onewouldhavefour mismatchesandsevensequenceswouldhavenoerrors. Afterdetermininghowmanyerrorstogenerateforeachread,thepositionof theerrorswasalsodeterminedinrusingthehypergeometricmean(rhyper).the distributionresultsineither0or1anddependsontheinputprobability.startingat the3'endingposition,thehypergenometricmeanwasusedtodeterminewhether toalterthebasetoanotherrandombase(1=alter,0=evaluatenextbase).the probabilityofhavinganerrordecreasedtowardthe5'endtomimicsequence qualitybeingpooratthe3'end.thiswasrepeateduntiltherequirednumberof errorswasgenerated. Twodatasetsweregeneratedinthismanner.Onesethadaconstanterror rateacrossalllibraries,andanotherhadthreelibrarieswithahighererrorrate.the datasetwasclusteredusingthedistributionbasedclusteringalgorithmasnormal andtheresultsarepresentedintables5.
57 SupplementaryReferences BlackburnMC(2010).DevelopmentofNewToolsandApplicationsforHigh ThroughputSequencingofMicrobiomesinEnvironmentalorClinicalSamples. MasterofScienceinChemicalEngineeringthesis,MassachusettsInstituteof Technology,Cambridge,MA. LaneDJ(1991).16S/23SrRNAsequencing.In:StackebrandtE,GoodfellowM(eds). NucleicAcidTechniuqesinBacterialSystemantics.Wiley&Sons:Chinchester.pp
58 SupplementaryFigures!" #" $" %" &" '!" '#"!" '!!!" #!!!" (!!!" $!!!" )!!!" %!!!" *+,-'" *+,-#" *+,-(".-,+,-'".-,+,-#".-,+,-("!"#$%&'#()*("%&+,&%+%-./& 01$2-"*(&'*+$"%3/& 451)-)6& /0!!!!!#!1" ,-758"897895:875,-;"!"!<#"!<$"!<%"!<&" '" '<#" '<$" '<%"!" #!!" $!!" %!!" &!!" '!!!" '#!!" '$!!" *+,-'" *+,-#" *+,-(".-,+,-'".-,+,-#".-,+,-("!"#$%&'#()*("%&+,&%+%-./& 01$"2-"*(&'*+$"%3/& 451)-)6& /0!!!!!!=1" ,-758"3,>?,35"
59 FigureS1.Uniquedistributionsacrossthemocklibrarieshelptoidentifya mislabeledsequenceinthereferencedataset.a.thedistributionofasequence matchingthereferencesequencelabeledprovidenciarettgeriandtheinput distributionofprovidenciaalcalifaciens.thissequencealsomatchedothersstrains labeledprovidenciaalcalifaciensinncbi'snrdatabase.itwaschangedto Providenciaalcalifaciens.b.)Thedistributionofanothersequencewhich correspondstothecorrectinputofprovidenciarettgeri.thisothersequencealso hitsmanyotherprovidenciarettgeristraininncbi'snrdatabase.thissequence wasincludedintheanalysisasthereferencesequenceforprovidenciarettgeri.!"!"#$$$#!%&#'()*+,-(./( '( #"!"#$3#!%&#GGG()*+,-(./(!"01*2342"EF12&()*+,-(0/( "EF1( H7?<A8,( FigureS2.16SrDNAlibraryconstructfromtwo steppcr.a.)5'endoftheillumina libraryconstruct,includingbothfirstandsecondstepforwardprimersequences andsequencingprimers.b.)3'endofilluminalibraryconstructincludingbarcoded regionandfirststepandsecondstepreverseprimers.
60 FigureS3.Distribution basedclusteringresultsinadistributionofsequencesthat ismostsimilartotheinputdistribution.additionally,anintermediateamountof qualityfilteringresultsinabetterrepresentationoftheinputcommunityforall clusteringmethods.thejensen Shannondivergence(JSDiv)isusedasameasureof distancebetweentheinputconcentrationandresultingotucountsafterapplying eachclusteringmethodatdifferentlevelsofqualityfiltering.atthehighesterror rates,incorrectotusaddtothedistancefromthetruedistribution.atthelowest errorrates,thesmallnumberofreadskeptcreatesthelargedistancevalues.both parallelandcompletedistribution basedclusteringmethodsresultinotusthatare mostsimilartothetruedistributionatintermediatelevelsofqualityfilter stringency.
61
62 FigureS4.SensitivityoftheresultingOTUstochangesinthedistribution based algorithmparameters.a.)increasingthesignificancecut offvalueofthechi sqtest createsmoreincorrectotuswhereaslowerp valuecut offstendtomerge sequences.x axisinplottedinlogscaleb.)decreasingtheabundancecriteria mergestrueinputsequenceswithsimilardistributions,butincreasingthecut offto 10mainlydetectssequencingerrors.X axisisplottedinlogscalec.)lowergenetic similaritycutoffsgeneratemoreincorrectotus,whereasathighgeneticcut off values,somemockcommunitysequenceswithsimilardistributionsaremerged. "Correct"arethenumberofOTUscontainingasingleexactmatchtoaninput sequence."incorrect"arethenumberofotusthatdonothaveanysequences exactlymatchingtheinputcommunity."merged"arethenumberofotusthat containmorethanonesequencematchinganinputsequence.

63