APPLICATION OF ARGON PLASMA TECHNOLOGY TO HYDROPHOBIC AND HYDROPHILIC MICRODROPLET GENERATION IN PDMS MICROFLUIDIC DEVICES
|
|
|
- Earl White
- 5 years ago
- Views:
Transcription
1 APPLICATION OF ARGON PLASMA TECHNOLOGY TO HYDROPHOBIC AND HYDROPHILIC MICRODROPLET GENERATION IN PDMS MICROFLUIDIC DEVICES A Thesis presented to the Faculty of California Polytechnic State University, San Luis Obispo In Partial Fulfillment of the Requirements for the Degree Master of Science in Biomedical Engineering by Brennan Graham March 2017
2 2017 Brennan Graham ALL RIGHTS RESERVED ii
3 COMMITTEE MEMBERSHIP TITLE: Application of Argon Plasma Technology to Hydrophobic and Hydrophilic Microdroplet Generation in PDMS Microfluidic Devices AUTHOR: Brennan Graham DATE SUBMITTED: March 2017 COMMITTEE CHAIR: David Clague Ph.D. Professor of Biomedical Engineering COMMITTEE MEMBER: Hans Mayer Ph.D. Lecturer for Department of Mechanical Engineering COMMITTEE MEMBER: Richard Savage Ph.D. Professor of Biomedical Engineering iii
4 ABSTRACT Application of Argon Plasma Technology to Hydrophobic and Hydrophilic Microdroplet Generation in PDMS Microfluidic Devices Brennan Graham Microfluidics has gained popularity over the last decade due to the ability to replace many large, expensive laboratory processes with small handheld chips with a higher throughput due to the small channel dimensions [1]. Droplet microfluidics is the field of fluid manipulation that takes advantage of two immiscible fluids to create droplets from the geometry of the microchannels. This project includes the design of a microfluidic device that applies the results of an argon plasma surface treatment to polydimethylsiloxane (PDMS) to successfully produce both hydrophobic and hydrophilic surfaces to create oil in water (O/W) and water in oil (W/O) microdroplets. If an argon plasma surface treatment renders the surface of PDMS hydrophilic, then O/W microdroplets can be created and integrated into a larger microdroplet emulsion device. The major aims of this project include: (1) validating previously established Cal Poly lab protocols to produce W/O droplets in hydrophobic PDMS microdroplet generators (2) creating hydrophilic PDMS microdroplet generators (3) making oil in water droplets in hydrophilic PDMS microdroplet generators (4) designing a multilayer microfluidic device to transfer W/O droplets to a second hydrophilic PDMS microdroplet generator iv
5 W/O droplets were successfully created and transferred to a second hydrophilic PDMS device. The hydrophilic PDMS device also produced O/W droplets in separate testing from the multilayered microfluidic PDMS device. The ultimate purpose of this project is to create a multilayer microdroplet generator that produces water in oil in water (W/O/W) microdroplet emulsions through a stacked device design that can be used in diagnostic microdroplet applications. Thesis Supervisor: Dave Clague Title: Professor of Biomedical Engineering v
6 ACKNOWLEDGMENTS I am greatly indebted to my thesis advisor Dr. David Clague for providing me the opportunity to take on this project. The opportunities and support you have provided for me in the past two years have not only allowed me to develop myself to become a better student, but also a better person. Thank you for believing in me and allowing me to develop this microdroplet project. Your character and personality is also a demonstration that accomplished and respected individuals are as energetic and entertaining as their students. I am also greatly indebted to Hans Mayer for providing me with knowledge and resources for microdroplet formation and his extensive technical advice both inside and outside of the classroom. I could not have completed this project without your help. And to Dr. Richard Savage thank you for providing me with the resources for microsystem design and fabrication. I cannot thank you enough for allowing me access to your technologies. vi
7 TABLE OF CONTENTS Page LIST OF TABLES... xi LIST OF FIGURES... xii CHAPTER 1.INTRODUCTION Microfluidic Platforms Diagnostics and Molecular Analysis Microelectronics Droplet Microfluidics Droplet Formation Techniques Droplet Manipulations Droplet Fission and Fusion Droplet Sequestration Droplet Mixing Reagents in Microdroplets Digital Microfluidics Commercial Applications of Droplet Microfluidics Digital PCR Dolomite Microfluidics Microdroplet Emulsions Formation of Microdroplet Emulsions Microdroplet Emulsion Device Fabrication Argon Plasma- PDMS Microdroplet Generator Organization METHODS Introduction PDMS Microdroplet Generator Fabrication...22 vii
8 2.2.1 Soft Lithography Silicon Wafer Processing Photomask Design Capillary Number Considerations for Microdroplets Device 1 Double T Junction Device 2 Single T Junction Device 3 Double T Junction with Mixing Potential Engineering Specifications PRELIMINARY EXPERIMENTS Validation of Hydrophobic PDMS Microdroplet Generator Devices Introduction Experimental Setup Surfactants Contact Angle Verification Experimental Procedure Hydrophobic Device: Results Conclusions Single Device Hydrophobic PDMS Microdroplet Generator Single Device Fabrication Assembly Protocol Testing: Single Device Hydrophobic PDMS Microdroplet Generator Single Device: Results Conclusions Stacked Devices PDMS-Glass Microdroplet Generator Conceptual Design with a PDMS-Glass Stacked Device Hydrophobic Device Design Hydrophilic Device Design Contact Angle and Surface Considerations PDMS-Glass Stacked Devices Fabrication...49 viii
9 Assembly Protocol Testing: PDMS-Glass Stacked Devices Microdroplet Generator PDMS-Glass Stacked Devices: Results Conclusions FINAL EXPERIMENT- PDMS STACKED DEVICES MICRODROPLET GENERATOR Introduction Conceptual Design PDMS Stacked Devices PDMS Stacked Devices Fabrication Assembly Protocol Device Testing: PDMS Stacked Devices Microdroplet Generator PDMS Stacked Devices: Results W/O Microdroplet Results O/W Microdroplet Results Single Disperse Oil Droplet Alternative Viscosities for Dispersed Phase Fluid Water-Glycerol Solution as the Continuous Phase Fluid Testing with Water-Glycerol as Continuous Phase Fluid Results for Water-Glycerol Solution as Continuous Phase Fluid Conclusions CONCLUSIONS AND FUTURE DIRECTIONS...84 REFERENCES...87 APPENDICES Appendix A - Profilometer Scan Verification of Device Channel Depth Appendix B - Rheometer Scan Verification of Fluid Viscosities Appendix C - Bill of Materials Appendix D Contact Angles of Hydrophobic PDMS Recovery and Glass Slides and PDMS Bonding ix
10 Appendix E Soft Lithography Processing Protocol for PDMS Microfluidic Devices x
11 LIST OF TABLES Table Page 1. Customizations for Channel Depth from MicroChem specification sheets for Wafer PDMS Layer Thicknesses and Volumes Channel dimensions for Devices 1, 2, and Engineering Specifications for Cal Poly Microdroplet Generators Intrinsic contact angles on hydrophilic surfaces W/O Microdroplet Formation in Device 2A and 2B PDMS Contact Angle Recovery Fluid viscosities of dispersed phase fluids used in O/W microdroplets Viscosity Ratios for Successful O/W Droplet Formation Rheometer Viscosity Testing Profilometry Scan Channel Depth (µm) Bill of Materials for Droplet Generator Plasma Bond Integrity Testing xi
12 LIST OF FIGURES Figure Page 1. Droplet Formation in a Flow Focuser and a T junction Bifurcating channel geometry in a microfluidic device Droplet storage techniques Dielectrophoresis particle trapping Serpentine laminating micromixer Droplet mixing through channel merging Work flow for DNA assays Formation of W/O/W microemulsions in a T junction Sessile drop contact angle measurement Capillary numbers in O/W microdroplets Capillary numbers in W/O microdroplets Device 1 channel geometry Device 1 T junction sizes Device 2 channel geometry Device 3 channel geometry Lab testing setup Microdroplets fusing without the use of surfactant W/O microdroplet formation in a T junction Microdroplets flowing in an outlet channel W/O microdroplets merging in Device W/O microdroplet formation in Device References inlets for the hydrophobic Device 2 geometry References inlets for the hydrophilic Device 2 geometry W/O microdroplet formation in Device 2A Co-flow of mineral oil and water in Device 2A...56 xii
13 26. Satellite microdroplet formation in a flow focusing device Hydrophobic recovery of an argon plasma treated PDMS surface Goniometer measurements of aqueous water droplets on PDMS W/O microdroplet formation in Device 2A Irregular flow of W/O microdroplets in Device 2B Inlet Stable transfer of W/O microdroplets Co-flow of water and mineral oil in Device 2A and 2B Movement of water up the Inlet 4 oil channel Co-flow and merging of mineral oil in Outlet 2 Device 2B Co-flow and T junction of failed WD-40 oil testing Droplet formation at different viscosity ratios- computational study O/W microdroplet formation in Device 2B O/W microdroplet formation in Device 2B Profilometer Data Sample Profilometer Data Sample Profilometer Data Sample Profilometer Data Sample Trend lines for rheology testing of different fluid types Shear stress vs strain rate curve for the 1:1 glycerol water solution Shear stress vs strain rate curve for the 2:1 glycerol water solution Shear stress vs strain rate curve for mineral oil Shear stress vs strain rate curve pure glycerol Contact angle of untreated PDMS Contact angle of post plasma baked PDMS Contact angle of treated PDMS at 0 hours Contact angle of treated PDMS at 0.5 hours Contact angle of treated PDMS at 1 hour Contact angle of treated PDMS at 1.5 hours xiii
14 54. Contact angle of treated PDMS at 2 hours Contact angle of treated PDMS at 3 hours Contact angle of treated PDMS at 4 hours Contact angle of treated PDMS at 5 hours Contact angle of treated PDMS at 9.5 hours Contact angle of treated PDMS at 14 hours Contact angle of treated PDMS at 28 hours Contact angle of untreated glass Contact angle of treated glass at 0 hours Contact angle of treated glass at 0.5 hours Contact angle of treated glass at 1 hour Contact angle of treated glass at 2 hours Contact angle of treated glass at 3 hours Contact angle of treated glass at 4 hours Microfabrication process xiv
15 Chapter 1. Introduction Scientific developments in microsystems downsizing chemical and biological instrumentation have many potential applications in the field of microfluidics. Microfluidics is the application of soft lithography to create channels with micron sized dimension to manipulate and handle small amounts of fluids. 1.1 Microfluidic Platforms Microfluidics provides a platform for droplet based microfluidics using devices with closed microchannels fabricated with soft lithography. This specific platform is commonly made of either a glass or PDMS substrate. A glass substrate has easily modifiable surface properties with the deposition of a chemical surface treatment such as polytetrafluoroethylene [2]. On the other hand, a PDMS substrate enables rapid prototyping and takes advantage of the intrinsic hydrophobicity of the PDMS surface. The microchannel geometry is transferred to a silicon wafer using soft lithography techniques and the wafer is then used as a mold to form the channel geometries in PDMS. Microchannels in glass or other platform surfaces are manufactured using dry/wet etching techniques such as dry reactive ion etching (DRIE). Microfluidic platforms have significant advantages over comparable macroscopic systems that include smaller reagent consumption, high sample throughput, and rapid chemical mixing [3]. Microfluidics utilizes its size and other characteristics such as laminar flow to allow for new ways to control molecules and fluids which will be discussed further in section [4]. However, despite these clear benefits, microfluidic platforms have not yet seen widespread use. It is clear that focusing on specific, highly beneficial applications and following through the entire process of development will be needed to bring microfluidic platforms to 1
16 commercial use. Several of these applications will be discussed in further detail below in sections and Diagnostics and Molecular Analysis The beginning of exploration of using microfluidics for molecular analysis can be traced back to techniques such as capillary electrophoresis (CE) and high-pressure liquid chromatography (HPLC). It was determined these methods could be combined with laser detection to improve sensitivity and resolution of low sample molecular analysis testing [4]. Suddenly with these techniques it became possible to downsize many existing testing methods using microfluidics and lab on a chip devices. Lab on a chip devices have applications in immunoassays, nucleic acid based molecular diagnostics, and stable storage of chemical or biological samples [5] [6] [7]. The advantages of high throughput testing with small sample sizes made microfluidics the ideal testing method for these applications. Microfluidics is also inherently versatile; it can fabricate unusual geometries which can allow for complex fluid handling and integrated detection all on the same device. This versatility permits unique solutions to diagnostic problems. A large issue in the developing world today is the inability to properly test for diseases and other conditions in the field due to lack of access to technology. Research is rapidly moving towards developing microfluidic point of care devices to address this need. Inherent properties of microfluidics devices such as cost, size, high resolution, and high sensitivity offers many compelling advantages to existing testing methods. Research into point of care devices is ongoing to improve the simplicity and clinical outcomes of the devices. Microfluidics diagnostic testing is moving out of the laboratory and into the future with point of care diagnostic devices. 2
17 1.1.2 Microelectronics Microfluidics first broke into the microelectronics industry as research was progressing on silicon wafer processing which established processes for photolithography, etching, and bonding. Microelectronics are integrated with microfluidics in microelectromechanical systems (MEMS) that transport micro/nano liters of fluid through micro sized channels. An interesting application of microelectronics is using an electrically controlled surface tension to drive the fluid flow [8]. This method can allow for electrical separation of particles based on natural charge characteristics. For this reason, MEMS integrated with microfluidic channels for particle sensing is an expanding area of research. For cost and complexity reasons, it is often easier to fabricate MEMS devices with PDMS polymers rather than silicone and glass devices [4]. PDMS is also opaque and much easier to rapid prototype as opposed to glass and silicone. Thus, PDMS rapid prototyping for chemical and biological sensing and detection with microelectronic electrodes is a prime example of the integration of microelectronics and microfluidics [9]. 1.2 Droplet Microfluidics Microfluidics as an industry has greatly expanded over the past three decades due to advances in fabrication techniques. Droplet based microfluidic systems have particularly seen explosive growth because of their potential to be used in chemical and biological sensing. The droplets provide a controlled reaction vessel for biological reagents or rapid mixing of fluids. Droplet based systems have the potential to be used as innovative solutions for current biomedical engineering challenges. Droplets were first used in a biological setting by Lederberg in 1954 as a method for isolating individual microbes [10]. Droplets were formed by spraying water droplets into mineral oil [11]. Soon after, Rotman 3
![discovered that microdroplets could function as a vessel for enzymatic reactions [12]. This opened many new potential applications for performing biological or chemical reactions using microdroplets.](/docs-images/86/94439547/images/18-0.jpg "Since microdroplet generators can perform many reactions without increasing the complexity or size of the device, they can be more efficient than comparable macroscopic reaction platforms [13]. 1.2.")
18 discovered that microdroplets could function as a vessel for enzymatic reactions [12]. This opened many new potential applications for performing biological or chemical reactions using microdroplets. Since microdroplet generators can perform many reactions without increasing the complexity or size of the device, they can be more efficient than comparable macroscopic reaction platforms [13] Droplet Formation Techniques Droplet formation is primarily achieved through one of two methods: a flow focusing device or a T-junction device. Examples of these devices can be seen in Figure 1. Figure 1: Droplet Formation in a Flow Focuser and a T junction- (Left) Droplet formation using flow focusing at 4X magnification with 200µm oil and water channels in Batch 1 (Right) Droplet formation in a T-junction at 10X magnification with 100µm oil and water channels in Batch 1 [14]. All examples of microdroplet formation involve the interactions of two immiscible fluids at the junction of the phases. In a T-junction, the dispersed phase fluid penetrates the main channel composes the fluid that makes up the droplet. The continuous phase is the fluid that the dispersed phase is immersed inside. Droplet formation in a T junction microdroplet generator begins as the dispersed phase fluid penetrates the main channel filled with the 4
19 continuous phase fluid. The flow in the continuous channel distorts the droplet in the downstream direction. The droplet begins to neck due to applied force of the continuous phase fluid and eventually is sheared off and flows down the continuous channel. In a T junction device, two common immiscible fluids used are water and oil due to their distinct different in fluid viscosities. Both oil and water can make up either the dispersed or continuous phase depending whether the microdroplet generator is designed to form W/O or O/W microdroplets. A discussion of the differences in T junction microdroplet generators forming W/O and O/W droplets can be found in section However, in a flow focusing device, a continuous water phase is squeezed from both sides by two oil inlet channels as seen in Figure 1. These channels exert forces on either side of the water stream, thinning the stream as it is forced through a small geometric opening called the gate. The water stream is squeezed so much through the gate that the stream necks and breaks producing isolated droplets. Droplet formation and break-up is controlled by flow rates, the ratio between flow rates merging, and capillary number. The Capillary number is a dimensionless quantity that describes the effects of viscous forces against surface tension forces between two immiscible liquids. The Capillary number will be further discussed in section Droplet formation is also dramatically influenced using surfactants which are compounds that lower that surface tension between two immiscible fluids. The addition of surfactant to one of the fluids in a microdroplet generator will prevent droplet breakup [15]. Surfactants will be further discussed in section The size of the droplets can be tuned through device geometry and flow rate manipulation. 5
20 1.2.2 Droplet Manipulations Droplet microfluidics continues to grow with the vast number of potential applications. However, with the large number of uses comes the need for greater control over microdroplets. The main forms of droplet control that will be discussed are fission and fusion, sequestration, mixing, and reagent use. These forms of droplet control lend to many applications including, but not limited to, encapsulation of cells, proteins, or DNA and the synthesis of micro/nano particles [13] Droplet Fission and Fusion Control of the number of droplets being produced is a key factor of microdroplet experimental control given that throughput and scalability are two main advantages for microdroplet applications. Droplet fission is a crucial factor in supporting microdroplet systems. Since single droplets can serve as a container for reagents, increasing the number of droplets in a system can increase the efficiency and throughput of the microdroplet generator [13]. This allows for an easy way to scale up the droplet output of a certain device. Another factor to consider in droplet fission is when a droplet already contains a sample or reagent, fission can be utilized to control the droplet content concentration by splitting the droplet [16]. Droplet fission can be manufactured in two ways, active and passive fission [13]. Passive fission uses the geometry of the microfluidic devices with bifurcated channels to help split the droplets. The geometry in combination with flow rate variations results in forces pulling equally on each half on the droplet causing the droplet to break up into two equally sized smaller droplets. A literature example of passive droplet fission can be seen in Figure 2. 6
![Figure 2: Bifurcating channel geometry in a microfluidic device- a) Bifurcating channel geometry used to halve droplets at each junction [17] Active fission of microdroplets relies on external](/docs-images/86/94439547/images/21-0.jpg "mechanisms to split the microdroplets. One main example of separating microdroplets through an external electric mechanism is Electrowetting on Dielectrics (EWOD) [18].")
21 Figure 2: Bifurcating channel geometry in a microfluidic device- a) Bifurcating channel geometry used to halve droplets at each junction [17] Active fission of microdroplets relies on external mechanisms to split the microdroplets. One main example of separating microdroplets through an external electric mechanism is Electrowetting on Dielectrics (EWOD) [18]. Electrowetting is the manipulation of a liquid droplet that encounters a hydrophobic, insulated electrode [18]. Applying voltages to series of electrodes can induce gradient forces in the microchannels that can control the movement of microdroplets. Equal forces on two sides of the droplet with dielectric forces then split the microdroplet. Fusion in microdroplet generators directly relates to chemical and biological applications where two reagents are required to mix in the microdroplet. The fusion of two microdroplets into a single controlled reaction chamber is a highly effective mechanism for performing these reactions. The process of droplet fusion needs to be controlled because 7
22 the timing of mixing reagents is often critical for experimental success. Similar to droplet fission, the two methods of controlling droplet fusion are active and passive fusion. Passive fusion is completely controlled by the channel geometry and flow rate manipulations [19]. Fusion between microdroplets occurs when the viscous forces overcome the natural surface tension forces of the dispersed microdroplet. Microdroplet applications requiring passive fusion do not use surfactants as they increase the interfacial surface tension of the droplets which actively prevents droplet fusion. Droplet fusion can occur at a channel junction if the frequencies of the different droplet formations are synchronized [13]. However, the most common geometry design used for passive microdroplet fusion is an expanded portion of the microchannel [20]. This design allows more continuous phase fluid to flow by and decreases the microdroplet flow rate. The droplets flow slower than the continuous phase fluid surrounding them and are forced together slowly. Once the viscous forces pushing the microdroplets together overcome the natural surface tension forces, the microdroplets coalesce. Active microdroplet fusion of microdroplets, similar to active microdroplet fission, can be achieved through EWOD methods. Electrodes are placed along the channels, parallel to the microdroplets. Voltage running through the electrodes manipulates the flow direction of the microdroplets. It is important to note that when using dielectrics, the dispersed and continuous phase fluids must be dielectrically distinct from each other to ensure precise control [13]. 8
23 Droplet Sequestration Another development in microfluidics and droplet formation is the ability to transport and trap droplets to be analyzed individually. This droplet sorting is the next step to creating diagnostic devices with microdroplet sample reactors. Microdroplet sorting can be divided into passive and active components. Passive sorting applies a parameter that is constantly selected for with limited flexibility for change on the system. For example, gravity and channel geometry can be used to passively sort droplets. Microdroplets can also be trapped with channel features called surface energy wells that lower the interfacial energy of the microdroplet, causing it to expand into the well [21]. This method allows the trapping of microdroplets against the drag force of fluid flow. Holding or trapping microdroplets can function as an incubation step in a protocol for a chemical or biological sample or an analysis needs to be done with a stationary microdroplet [21]. Trapping microdroplets can also be done in the outlet portion of the device, after a water-oil junction with a series of physical blocks extruding in the channel to store the droplets until the reaction is completed (see Figure 3). By using chemicals, such as fluorophores or quantum dots, the chemical reaction can be detected and quantified optically. In this way, these droplets can be biosensors [22]. 9

24 Figure 3: Droplet storage techniques- Droplet storage, or docking, techniques a) Trapped microdroplets using surface energy wells built into the side of channel geometries b) Trapped microdroplets using geometry and fluid flow forces to keep the microdroplet in place [22]. On the other hand, active sorting provides more dynamic control of the microfluidic system with the potential for flexibility on the parameters being selected for in the droplet sorting. Dielectrophoresis is a common mechanism that actively sorts microdroplets depending on the difference in the dielectric compositions of the two fluid phases. The electric field formed by specifically placed electrodes steers microdroplets towards the appropriate downstream channel based on their reaction to the electric field [13]. Other tools than can be used to actively sort microdroplets include electroosmotic flow and optical sorting with a vertical cavity surface emitting laser (VCSEL) [23] [24]. Electrodes could also be considered to deposit at the base before each physical block (for dielectrophoretic mixing ) or in place of the physical blocks to be used as dielectrophoretic droplet traps (see Figure 4). Dielectrophoresis is the motion of polarizable particles in a non-uniform electric field. By making use of the polarizability of aqueous 10
![droplets, dielectrophoresis could significantly aid in the mixing and/or detection and trapping of micro-droplets [25] [26].](/docs-images/86/94439547/images/25-0.jpg "Figure 4: Dielectrophoresis particle trapping - Dielectrophoresis illustration (left) and polarizable particle trapping (right) [25")
![]. 1.2.2.3 Droplet Mixing One development of droplet technology in the past few decades was to produce droplets with alternating compositions to perform certain chemical reactions.](/docs-images/86/94439547/images/25-1.jpg "One of the issues with most microfluidic applications is the lack of fluid diffusivity due to laminar flow in microchannels [27].")
25 droplets, dielectrophoresis could significantly aid in the mixing and/or detection and trapping of micro-droplets [25] [26]. Figure 4: Dielectrophoresis particle trapping - Dielectrophoresis illustration (left) and polarizable particle trapping (right) [25] Droplet Mixing One development of droplet technology in the past few decades was to produce droplets with alternating compositions to perform certain chemical reactions. One of the issues with most microfluidic applications is the lack of fluid diffusivity due to laminar flow in microchannels [27]. To overcome this issue, different channel geometries have to be created to integrate a droplet generator with channels that promote droplet fusion and microfluidic mixing. Microfluidic mixing can be achieved through several different methods depending on the desired application. Hydrodynamic focusing achieves fluid mixing through different numbers of inlet channels and channel branching essentially representing the branching of a vascular system. Pulsed flow mixing injects different samples at the same inlet to increase interfacial area and diffusion mixing time [28]. Geometric mixing complicates the geometry of the channel to induce chaotic flows and thus mixing in the channels. An example of geometric mixing can be seen below in Figure 5. 11
26 Figure 5: Serpentine laminating micromixer- A serpentine laminating micromixer composed of a series of F-shaped channel units [28]. Electroosmotic mixing uses zeta potential placed on the channel walls leading to a more complex flow pattern that induces fluid mixing [28]. Electroosmotic mixing could be used to mix different fluids to form the droplet phase in a microdroplet generator. Droplet mixing is a popular method because of the surface tension effects and isolation between the droplet and carrier fluid and the mixing results from meandering channel geometries after droplet formation are desirable for chemical and biological applications. A final method of microfluidic mixing is with particles such as magnetic beads with fluctuating motions causing fluid stirring and subsequently mixing Reagents in Microdroplets Microdroplets open many potential opportunities for chemical and biological research by providing an isolated vessel for different species or reactions. One of the first examples of microdroplets came in Kahn s experiment with engulfed Mycobacterium tuberculosis being injected into guinea pigs in 1941 [29]. Since this experiment and other experiments in the mid 1900 s, microdroplets have been primarily used as isolated reaction containers 12
27 for biological and chemical testing. Microdroplets have the potential to be used in high throughput experiments to perform thousands of tests with a small amount of fluid on a micro scale device. The containment of single cells in microdroplets is an important potential application. Joshua Lederberg produced one of the first examples of utilizing microdroplets for selfcontained reactions by capturing single cells in droplets in 1954 [10]. He captured the single cells using paraffin oil and injecting a microbic suspension. The cells were isolated by repeatedly flushing the oil in and out of a capillary pipette. Lederberg eventually hoped that microdroplets could be used for any experiments requiring a small culture volume [11]. Aqueous droplets can be filled with buffer solutions, reagents, or even magnetic beads. These interior products can be extracted and analyzed after droplet formation using techniques such as flow cytometry [30]. One major benefit of this testing is the high throughput of droplets which enables many tests. Another example of containment in microdroplets is the addition of reagents or samples for diagnostic testing. The injection of reagent into the droplet is difficult due to the asymmetric shear stress at the inlet boundary [31]. Reagent injection using the merging of two phases within a droplet is an efficient method that prevents early contamination and results in a high synchronization rate. A T junction design using an expanded channel directly after the T junction droplet formation can be seen below in Figure 6. 13

28 Figure 6: Droplet mixing through channel merging- Schematic of the droplet merging channel a) conventional T-junction b) T-junction with expansion. ΔP in is the interfacial pressure difference between the oil and DI water [31]. Since the fluids do not mix, the droplets are contained in a highly controlled volume with negligible environmental disturbance because the surface tension forces between the immiscible fluids resist against foreign objects entering the microdroplet [15]. Thus the microdroplets are able to act as micro-reactors when mixing chemicals [15] Digital Microfluidics Digital microfluidics is the control of micro scale droplet volumes over open arrays of electrodes that allow for several different droplet control techniques which were discussed in section [32]. However, digital microfluidics can achieve this control without utilized the closed channel configuration that is typical of microfluidics channels. The open plate configuration of digital microfluidics does not include the difficulties that come with 14
29 valves, pumps, and the clogging of channels [33]. On the other hand, the open plate configuration experiences challenges with evaporation of the experimental fluids and places greater emphasis on the surface fluid interactions. Since digital microfluidics moves and controls microdroplets, the tendency of droplets to stick to surfaces due to favorable surface tension forces hinders the function of digital microfluidic devices [33]. Surface and fluid considerations to limit this effect are of great importance in digital microfluidics. One application of moving droplets is for use in analytical chemistry for cell based assay diagnostic testing. A lab on a chip microfluidic platform was created that functioned as a mammalian cell culture device [34]. This cell culture device integrated cell seeding, growth, and attachment and used electrowetting to maintain cell culture media [32]. A cell based culture device can be applied to a diagnostic device to form a cell based testing assay. Barbulovic created the first cell based assay utilizing microfluidics that merged human leukemia lymphocytes with varying surfactant concentrations [35]. Different dye doses were used to quantify cell viability which resulted in a sensitivity 20 times higher than in conventional macroscopic assays [32]. This device paved the way for the use of digital microfluidics and microdroplets in cell based assay diagnostic research Commercial Applications of Droplet Microfluidics As progress continues to be made in microdroplet research, several key applications with marketable breakthroughs have been developed. These developments make improvements on current testing methods using microdroplet technology. 15
30 Digital PCR Since the immiscible fluids do not mix, microdroplets are contained in a highly controlled volume with negligible environmental disturbance and able to act as isolated microreactors when mixing chemicals [15]. This has led to breakthroughs in biology and chemistry, such as the invention of digital droplet Polymer Chain Reaction (ddpcr) [22]. PCR is a typical fluidic or microfluidic process that uses electrophoresis to separate DNA based on the surface charge (zeta potential, specifically) [36]. By using droplets for this PCR process, many reactions can be done at the same time with high precision and efficiency. Droplets run high numbers of reactions at the same time through lining up microdroplet generators in parallel. Both chemical reactions and thermal cycling increase in efficiency due to the high surface-to-volume ratio [22]. Another use of ddpcr is in the agricultural sector performing routine analysis for food and feed products more efficiently. The current gold standard is real time quantitative polymerase chain reaction (qpcr) which does molecular analysis on genetically modified organisms (GMO) in the food products. However, ddpcr could detect very small numbers of DNA targets which qpcr is unable to do. Additionally, ddpcr has a similar sensitivity to current qpcr methods while having advantages in cost, throughput, relative quantification of targets, and a higher dynamic range for use [37]. Since droplets can run high number of reactions in a short period, droplets are often used in DNA or RNA diagnostic assays to conduct the high number of required tests. DNA or RNA samples are extracted from tissues while PCR reactants are enclosed within the microdroplets [38]. The droplets are exposed to different wavelengths of light which induce different electrophoretic visible color changes to the droplets. The different types of DNA 16
![or RNA can be identified based on the corresponding color change of the droplets [38]. This process can be seen below in Figure 7.](/docs-images/86/94439547/images/31-0.jpg "Figure 7: Work flow for DNA assays- Overview of the work flow used for the DNA-quality assay.")
31 or RNA can be identified based on the corresponding color change of the droplets [38]. This process can be seen below in Figure 7. Figure 7: Work flow for DNA assays- Overview of the work flow used for the DNA-quality assay. (A), An aqueous phase containing DNA extracted from paraffin-embedded tissues and PCR reagents is compartmentalized into droplets before thermocycling. (B), The mixture contains 2- color TaqMan probes [FAM (excitation λ, 494 nm; emission λ, 522 nm) and VIC (excitation λ, 528 nm; emission λ, 554 nm)] at 2 concentrations (0.16 μmol/l and 0.2 μmol/l) to identify 4 kinds of DNA according to size (C, D) [38] Dolomite Microfluidics Dolomite is an international microfluidic technology company based in the United Kingdom. They conduct product development in devices ranging from microdroplet generators, microfluidic mixers, double emulsion devices, and microfluidic device customizations [30]. The Dolomite double emulsion system uses a glass based microfluidic device to produce monodisperse W/O/W emulsions. The microdroplet generator devices 17
32 designed at this company are used for sample encapsulation, drug delivery, and bulk precision manufacturing of emulsion for foods [30] Microdroplet Emulsions A final development in microdroplet microfluidics is the formation of water in oil in water (W/O/W) and oil in water in oil (O/W/O) microdroplet emulsions. Both types of emulsions have potential to be used in pharmaceutical applications especially in drug delivery systems due to the monodispersity of the droplets [39]. W/O droplets are obtained on hydrophobic microchannels (PDMS or treated coating on glass) while O/W droplets are obtained on hydrophilic microchannels (treated PDMS or glass) [40]. These devices are connected in series to produce the W/O/W or O/W/O emulsions [40] Formation of Microdroplet Emulsions Microdroplet emulsions are formed using a T junction channel geometry [40]. For this T- junction method, the dispersed phase is broken up by one perpendicular continuous channel at a T-junction. The first T-junction creates W/O droplets at a hydrophobic junction that then move through an outlet channel and flow into a second hydrophilic T junction. Here the W/O microdroplet is sheared off and forms a W/O/W emulsion (see Figure 8 below). 18

33 Figure 8: Formation of W/O/W microemulsions in a T junction- The formation of W/O/W microemulsions at a second T-junction after W/O microdroplets are formed and flow down the dispersed phase channel [40]. The different hydrophilic and hydrophobic surfaces of the T junctions are important to produce opposing types of microdroplets. The hydrophobic surface either uses a standard PDMS surface or glass with a deposited hydrophobic film. For example, Okushima used a silane-coupling agent to produce a hydrophobic surface on quartz glass [40] Microdroplet Emulsion Device Fabrication The design now will be solely for generating both O/W and W/O micro-droplets in separate microdroplet generators. The next step will be moving on to manipulating and combining the droplets in a single integrated microdroplet generator. This droplet generator design compares different geometries of a T-junction technique to break up droplets from two immiscible fluids [15]. For simplicity, the immiscible fluids will be water and light mineral oil (Fisher Scientific) with viscosities of approximately 1 cst and 33 cst, respectively [41]. These viscosities are consistent with literature values and viscosity ratios for producing W/O microdroplets. Okushima successfully produced O/W microdroplets on the Pyrex glass with a viscosity ratio of 1:56.7 meaning that a ratio of 1:33 should be able to 19
34 produce O/W microdroplets provided the other parameters of the experiment remain consistent [40]. A more in depth discussion of viscosity ratios for microdroplet formation can be found in section Argon Plasma- PDMS Microdroplet Generator This approach for producing W/O/W microdroplet emulsions is unique in that the entire device will be made of PDMS microdroplet generators. Current literature methods use glass or a treated PDMS surface for the hydrophilic microdroplet device [40]. PDMS has a naturally hydrophobic surface with contact angles using the sessile drop method of 120 [42]. This type of surface is particularly well suited for creating W/O microdroplets because the oil coats the PDMS channel surfaces and the water microdroplets are contained in the center of the channel. The PDMS surface can be altered using argon plasma technology to be hydrophilic for 3-10 hours before it slowly recovers to its intrinsic hydrophobic state [43]. A detailed breakdown of the hydrophobic contact angle recovery of PDMS can be found in Appendix D. The temporary hydrophilic PDMS surface allows for a window of opportunity before the surface returns to a hydrophobic state to create O/W droplets on the hydrophilic PDMS channels. When integrated with a standard hydrophobic PDMS device, the two devices can create water in oil in water(w/o/w) emulsions. This method of using a hydrophilic PDMS device allows for quicker fabrication and a lower cost microdroplet generator than current methods such as glass or treated PDMS surface microdroplet generators. 20
35 1.3 Organization This thesis divides the application research of microdroplet emulsion generators into five chapters. Chapter 2 describes the development of PDMS microdroplet generator technology and the standard operating procedures established to manufacture a PDMS microdroplet generator at Cal Poly. Chapter 3 shows the preliminary experimental procedures including the validation of W/O microdroplet generation on a hydrophobic PDMS device, the development of a single device hydrophobic PDMS microdroplet generator, and a stacked devices PDMS-Glass microdroplet generator that produces both W/O and O/W droplets on a single integrated PDMS-glass device. Chapter 4 discusses a PDMS stacked devices microdroplet generator where both devices are comprised solely of PDMS. The device is divided into two devices for separate testing and conclusions due to the complexity of full device testing. This thesis is summarized in Chapter 5 where recommendations for future research are proposed. 21
36 Chapter 2. Methods 2.1 Introduction PDMS devices are excellent choices for microfluidics applications due to their ease of use and fabrication, cost, and they can be rapidly prototyped. PDMS also has a tolerance of 1nm for molding features, making it an ideal material candidate for forming microfluidic geometries [44]. 2.2 PDMS Microdroplet Generator Fabrication Due to the micron-sized features of the design, the device can be microfabricated oncampus only in the Cal Poly Micro-Fab Lab with the permission of Professor Savage. The testing was completed in the Biofluidics Research Lab of the Cal Poly Advanced Technology Lab with the permission of Professor Clague Soft Lithography Silicon Wafer Processing Soft lithography is a means of processing microfluidic devices out of PDMS with performing expensive procedures in silicon or glass structures. PDMS is favored for use in research because it is opaque for optical applications, cheap, more flexible, and easier to use than other polymers [44]. PDMS also can reproduce channel geometries from a replica modeling on a silicon wafer with a tolerance below 1 nm [44]. The full processing procedure for soft lithography in the Cal Poly Lab can be found in Appendix E. Table 1 below describes the customizations made to the processing protocol to fabricate a specific channel depth of 65µm. The customizations are based on processing standards from the MicroChem Data sheets for negative photoresist SU soft lithography. 22
37 Table 1: Customizations for Channel Depth from MicroChem specification sheets for Wafer 2 65 um Depth MicroChem Range Develop Time 8 minutes 20 seconds Soft Bake 65 C, 1.5 minutes 95 C, 7.5 minutes Post Exposure Bake 65 C, 1.5 minutes 95 C, 6.5 minutes Exposure Energy 185 mj/cm 2 Spin Speed 2,250 RPM Hard Bake 150 C, 5 minutes The exposure step in soft lithography is an important step that defines the channel geometry found in the photoresist. The exposure time is critical for fabricated clean, sharp features in the photoresist. The exposure time was calculated using the aligner exposure energy, the power from UV light and the filter rate of a glass filter [14]: 185 mj cm mJ s [ cm 2 ] = 27.6 seconds Where 185mJ/cm 2 is the aligner exposure energy, 15.2mJ/s/cm 2 is the power from UV light, 0.9 is the amount of UV light that moves through the photolithography mask, 0.7 is 23
38 the amount of UV light that moves through a glass filter, and 0.7 is the amount of UV light that moves through a glass mounting plate [14]. A profilometer was used to measure the SU8 extrusions for channel molding to obtain an experimental value for the channel depth. Since PDMS imprints on photoresist with a tolerance of a 1 nm feature size, the height of the baked photoresist directly represents the channel depth in the microfluidic devices. The experimental data and analysis for the profilometer testing can be found in Appendix A. The experimental channel height was 75.0µm which was 15.38% error from the expected channel height of 65µm. PDMS is a cross linked silicon rubber. These devices were made with Sylgard 184 curing agent and base agents with a 10:1 ratio of base to curing agent. The devices consist of a thick top PDMS layer that contains fluid inlets. This layer needs to be at least ~3.5mm to maintain enough friction in the tygon tubing to stay in the inlet [14]. The bottom layer is a thin 1mm layer of PDMS. The reason that two layers of PDMS are used together is to maintain a same surface boundary within the interior of the device. This prevents droplet formation from being influenced by surface reactions from two different surfaces [45]. The thick layer is created by pouring uncured liquid polymer over the silicon wafer mold while the thin layer is created by pouring uncured liquid polymer into a silicon wafer petri dish with a radius of 5.5cm. The other consideration of fabricating PDMS devices at Cal Poly is the total thickness of the microdroplet generator must be lower than ~ 12 mm in order to remain in the working distance of the Lab Smith inverted microscope using for recording testing data [14]. The top PDMS layer was made with a target thickness of 4mm in mind while the thin PDMS layer had a target thickness of 1 mm [14]. The volume of PDMS needed for each 24
39 PDMS layer was calculated with the equation for the volume of a cylinder πr 2 h where r is the radius of the petri dish (55mm) and height is the target thickness of the PDMS layer. The breakdown of required volumes for target PDMS layer thickness can be seen below in Table 2. Table 2: PDMS Layer Thicknesses and Volumes Target Volume Elastomer Base Curing Agent Volume Thickness (mm) Required (cm 3 ) Volume (cm 3 ) (cm 3 ) 1mm mm After PDMS mixing, the uncured liquid polymer was poured over the silicon wafer SU8 mold to create the device micro-channels. The uncured PDMS was planarized in the negative resist spin-coating machine in the Cal Poly Microfabrication Lab. The mixture was either cured in an oven at 70 C for at least 3 hours or left at room temperature ~25 C for at least 48 hours [14]. The PDMS is bonded using an argon plasma device. The surface of the PDMS to be bonded is first treated with scotch tape to remove particulate. The bonded surface is then exposed to an argon plasma which renders the microchannel surface temporarily hydrophilic. The contact angles showing hydrophilicity can be found in Appendix D. The different layers are set together which is left to bond for minutes. Data for bond times for PDMS can also be found in Appendix D. For hydrophobic W/O devices, the bonded devices are post plasma baked at 75 C for at least three hours [14]. The hydrophilic devices are not baked 25

40 to maintain hydrophilicity and are tested within a time window of 1-5 hours of where the surface has a hydrophilic contact angle. A detailed breakdown of PDMS contact angles after argon plasma treatment can be found in Appendix D. Figure 9 shows an example of a hydrophilic water droplet on a PDMS surface measured using a goniometer in the Cal Poly clean room. Figure 9: Sessile drop contact angle measurement- An aqueous water droplet on a flat PDMS surface with a contact angle of 39.5 /42.1. A goniometer was also used to establish that the light mineral oil used would not absorb into the PDMS. PDMS is both gas permeable and open to absorbing small hydrophobic molecules [46]. After comparing the channel sizes with and without oil, along with a contact angles, minimal wetting was reflected, illustrating reduced absorbance [14] Photomask Design From literature, microfluidic droplets have been shown to range anywhere from 100 nm to 100 µm and larger at approximately the same size as the channel diameters at the outlet of the droplet generator junction [22] [15]. Even though researchers have could achieve 26
41 micron and sub-micron droplet sizes, channel widths of >20µm are used to avoid the risk of PDMS particulation within the device [47]. PDMS particulation is when small chunks of PDMS break off from the inlet and flow through the microfluidic channels. A channel width large enough to allow these chunks to flow through the device without clogging the channel is an important design consideration. The initial thinking in the Device 1 design was that both O/W and W/O droplets could be produced in consecutive T junctions on a single device. Device 2 was simply standard two channel T-junctions to verify hydrophobic droplet creation for the first part of device testing. Device 3 included a double inlet that was the only difference from Device 1 that would allow fluid mixing in the first inlet that could be used in potential future applications. The most important part of designing the different devices was deciding the size of the microfluidic channels. The Capillary number is a dimensionless number that describes viscosity, flow rate, and channel sizes in a microfluidic device. Droplet formation in T-junctions occurs at specific Capillary numbers that are detailed below, allowing the reverse calculation of channel dimensions from an ideal Capillary number Capillary Number Considerations for Microdroplets The Capillary number was used to discern between viscous forces and surface tension, eliciting rough estimates for the basic dimensions and flow rates of the microdroplet generators. The Capillary number relationship can be seen below. For the T- Junction: Ca = Q cμ c 2ywh Where Qc is the flow rate of the continuous phase fluid, μ c is the viscosity of the continuous phase fluid, γ is the surface tension between water and the mineral oil (with or without 27
42 surfactant), w is the channel width, and h is the channel height [14]. Typical values for a capillary number in previous testing [14] for W/O microdroplets can be seen below. I. For droplet dripping (droplet break-up near the junction): 0.2 > Ca > 0.1 II. For droplet jetting (droplet break-up at the end of a stream): Ca > 0.2 Initially, for calculating the device channel dimensions, the optimal Capillary number was determined from a literature survey and previous lab results to be 0.05 for W/O droplets and for O/W droplets [14,42,30,48,49]. The Capillary number is different for W/O and O/W microdroplets because they have a different continuous phase fluid viscosity. Ca was estimated through a literature survey and verified experimentally in the Cal Poly lab to form droplets from was within to for oil flow rates less than 0.5 ml/h in the T-junction model for hydrophobic W/O droplet production given a constant surface energy of 0.86mN/m, a channel width of 200µm, and a continuous phase viscosity of 33cSt [14]. Devices on the low end of the Ca range in the previous lab testing at Cal Poly had a larger cross sectional channel area, smaller volumetric flow rate, and a small continuous phase viscosity [14]. Devices on the high end of the Ca range in previous lab testing at Cal Poly had a smaller cross sectional channel area, larger volumetric flow rate, and larger continuous phase viscosity [14]. Capillary numbers for successful O/W and W/O droplet formation in T-junction microfluidic devices can be seen below in Figure 10 and
43 Capillary Number Capillary Number O/W Capillary Numbers [12] [38] [36] [48] Reference Figure 10: Capillary numbers in O/W microdroplets- Capillary numbers that result in successful O/W microdroplet formation using a T-junction microfluidic device 0.25 W/O Capillary Numbers [34] [24] [33] [50] Reference Figure 11: Capillary numbers in W/O microdroplets- Capillary numbers that result in successful W/O microdroplet formation using a T-junction microfluidic device The next step in designing the microdroplet generator was determining dimensions for the microfluidic channels using the optimal Capillary numbers. A key factor in selecting channel size is the size of droplets required for future device applications. Channel size and 29
44 continuous phase fluid flow rate have direct relationships with droplet size. Droplets can be made over a range of values centered around the channel width by customizing the continuous phase fluid flow rate. For potential microdroplet applications for this device, the desired droplet size for potential PCR microdroplet applications was determined to be µm [50]. The Okushima paper created inner droplets with a size of ~50 µm and 85 µm for the outer droplet for W/O/W emulsions [40]. From these guidelines, the T junction dimensions were selected to be 50x50 µm and 85x85 µm. These values give flexibility to create droplets in the ideal range for PCR applications and also is in line with the Okushima paper. A photolithography mask allows for a number of designs to be fabricated. This allowed for some variations of the designs between Device 1, 2, and 3. The channel widths were further specified and set as follows, in the table below: Table 3: Channel dimensions for Devices 1, 2, and 3 Device 1 Device 2A Device 2B Device 3 First Junction 50x50 50x50 85x85 50x50 size (um) Second 50x85 N/A N/A 50x85 Junction Size These widths represent four different models for the droplet generator (Device 1, 2A, 2B, and 3). Device 1 and Device 3 each have four duplicates on the photolithography mask. Device 2A and 2B each have two duplicates on the photolithography mask. This allows for 30

45 12 different devices to be fabricated with each PDMS molding step. Device 1 and Device 3 have two different T junctions for droplet formation, a 50x50 um junction followed by an 85x85 um junction. Device 2A and 2B have only a single T-junction Device 1 Double T Junction As stated in the section 2.2.2, the goal in Device 1 s design was that both O/W and W/O droplets could be produced in consecutive T junctions on a single device. This thinking led to the first stage of completed device production. PDMS slabs poured over the Device 1 design (See Figure 12 below) were cut off the wafer, bonded to a thin 1mm PDMS slab to encase the microfluidic channels, and bonded to a glass slide for support and viewing purposes. Figure 12: Device 1 channel geometry- Double T-junction channel geometry with single inlets for Device 1. Q o is the flow rate for oil from inlet A and Q w is water flow rate from inlets B and C. Q drop is the flow rate for the microdroplets into the outlet channel D. The spacing inbetween the ticks on the Q drop channel is 100 µm. 31

46 Figure 13: Device 1 T junction sizes- T junction channel widths for Device 1 with fluid flow rates and inlet references from Figure 10. These figures show the final geometries for the four Device 1 geometries found on the photolithography mask. The flow rates are the initial thinking for testing to create W/O/W emulsions on a single device. Also, the inlets as seen in Figure 10, were based off the industry standard for microfluidics from the Quake lab microfluidics foundry at Stanford. The inlets with triangles inside the punch hole prevent the collapsing of the inlet during plasma bonding by forming pillars inside the inlet without inhibiting fluid flow [47] Device 2 Single T Junction Device 2 was designed to validate previous testing methods with deionized water and mineral oil in the Cal Poly testing lab. They would also be used to test microdroplet formation in T-junctions with 50x50 µm and 85x85 µm square channel junctions. These junctions are the same size as the junctions in Device 1 and Device 3. This allows for the testing of what Capillary numbers, flow rates, and flow rate ratios are ideal and functional for PDMS T-junctions in a simpler testing system before moving on to testing double T- 32

47 junctions in Device 1 and 3. The photolithography mask has two Device 2A geometries with 50x50 µm square junctions and two Device 2B geometries with 85x85 µm square junctions. The device geometry for Devices 2A and 2B can be seen below in Figure 14. Figure 14: Device 2 channel geometry- Device 2A has channel widths of 50 ums and Device 2B has channel widths of 85 ums. Fluid inputs are labeled A and B, while the fluid output is located at C Device 3 Double T Junction with Mixing Potential As stated in the section 2.2.2, the goal in Device 1 s design was that both O/W and W/O droplets could be produced in consecutive T junctions on a single device. Device 3 differs from Device 1 in the form of an additional inlet the flows into the first T junction. This additional inlet has potential to be used as a sample inlet to mix a sample and carrier fluid such as water into the first T junction. These two inlets flow into a serpentine channel to induce fluid mixing before flowing into the first T junction [27]. For the purposes of testing these devices for current use, only one of inlets B or C in Figure 13 will be used. It will be an input for deionized water to form W/O/W emulsions on Device 3 and will essentially 33

48 have no function difference to the Device 1 design in testing. The photolithography mask includes four Device 3 designs and the channel geometry can be seen below in Figure 15. Figure 15: Device 3 channel geometry- The twisting inlet was created for any potential mixing applications in the future. The spacing in between the ticks on the Q drop channel is 100 µm. Inlets B and C will contain either a sample or water that mix in subsequent channels in future applications of Device Engineering Specifications Before designing an optimal droplet microfluidic device, it is important to recognize the parameters of the project to set reasonable engineering specifications, given a set of lab requirements. 34
49 Table 4: Engineering Specifications for Cal Poly Microdroplet Generators Requirement (qualitative) 1. Device able to be manufactured at Cal Poly 2. Microfluidic device must not leak fluids pumped through the device 3. Generates monodisperse hydrophobic droplets from previously established lab protocols 4. Create hydrophilic PDMS channels 5. Create O/W microdroplets using PDMS hydrophilic channels 6. Transfer hydrophobic W/O microdroplets to a second hydrophilic PDMS device 7. PCR applications require a droplet size of 70-85µm in diameter [50] Engineering Specification (quantitative) a. No structures smaller than 20 microns b. Will be manufactured with Polydimethylsiloxane (PDMS) and SU negative photoresist a. Pressure does not exceed yield strength of plasma bonded surfaces kpa [14] a. Droplets will be approximately the size of the diameter of the outlet junction channel (at 50 and 85 microns) a. Contact angle for argon plasma treated PDMS will be repeatedly demonstrated to be hydrophilic (<70 ) [51]. a. Demonstrate microdroplet formation at Capillary number a. Demonstrate microdroplet formation and transfer at a Capillary number of a. Create monodisperse droplets in the size range of 70-85µm Rationale The minimum feature size is 20um in PDMS microfluidic devices [47] Microfabrication process from the Cal Poly lab uses these materials, easily prototyped High pressure in the microfluidic channels can results in a rupture in the plasma bond sealing the microfluidic device At a low Capillary number, droplet sizes will be on the order of the outlet channel. A hydrophobic base must be established before attempting hydrophilic droplet creation Must have PDMS surface hydrophilicity to create oil in water droplets Droplet formation needs to be validated Droplet formation needs to be validated Droplet size must be the proper size for potential applications of the microfluidic device 35
50 Chapter 3. Preliminary Experiments 3.1 Validation of Hydrophobic PDMS Microdroplet Generator Devices Introduction The first step of creating a W/O/W microdroplet emulsion in the Cal Poly Lab was validating previous microdroplet protocols for W/O microdroplet formation. It is important to confirm the usability of all the laboratory tools that will be needed including the Lab Smith inverted microscope, the Harvard Apparatus 11 syringe pumps, mineral oil, deionized water, Span 80 surfactant, and the soft lithography processing tools Experimental Setup The testing setup involved using a 100µL syringe with a diameter of 1.46mm for the dispersed water phase and a 250uL syringe with a 2.3mm diameter for the oil continuous phase. The syringes are connected to Tygon tubing that has an outer diameter of 800µm and an inner diameter of 300µm which is connected to the microfluidic device. The syringe pumps allow for constant automated flow rate control. Before testing each device, the channels are coated with oil by manual flooding the microfluidic channels with mineral oil to prevent any water from wetting the channel edges in the hydrophobic device. The Lab Smith inverted microscope is used to view the fluid flowing through the microfluidic channels and capture images and videos of the testing process. The full testing setup can be seen below in Figure
 The syringe inlet for both water phases uses a 100µL glass syringe, a 3 way luer lock valve for refilling, and a 1mL syringe with refilling")
51 Figure 16: Lab testing setup- a) Two Harvard Apparatus syringe pumps that are deionized water inlets to allow for manual control of different flow rates for the two water inlets b) One Harvard Apparatus syringe pump for mineral oil flow rate control c) The syringe inlet for both water phases uses a 100µL glass syringe, a 3 way luer lock valve for refilling, and a 1mL syringe with refilling fluid d) The syringe inlet for the mineral oil uses a 250µL glass syringe, a 3 way luer lock valve for refilling, and a 3mL syringe with refilling fluid e) Tygon tubing with an outer diameter of 800µm and an inner diameter of 300µm transfers the fluid from the syringe pumps to the microdroplet generator f) The Lab Smith inverted microscope with LED light to view the microfluidic channels g) Outlet fluid beaker to contain fluid pumped through the microfluidic device. 37

52 Surfactants The high quality mineral oil from Fisher Scientific helped maintain immiscibility between the oil and deionized water and Span 80 surfactant from Sigma Aldrich significantly increased the control of the droplets sizes and droplet stability. The Span 80 surfactant was mixed with at least a 2wt% fraction in the mineral oil phase to exceed the critical micelle concentration. These changes helped maintain distinct, digital droplets that do not simply fuse once generated, avoiding droplets fusing and mixing as seen in Figure 17. Figure 17: Microdroplets fusing without the use of surfactant- Droplets fusing in outlet of Batch 1 flow-focusing generator (no surfactant). The different sized microdroplets indicate that they are fusing and forming larger microdroplets. [14] Contact Angle Verification An important consideration when testing hydrophobic W/O microdroplets is the contact angle of the PDMS surface. To create W/O microdroplets, the surface needs to be hydrophobic to repel the deionized water and allow the mineral oil to coat the PDMS surface. PDMS is a naturally hydrophobic material, but the argon plasma used to bond 38
53 PDMS surfaces together renders the surface of the PDMS hydrophilic. To restore the hydrophobicity of the PDMS surface, the microdroplet devices are baked in a curing oven at 70 C for at least three hours. Separately cut out pieces of PDMS are plasma treated and baked to represent the conditions inside the microdroplet device because in device testing of contact angle using the sessile drop method is not possible at Cal Poly. If the PDMS has a confirmed hydrophobic surface contact angle (>90 ) the devices are ready to be used for testing Experimental Procedure Each test on a microdroplet device had the same testing procedures. By maintaining a set range of flow rate ratios and Ca during testing, a standardized testing protocol was maintained. The optimal capillary number was the starting point for each test. The flow rate was then increased until droplet formation stopped and decreased until droplet formation stopped to confirm a range of flow rates with microdroplet formation. Ca was calculated for each flow rate and functional micro-droplet ranges were determined based on Ca, flow rates and flow rate ratios for each device. These tests began at a Capillary number of 0.05 which was confirmed as the optimal value by a literature review and the previous Cal Poly Lab work [14] Hydrophobic Device: Results The microdroplets were successfully verified and were consistent with previous Cal Poly lab results. A Capillary number range of to 0.2 was confirmed with the testing of 100x100 µm T-junction devices created from the silicon wafer used in previous Cal Poly lab work [14]. Figure 18 and 19 show the creation of microdroplets in these devices. 39
 and a mineral oil continuous phase (B) with a continuous phase flow rate of 0.")
54 Figure 18: W/O microdroplet formation in a T junction- W/O microdroplet formation in a 100x100 µm square T-junction using a deionized water dispersed phase (A) and a mineral oil continuous phase (B) with a continuous phase flow rate of 0.05mL/hr and flow rate ratio of 80:1 (continuous: dispersed) 40

55 Figure 19: Microdroplets flowing in an outlet channel- Microdroplets flowing in the outlet channel of a microdroplet generator with a continuous phase flow rate of 0.05mL/hr and flow rate ratio of 40:1 (continuous: dispersed) Conclusions With the confirmation of W/O microdroplet formation from previous microdroplet generator device designs, it was time to move on to testing the Device 1 channel geometry. The lab procedures were sound and showed that microdroplet formation was possible. This testing step helps eliminate possible sources of error should microdroplet formation not be achieved in future testing steps. 41
56 3.2 Single Device Hydrophobic PDMS Microdroplet Generator The goal with the single device hydrophobic PDMS microdroplet generator was to create both W/O and then subsequently O/W microdroplets that would form W/O/W emulsions. A single device solution would be a simple solution to the formation of W/O/W emulsion as compared to a multi device microdroplet generator Single Device Fabrication The single device microdroplet generators have the same fabrication methods as the verification testing devices and previous Cal Poly lab manufacturing for hydrophobic PDMS devices. The device is composed of two PDMS layers that enclose the microfluidic channel which are bonded to a glass slide for viewing and structural support Assembly Protocol 1. Pour mixed, uncured PDMS polymer over the silicon wafer mold. 2. Pour mixed, uncured PDMS polymer into a petri dish to form a thin 1mm PDMS layer 3. Cure all the PDMS in a curing oven at 70 C for 90 minutes [14] 4. Use a razor blade to cut out a square around each single device geometry and a matching square of similar size out of the thin 1mm PDMS. 5. Use a syringe tip to punch through the inlets in the device geometry PDMS slab, going from the side with the molded channels completely through to the opposite side. (This keeps any PDMS particulate from the syringe tip punching from ending up on the channel side of the device where the fluid will be flowing.) 6. Use scotch tape to remove particulate from every surface that will be bonded together 42
57 7. Treat the surfaces to be bonded with the argon plasma for 5-10 seconds, and stick together, taking care to lightly press out any air bubbles between the layers 8. The side with the molded channels on the device geometry PDMS slab should be bonded to the top surface of the thin 1mm PDMS layer (This side was not on the bottom of the petri dish where it could conform to particles on the dish surface). 9. Bond the two PDMS layers to the glass slide. The thin 1mm PDMS layer should be in the middle with the device geometry PDMS slab on top and the glass slide on the bottom. 10. Cure the bonded PDMS device in the curing oven at 70 C for at least 180 minutes to restore the hydrophobicity of the PDMS [14] Testing: Single Device Hydrophobic PDMS Microdroplet Generator The goal of testing the single hydrophobic device to produce both O/W and W/O microdroplets. The device geometry can be seen above in Figure 10. The devices were tested with deionized water for the two water phases and mineral oil with 2wt% Span 80 surfactant added to help improve droplet stability. The testing starting point was at a Capillary number of 0.05 which was the target for W/O microdroplets for the first T- junction. This value combined with the channel geometry, continuous phase viscosity, and assumed surface tension gave a starting continuous phase flow rate of 0.04ml/hr for microdroplet formation in the first 50x50µm T-junction from the Capillary number relationship (Section ). The Capillary number of for O/W microdroplet formation at the second T-junction gave a starting continuous phase flow rate of 0.06ml/hr for the second water phase. 43

58 3.2.3 Single Device: Results The goal of testing the single hydrophobic device was that both O/W and W/O droplets could be produced in consecutive T junctions on a single device. However, it was determined that the hydrophobic nature of the channel would not allow the water to wet the PDMS channels and contain the oil in droplets in the center of the channel. The hydrophobic nature of the PDMS surface prevents the continuous water phase in the second T junction from shearing off the dispersed oil phase into droplets. The oil is hydrophobic and coats the PDMS walls. Second, the two water phases were not capable of forming separate stable water emulsions. The two-different water flows eventually merged as they flowed down the outlet channel. The merging of the two water flows at the second junction can be seen in Figure 20 below. Figures 20: W/O microdroplets merging in Device 1- Both images show the merging of a water droplet from the first T junction in Device 1 (a) with the continuous water phase that enters the second junction (b) in the single microfluidic device. This merging of water phases necessitated the addition of a surfactant to one of the water phases to maintain emulsion stability. The continuous water phase entering the second T 44
59 junction added sodium dodecyl sulfate (SDS) at the critical micelle concentration of 8.2mM per Okushima [40]. The problem of emulsion stability was solved with the SDS as demonstrated in the emulsion stability testing photos below in Figure 21. The devices produced solely W/O microdroplets, no O/W microdroplets were formed. In the first T- junction, W/O microdroplets were formed at a range of Capillary numbers of to 0.20 with flow rate ratios (continuous: dispersed) ranging from 5:1 to 5.5:1. In the second T-junction, W/O microdroplets were also formed at a range of Capillary numbers of to with flow rate ratios (continuous: dispersed) ranging from 1:40 to 7:1. 45

60 Figure 21: W/O microdroplet formation in Device 1- These photos show the formation of W/O droplets in a hydrophobic PDMS with the Device 1 geometry. The dispersed water phase contains 0.025g of SDS per 10mL of aqueous solution and the oil phase contains 2wt% Span 80 surfactant in mineral oil. These droplets were formed at Capillary number of 0.1 and flow rate ratio of 5:1 at the first T-junction and a Capillary number of and a flow rate ratio of 2.38:1 at the second T-junction. Figure 21a shows the formation of W/O microdroplets at the second T-junction in Device 1. Figures 21b-d show the flow of microdroplets down the outlet channel in the direction designated by the red arrow starting with Figure 21a. These images and testing showed that the W/O microdroplets were stable with the addition of SDS to the continuous water phase flowing into the second T-junction Conclusions The W/O and O/W droplets would not be able to be manufactured on a single PDMS device for one main reason; the hydrophobic PDMS surface is coated with oil and repels the water, 46
61 not allowing water to shear off oil droplets in the second T-junction. The literature survey discovered that single PDMS devices creating two types of droplets are possible, but only with a surface treatment of the PDMS enabling one of the T-junctions to be hydrophilic and produce O/W microdroplets. Unfortunately, Cal Poly does not have the technology for any of these chemical surface treatments for PDMS surface modification which include chemical vapor deposition (CVD), sol gel deposition, and PEO coatings. These surface treatment options will be discussed further in the Chapter 6. Thus, the only feasible surface modification tool available is the argon plasma device which renders the entire microfluidic device temporarily hydrophilic. To properly utilize the argon plasma, the device design changed from a single device to a stacked device with a hydrophobic droplet generator which transfers droplets into a hydrophilic droplet generator. 3.3 Stacked Devices PDMS-Glass Microdroplet Generator The next iteration of the microdroplet generator device was a stacked device with a hydrophobic droplet generator stacked on top of a hydrophilic droplet generator. The key issues this device was trying to resolve was the transfer of hydrophobic W/O droplets from the first device to the second device and the generation of successful O/W droplets in the second device Conceptual Design with a PDMS-Glass Stacked Device Hydrophobic Device Design The hydrophobic device was made in the same fashion as previous hydrophobic devices with a thick 4mm PDMS slab with the imprinted channel geometry of Device 2 (single T- junction) bonded to a thin 1mm PDMS slab. Before bonding, the outlet channel in the 47
62 hydrophobic device is punched out through the 1mm PDMS slab. Then these two layers are baked in the curing oven at 70 C for at least three hours [14]. The hydrophobic device is then bonded directly onto the top of the hydrophilic device so that fluid can flow down through the outlet of the hydrophobic device and into the inlet of the hydrophilic device. This orientation allows the transfer of microdroplets from one device to the other Hydrophilic Device Design The hydrophilic device consisted of a PDMS slab bonded directly to the glass slide instead of a PDMS-PDMS bonded device. The argon plasma treated PDMS and the glass would both be hydrophilic, so theoretically this would create a feasible environment for hydrophilic droplet production. Once this device is bonded together, it is bonded to the hydrophobic PDMS device and is not baked in the curing oven to maintain the hydrophilic surface Contact Angle and Surface Considerations These microfluidic devices are created using PDMS, which is a cross linking silicone rubber that is particularly adaptable for lab testing. This is due to the ease at which it can be quickly prototyped. Literature demonstrates a number of different surfaces that can also be used to create these W/O/W emulsions that have more easily modifiable surface properties. These surfaces include, but are not limited to: plasma polymerized acrylic acid (PPAA) [48], glass/pyrex glass [30], polyester film [49], and PTFE/PDMS [2] that all produce microdroplets. Contact angles using the sessile drop method on these hydrophilic surfaces to produce the O/W droplet component of W/O/W emulsions can be seen below in Table 5. 48
63 Table 5: Intrinsic contact angles on hydrophilic surfaces Surface Contact Angle Reference PPAA 9.61 (Treated PDMS) [48] Glass 27 [30] Polyester Film 13 [49] Glass bonded to tridecafluorocholorosilane 65 [53] PDMS-Glass Stacked Devices Fabrication The hydrophobic device in the PDMS glass stacked device had an identical fabrication method to previous iterations of the device. The hydrophilic device was composed only of a PDMS layer and a glass slide. Since the whole device was more complex than previous versions, a precise assembly method was established Assembly Protocol PDMS-Glass Stacked Devices are made of four layers (top to bottom): thick 4mm PDMS slab with Device 2 channel geometry, thin 1mm PDMS slab, thick 4mm PDMS slab with Device 2 geometry, glass slide. Figures 22 and 23 will be used to reference inlets and outlets for the assembly protocol. 49


64 Figure 22: References inlets for the hydrophobic Device 2 geometry- Reference inlets and outlets for the hydrophobic device that makes up part of the PDMS-Glass Stacked Device Figure 23: References inlets for the hydrophilic Device 2 geometry- Reference inlets and outlets for the hydrophilic device that makes up part of the PDMS-Glass Stacked Device Assembly Standard Operating Procedures (SOP) 1. Pour mixed, uncured PDMS polymer over the silicon wafer mold. 2. Pour mixed, uncured PDMS polymer into a petri dish to form a thin 1mm PDMS layer. 3. Cure all the PDMS in a curing oven at 70 C for 90 minutes [14]. 50
65 4. Use a razor blade to cut out a square around each single device geometry and a matching square of similar size out of the thin 1mm PDMS. Two Device 2 geometries and one thin 1mm slab of PDMS are cut out for PDMS-Glass Stacked Devices. 5. Punch out Inlet 1 and Inlet 2 in one of the two thick 4mm PDMS slabs that is designated for the hydrophobic device. 6. Bond thin 1mm PDMS slab on top of the other thick 4mm PDMS slab. 7. Punch out Inlet 4 all the way through the thin 1mm PDMS slab (microdroplets from the hydrophobic device will flow through Outlet 1 and into Inlet 4). 8. Bond the thick 4mm PDMS slab with Inlets 1 and 2 punched on top of the thin 1mm PDMS layer and other thick 4mm PDMS slab so that Outlet 1 lines up on top of Inlet Punch out Inlet 3 and Outlet 2 through all three PDMS layers. 10. Post Plasma Bake the three PDMS layers at 70 C for at least three hours. 11. Insert a PDMS plug (use one from previous inlet punches) using tweezers into the Inlet 4 punch hole 12. Plasma treat the channel side of the three PDMS layers (where the plug was inserted) and a glass slide cleaned with isopropyl alcohol (IPA). The plug prevents the argon plasma from moving through the Inlet 4 channel and compromising the hydrophobic device. The plug is inserted before treatment and removed after treatment, but before bonding. 13. Remove the PDMS plug with tweezers and bond the slide to the PDMS layers 14. Do not post plasma bake the finished device 51
66 3.3.3 Testing: PDMS-Glass Stacked Devices Microdroplet Generator Since the production of hydrophobic W/O droplets was validated from earlier research, the testing for this device was divided to achieve the goals of the testing into a hydrophobic and hydrophilic device separately. Both devices utilized the single T junction design seen in either Device 2A or 2B as the only difference between these two was the channel width. The complete device is bonded together in such a way that the droplets formed in the upper hydrophobic device are transferred through Outlet 1 from Figure 22, down, and into Inlet 4 from Figure 23 of the hydrophilic device of the PDMS-Glass device. In the hydrophobic device, a PDMS-PDMS device produced controlled W/O droplets. Previous testing of single T junction hydrophobic devices showed W/O droplets capillary numbers from 0.01 to 0.2 [14]. The target capillary number due to the geometries of my devices for Device 2A and 2B was 0.05 which determined a starting point for flow rates for droplet formation. Since Device 2A and 2B have different channel widths, they have a different starting flow rate. Device 2A had a starting continuous phase flow rate of 0.028mL/hr and Device 2B had a starting flow rate of 0.096mL/hr. The flow rate of the dispersed water phase was matched to the continuous phase for a 1:1 flow rate ratio also as a starting point. The second part of this testing involved a PDMS device that was hydrophilic and capable of producing O/W droplets. After a literature survey looking at potential hydrophilic O/W droplet formation methods, a PDMS-Glass device was manufactured to try and capitalize on the intrinsic hydrophilic nature of glass in surfaced reactions with a continuous water phase and disperse mineral oil phase [52]. The hydrophilic device will be made of a PDMS layer bonded on top of a glass slide. The device needed to be tested directly after plasma 52
67 treatment to utilize the temporary hydrophilic surface properties. The target capillary number for O/W microdroplets was previously determined to be Since Device 2A and 2B have different channel widths, they have a different starting flow rate. Device 2A had a starting continuous phase flow rate of 0.028mL/hr and Device 2B had a starting flow rate of 0.048mL/hr. The flow rate of the dispersed water phase was matched to the continuous phase for a 1:1 flow rate ratio also as a starting point PDMS-Glass Stacked Devices: Results The flow rates of the continuous mineral oil phase and dispersed water phase in the hydrophobic device were manually manipulated to find a starting point where W/O microdroplets were formed. Then they were adjusted until W/O microdroplets were no longer formed to determine a range of flow rates where W/O microdroplets were successfully created. A breakdown of the successful ranges for Device 2A and 2B can be found below in Table 6. 53
68 Table 6: W/O Microdroplet Formation in Device 2A and 2B Device 2A Device 2B Starting Capillary Number Starting Flow Rate (ml/hr) First Droplet Formation Capillary Number First Droplet Formation Flow Rates (ml/hr) 0.04(continuous) 0.04(dispersed) 0.068(continuous) 0.068(dispersed) Lowest Capillary Number Highest Capillary Number Lowest Flow Rate Ratio 1:3 1:3.4 (continuous: dispersed) Highest Flow Rate Ratio 8:1 17:1 (continuous: dispersed) 54

69 Figure 24: W/O microdroplet formation in Device 2A- W/O Microdroplet formation in Device 2A at a Capillary number of with a flow rate ratio (continuous: dispersed) of 1.25:1. Inlet and Outlet references are from Figure 22. Arrows indicate the direction of fluid flow. The next step of was the testing of the hydrophilic PDMS-glass devices. The hydrophilic PDMS-glass devices were not successful in forming O/W droplets. This could be due to a number of issues including surface tension imbalances, fluid viscosities, and surface contact angle. The testing showed the coflow of the mineral oil and water down the continuous channel after the junction. The water phase was not able to shear off the mineral oil into droplets even when the flow rate was increased to a ratio of 100:1 (continuous: dispersed). Coflow of the two fluids can be seen below in Figure
70 Figure 25: Co-flow of mineral oil and water in Device 2A- Co-flow of mineral oil and water in Device 2A at a Capillary number of with a flow rate ratio of 1:1. Inlet and outlet references are from Figure 23. Inlet 4 was only mineral oil as this testing was conducted as an independent hydrophilic device. The arrows indicate the direction of fluid flow. The imbalance in surfaces tension with the PDMS and glass with slightly different contact angles could have contributed to the lack of droplet formation and was determined to be a less than ideal setup for O/W droplet formation as seen by the lack of formation in testing. The surface tension needs to be consistent with two identical surfaces which will eliminate a source of error that could be preventing microdroplet formation. The imbalances have been shown to produce satellite droplets separate from the formation of primary droplets in the literature example seen below in Figure 26 [53]. 56
 The satellite droplets travel to the side of monodispersed primary droplets after generation. The diameters of the primary droplets are 52.9 µm.")
![(Bottom) Under 400 magnification, the monodispersed satellite droplets collected at the output have diameters of 2.8 µm [53]. b) Generation of satellite droplets.](/docs-images/86/94439547/images/71-1.jpg "(Top) During the formation of primary droplets, further extension of the thinned thread causes the formation of satellite droplet.")
71 Figure 26: Satellite microdroplet formation in a flow focusing device- a) Size of satellite droplet under different magnifications. (Top) The satellite droplets travel to the side of monodispersed primary droplets after generation. The diameters of the primary droplets are 52.9 µm. (Bottom) Under 400 magnification, the monodispersed satellite droplets collected at the output have diameters of 2.8 µm [53]. b) Generation of satellite droplets. (Top) During the formation of primary droplets, further extension of the thinned thread causes the formation of satellite droplet. (Bottom) Upon breaking the thread, the tip of the thread retracts while releasing the satellite droplet at the orifice. [53] In this example, a vapor deposition step was used to maintain hydrophobic stability of the glass surface which would be comparable to PDMS. Cal Poly does not have the capability 57
72 to perform a PVD or CVD of ridecafluorocholorosilane or other materials to create surface stability used in this example. For these reasons, the PDMS-Glass hydrophilic device was scratched in favor of a PDMS-PDMS hydrophilic device that has more consistent surface properties Conclusions A PDMS-glass device would have made a simple solution to the growing problem of creating O/W microdroplets using PDMS microdroplet generators. However, due to the potential for surface tension imbalances, a purely PDMS-PDMS microdroplet generator using argon plasma was developed below in Chapter 4. 58
73 Chapter 4. Final Experiment- PDMS Stacked Devices Microdroplet Generator 4.1 Introduction The lack of success in the single device and PDMS-glass device microdroplet generators led to the creation of the third design iteration, the PDMS stacked devices microdroplet generator. This device generator can be easily divided into a hydrophobic and hydrophilic device as with the PDMS glass device to allow for independent device testing. Taking advantage of the hydrophilic state of PDMS after an argon plasma treatment simplifies the process of making O/W microdroplets using only PDMS. 4.2 Conceptual Design PDMS Stacked Devices The third device design iteration consists of a hydrophobic PDMS-PDMS droplet generator stacked on top of a hydrophilic PDMS-PDMS droplet generator. This entire setup is bonded on top of a glass slide for support and viewing purposes. The hydrophilic bottom device is temporarily hydrophilic for up to 10 hours after the argon plasma treatment due to the hydrophobic recovery of the PDMS. A detailed discussion of PDMS hydrophobic recovery from an argon plasma treatment can be found in section 4.4 and Appendix D. The top device is assembled, plasma bonded, and post plasma baked to maintain a hydrophobic surface. The bottom hydrophilic device is assembled and attached to the top hydrophobic device and the supporting glass slide without being post plasma baked. The final assembly of the finished device is directly followed by testing while the bottom hydrophilic device remains hydrophilic within the 10 hours. The full assembly protocol can be found below in Section
74 4.3 PDMS Stacked Devices Fabrication Assembly Protocol 1. Pour mixed, uncured PDMS polymer over the silicon wafer mold. 2. Pour mixed, uncured PDMS polymer into a petri dish to form a thin 1mm PDMS layer. 3. Cure all the PDMS in a curing oven at 70 C for 90 minutes [14]. 4. Use a razor blade to cut out a square around each single device geometry and a matching square of similar size out of the thin 1mm PDMS. Two Device 2 geometries and two thin 1mm slabs of PDMS are cut out for PDMS-Glass Stacked Devices. 5. Punch out Inlet 1 and Inlet 2 in one of the two thick 4mm PDMS slabs that is designated for the hydrophobic device. 6. Bond thin 1mm PDMS slab on top of the other thick 4mm PDMS slab. 7. Punch out Inlet 4 all the way through the thin 1mm PDMS slab (microdroplets from the hydrophobic device will flow through Outlet 1 and into Inlet 4). 8. Bond the thick 4mm PDMS slab with Inlets 1 and 2 punched on top of the thin 1mm PDMS layer and other thick 4mm PDMS slab so that Outlet 1 lines up on top of Inlet Punch out Inlet 3 and Outlet 2 through all three PDMS layers. 10. Post Plasma Bake the three PDMS layers at 70 C for at least three hours. 11. Insert a PDMS plug (use one from previous inlet punches) using tweezers into the Inlet 4 punch hole 60
75 12. Plasma treat the channel side of the three PDMS layers (where the plug was inserted) and square of a thin 1mm PDMS layer. The plug prevents the argon plasma from moving through the Inlet 4 channel and compromising the hydrophobic device. The plug is inserted before treatment and removed after treatment, but before bonding. 13. Remove the PDMS plug with tweezers and bond the three PDMS layers on top of the thin 1mm PDMS layer. 14. The four layers of bonded PDMS are then bonded on a glass slide cleaned with isopropyl alcohol (IPA) for structural support and viewing on the Lab Smith inverted microscope. 15. Do not post plasma bake the finished device. 4.4 Device Testing: PDMS Stacked Devices Microdroplet Generator The hydrophobic device in the stacked PDMS device remains consistent from the previous phase of testing with the PDMS-glass device. The hydrophilic device on the other hand, will be made of two PDMS layers and will be tested directly after plasma treatment to utilize the temporary hydrophilic surface properties. The duration of the hydrophilic surface properties needed to be investigated to determine the appropriate time to test the device. One important consideration is the bond viability of the PDMS after argon plasma treatment. It is important to determine when the bond was strong enough to be tested after treatment in conjunction with how long the device remained hydrophilic. The contact angle hydrophobic recovery timeline needed to be charted to find out the ideal time to test the devices with hydrophilic surface properties. The data summaries on the contact angle recovery after an argon plasma treatment can be found in Table 7 and Figure 27 below. The full contact angle data can be found for reference in Appendix D. 61
76 Contact Angle (Degrees) Table 7: PDMS Contact Angle Recovery 3+ Time (hours)before hours baked Average Angle ( ) Contact Angle Hydrophobic Recovery Over Time Time (Hours) Hydrophobic Hydrophilic Hydrophilic PDMS Hydrophobic PDMS Figure 27: Hydrophobic recovery of an argon plasma treated PDMS surface- This graph describes the hydrophobic recovery of the PDMS surface after exposure to the argon plasma. The treatment was done at time= 0 hours and the contact angle steadily increases after treatment. The square point at time= 0 hours represents the average intrinsic contact angle found on untreated PDMS and the point at time= 30 hours represents the average contact angle for PDMS that undergoes a post plasma bake. Literature values are represented at time= 1 for comparison because that is the time when the devices began testing. 62
77 The contact angle hydrophobic recovery testing shows that the contact angle remains < 90 through at least ten hours after argon plasma treatment. The next test to conduct was the bond strength of the PDMS. Ten different 4mm PDMS layers were bonded together into five test devices. The layers were manually pulled apart to test the bond strength at 15 minutes, 30 minutes, 60 minutes, 90 minutes, and 120 minutes after bonding. Each test device was designated to be tested at a certain time. This is done because if a device is successfully pulled apart early, it cannot be retested for the later time frames. The plasma bond integrity is compromised each time contact between the device layers is lost. This was discovered after previous testing runs with test devices being reused at all time slots had no success bonding in any time frame. The bond testing showed the test devices could be pulled apart at 15 and 30 minutes, but not at 60, 90, or 120 minutes. From this test, it was concluded that hydrophilic testing could begin after 60 minutes when the plasma bond was secure and needed be completed within ten hours of argon plasma treatment to maintain the hydrophobicity of the PDMS surface. To verify hydrophobic or hydrophilic PDMS channels, a goniometer was used to measure the contact angles of the PDMS using the sessile drop method of samples with and without argon plasma treatment (which is necessary to bond the PDMS and glass layers together). The PDMS had a contact angle averaging 117 degrees before argon plasma treatment indicating that the surface was hydrophobic, while the argon plasma-treated PDMS had a contact angle of 39.9 degrees indicating a hydrophilic surface. To correct this in the hydrophobic W/O devices, an additional baking step of at least 180 minutes was incorporated after plasma bonding the layers together for the third batch. The heat allows 63
![the PDMS elastomer to cross-link back to the original state, as it was before the surface modification from the plasma [43] [54].](/docs-images/86/94439547/images/78-0.jpg "Figure 28: Goniometer measurements of aqueous water droplets on PDMS- Goniometer measurements of aqueous water droplets on PDMS without (left) and with (right) plasma-treated surfaces The devices")
78 the PDMS elastomer to cross-link back to the original state, as it was before the surface modification from the plasma [43] [54]. Figure 28: Goniometer measurements of aqueous water droplets on PDMS- Goniometer measurements of aqueous water droplets on PDMS without (left) and with (right) plasma-treated surfaces The devices were manufactured and tested in the same manner as the hydrophobic T junction devices with only one difference, water was flooded into the channels to coat the hydrophilic channels with water and contain the mineral oil in the center of the channel for ideal droplet formation. This was done by manually compressing the water syringe (Figure 16C) to force water through the microfluidic device after the syringe pumps and tygon tubing was connected, but before testing began. Testing was conducted beginning precisely at one hour after argon plasma treatment, which was established from plasma bond and contact angle testing. The devices were tested at the target capillary number of for O/W microdroplets, meaning the continuous water phase began with a flow rate of 0.028mL/hr. The devices were tested beginning at a flow rate ratio of 1:1 as a baseline and the flow rate ratios were varied all the way up to 500:1 (continuous: dispersed). These flow 64
79 rate ratios represent a range of Capillary numbers for O/W microdroplets tested from to PDMS Stacked Devices: Results The first goal of the Stacked PDMS device was to produce monodisperse W/O droplets on a hydrophobic PDMS surface that could be transferred to a second hydrophilic device. The second goal was to produce O/W droplets on a hydrophilic PDMS device. The two droplet formations could be combined in future steps into a single double emulsion microfluidic device W/O Microdroplet Results The W/O microdroplets had a great success in forming in the previously established range of Capillary numbers of Microdroplet formation was also immediate at the target Capillary number of 0.05 as in the PDMS-Glass device testing. The images below (Figure 29) show the formation of W/O microdroplets in the single T-junction device. 65
 W/O microdroplet production at a Capillary number of 0.")

80 Figure 29: W/O microdroplet formation in Device 2A- These figures show the formation of W/O droplets in the T junction in Device 2A. A) W/O microdroplet production at a Capillary number of 0.05 with a flow rate ratio of 1.25:1. B) W/O microdroplet production at a Capillary number of 0.05 with a flow rate ratio of 1:1. Inlet and outlet references are from Figure 22. The arrows indicate the direction of fluid flow. 66
81 The formation of W/O microdroplets was successful at the established Capillary number ranges using PDMS in the Cal Poly Lab. However, the first troubleshooting issue of the W/O microdroplets was the transfer of droplets from the hydrophobic device to the hydrophilic device. Figure 30 below shows Inlet 4 on the hydrophilic PDMS device where the W/O microdroplets are inconsistently moving through the inlet into the hydrophilic PDMS device and merging together. The transfer of consistent W/O microdroplets to the hydrophilic PDMS device is important to properly and consistently forming W/O/W microdroplets because inconsistent W/O microdroplet flow will results in inconsistent W/O/W microdroplet formation. The merging of water microdroplets means the droplet viscous forces are overcoming surface tension forces, which results in droplets merging together. The W/O droplet emulsion instability was easily fixed by mixing a new batch of mineral oil with Span 80 surfactant. From this point forward, fresh fluid mixes with surfactant were created before each testing day. A comparison between unstable merging W/O microdroplets (Figure 30) and the stable transfer of W/O microdroplets to the hydrophilic device (Figure 31) can be seen below. 67

 the stability of W/O droplet transfer from the Outlet 1 in Device 2A in the")
82 Figure 30: Irregular flow of W/O microdroplets in Device 2B Inlet 4- This shows the irregular flow of deionized water droplets in Device 2B Inlet 4 of the hydrophilic device. This demonstrates emulsion instability for the hydrophobic W/O droplets. The arrow indicates the direction of fluid flow. Figure 31: Stable transfer of W/O microdroplets- These images show A) the stability of W/O droplet transfer from the Outlet 1 in Device 2A in the hydrophobic device and B) The stable transfer of these droplets through the PDMS punch hole to Device 2B Inlet 4 of the hydrophilic device 68


83 4.5.2 O/W Microdroplet Results The hydrophilic droplet creation in a PDMS-PDMS device was initially very difficult to integrate in the stacked device orientation because of the added complications of W/O microdroplets flowing through one of the inlet channels. Thus, the hydrophilic device was tested separately in a single T junction device (Device 2A and 2B) in an attempt to create O/W droplets on the hydrophilic PDMS surface. The devices were tested beginning at a flow rate of 1:1 as a baseline and were varied all the way up to 500:1. At this initial flow rate of 1:1, all hydrophilic devices were unable to produce droplets because the dispersed flow rate was too high and pushed the continuous phase fluid back into its inlet, preventing proper O/W droplet formation. As the continuous water phase flow rate was increased to shear off the oil into droplets in the middle of the channel, co-flow in the outlet channel was seen. Examples of co flow during hydrophilic device testing can be seen below in Figure 32a-d. 69
 Device 2A co-flow at a Capillary number of 0.0027 and flow rate ratio of 5:1 B) Device 2B co-flow at a Capillary number of 0.")

84 Figure 32: Co-flow of water and mineral oil in Device 2A and 2B- These images show the coflow of the continuous SDS water phase and mineral oil with Span 80 dispersed phase in the outlet channel of the single T junction. A) Device 2A co-flow at a Capillary number of and flow rate ratio of 5:1 B) Device 2B co-flow at a Capillary number of and flow rate ratio of 10:1 C) Device 2B co-flow at a Capillary number of and flow rate ratio of 50:1 D) Device 2B co-flow at a Capillary number of and flow rate ratio of 200:1 This result was seen repeatedly in several experiments despite verifications of PDMS surface hydrophilicity after testing. The question of the PDMS hydrophilicity was unsure due to continued images such as Figure 33 where the continuous water phase encroaches up the dispersed oil inlet and remains only in the center of the channel with the oil on the outside wetting the PDMS. This behavior is characteristic of a hydrophobic PDMS microfluidic device. However, testing the PDMS contact angles after testing from 1-3 hours after plasma treatment yielded contact angles of which was consistent with the PDMS hydrophobic recovery testing that was conducted in Table 7 and Figure

85 Figure 33: Movement of water up the Inlet 4 oil channel- The movement of water up the Inlet 4 oil channel due to an imbalance in flow rate forces. The water is clearly confined to the center of the channel and not wetting the PDMS as would be expected in a hydrophilic device Single Disperse Oil Droplet The next step in the testing process was an attempt to produce a single disperse oil droplet instead of trying to create controlled monodisperse oil droplets because of the inability of the continuous water phase to shear off oil droplets at the T junction. The dispersed microdroplets could be formed by manipulating the flow rate of the continuous water phase to block the flow of oil into the T junction from Inlet 4. Thus, the oil remaining in the outlet channel would be pinched off from the source and form a droplet contained on both sides by deionized water. However, the oil would not form oil droplets in Outlet 2 and instead remained in co-flow down Outlet 2 and broke deionized water containment in order to merge back with pockets of oil. 71

 The white arrow designates the area where mineral oil has pushed back against the")

86 Figure 34: Co-flow and merging of mineral oil in Outlet 2 Device 2B- These figures show the blocking of the dispersed phase oil channel and the co-flow and oil merging events that occur as the flow rates of the continuous water phase were manipulated. A) This image shows Outlet 2 with the white bracket designating the pocket of oil contained between two water phases B) The oil phase has pushed the water phase in the outlet back to merge back with the main oil phase in Outlet 2 C) The white arrow designates the area where mineral oil has pushed back against the water phase to merge back with the main oil phase in Outlet 2 D) Co-flow of deionized water and mineral oil in Device 2B Outlet 2 E) Co-flow of deionized water and mineral oil in Device 2B Outlet 2. The white arrows designate the flow of mineral out from the sides of the PDMS channels F) The manipulation of fluid flows allows the continuous water phase to block the dispersed oil phase. 72
87 The shearing of the mineral oil with a viscosity of 33cSt with a continuous phase fluid of 1 cst (H2O) was proving to be difficult. This is despite verifications of measuring the contact angle of argon plasma treated PDMS using a goniometer that the PDMS is hydrophilic 2-3 hours after plasma treatment. Since the contact angle remained consistent with literature O/W microdroplet product, the next parameter to test for issues was the fluid viscosity and viscosity ratios. This issue could be due to the large viscosity difference between the two phases. Okushima used a fluid viscosity of 56.7cSt for the dispersed oil phase with a 1cSt water phase which was far less favorable for O/W microdroplet shearing in a T junction than the current setup with a 33cSt mineral oil dispersed phase fluid. However, other literature examples utilize a fluid viscosity in the continuous phase that is more viscous than the dispersed phase. In O/W microdroplet production, literature examples used continuous phase fluids with a viscosity similar or less than water at ~1cSt. These literature examples will be explored below in Table Alternative Viscosities for Dispersed Phase Fluid A readily available substitute oil called WD-40 multipurpose oil with a theoretical viscosity of 7cSt was tested to determine if there were any notable differences during testing from the mineral oil [55]. This fluid was closer to other dispersed phase fluid viscosities as detailed in Table 8 and could provide a quick test to note any differences in testing from the 33cSt mineral oil. It was determined there were not any significant differences with the fluid change. The two phases continue to co-flow down the outlet channel and the continuous water phase is unable to shear off microdroplets of oil flow. The co-flow and T junction for the WD-40 testing can be seen in Figure 35 below. 73
 The co-flow of the oil and water phases in Device 2A Outlet 2. The arrows denote the direction of fluid flow and the Inlet and Outlet references are from Figure 23.")
88 Figure 35: A) Co-flow and T junction of failed WD-40 oil testing- The T junction where the continuous water phase is unable to shear off oil droplets B) The co-flow of the oil and water phases in Device 2A Outlet 2 C) The co-flow of the oil and water phases in Device 2A Outlet 2. The arrows denote the direction of fluid flow and the Inlet and Outlet references are from Figure 23. The next key next step in evaluating a potential issue with fluid viscosity will be determining if a different oil could be used as a dispersed phase to produce O/W droplets in a T junction. The two fluids tested; mineral oil and WD-40 oil, have viscosities of 33.5cSt and 7cSt respectively. Potential fluids and their viscosities are detailed below in Table 8. [30] [43] [53]. 74
89 Table 8: Fluid viscosities of dispersed phase fluids used in O/W microdroplets Oil Viscosity (cst) Fluorinated oil 3.4 Sunflower oil Mineral oil 24 Tetradecane Silicone Oil 10 Corn Oil 56.7 Decane Toluene 0.55 Currently used Mineral Oil 33 A literature survey of viscosity ratios was conducted to determine what ratios could be feasible for O/W droplet formation which can be seen below in Table 9. 75
![Table 9: Viscosity Ratios for Successful O/W Droplet Formation Viscosity Ratio (Continuous: Dispersed Phase) Reference 1:3.4, 1:48.98, 1:24 [48] 1:10.75 [30] 1:3, 1:16 [49] 1.82:1 [53] 1.](/docs-images/86/94439547/images/90-0.jpg "16:1 [56] 1:33 Current Setup 1:56.")
90 Table 9: Viscosity Ratios for Successful O/W Droplet Formation Viscosity Ratio (Continuous: Dispersed Phase) Reference 1:3.4, 1:48.98, 1:24 [48] 1:10.75 [30] 1:3, 1:16 [49] 1.82:1 [53] 1.16:1 [56] 1:33 Current Setup 1:56.7 [40] Another consideration for determining the correct viscosity ratio considered a literature example of a computational model of droplet formation in a microfluidic cross junction. The study showed droplet formation and jetting at different viscosity ratios which can be seen below in Figure
91 Figure 36: Droplet formation at different viscosity ratios- computational study- A) Droplet formation at different viscosity ratios with the target ratios of 1:1 and 2:1 showing microdroplet formation (β) B) Graph showing the relationship between viscosity ratio (β) and droplet size and the region where droplet jetting occurs [56]. Using data gained from the literature survey and the computation study, the final stage of testing to fully resolve the viscosity issue will use two fluid mixtures with a target viscosity ratio of 1:1 and 2:1 for the continuous phase fluid vs the dispersed phase fluid [30,53,56] Water-Glycerol Solution as the Continuous Phase Fluid One issue when considering a change of fluid for the oil phase or the continuous aqueous phase fluid is the effect on the droplet formation for the W/O droplets in the first T junction. 77
92 A change in the oil could prevent these droplets from being formed. Thus, the viscosity of the continuous phase fluid will be raised to both 33cSt and 66cSt to match the ratios seen in literature for droplet formation while keeping the hydrophobic device fluids consistent. This will be achieved using a glycerol-water solution [58]. For a glycerol-water mixture to have a viscosity of 66cSt at an assumed room temperature of 25 C, the solution will be 82.6wt% glycerol while a 33cSt viscosity will be comprised of a 77.1wt% glycerol solution [57]. This is calculated assuming a viscosity of 945cSt for a pure glycerol solution [57]. The experimental viscosity of the mixed glycerol solutions needed to be verified. The solutions were mixed and brought to the Cal Poly Polymers and Coatings testing lab for rheometer testing. The rheometer measures the viscosity of the fluid over a range of strain rate values which can be seen in Appendix C. To determine the appropriate viscosity values, an experimental value for strain rate needed to be calculated. γ = 8( Q 2wd )/ [Strain rate for fluid flow in a pipe using a hydraulic diameter] A w+d Where γ is strain rate [1/s], Q is the volumetric flow rate [m 3 /s], A is the cross-sectional area of the pipe [m 2 ], w is the channel width [m] and d is the channel depth [m]. Since the microfluidic channels being tested are rectangular, diameter is replaced with hydraulic diameter to represent the geometry of the channels. Given the channel width of 85µm in Device 2B which was tested, a channel depth of 65µm, volumetric flow rate of 0.05mL/hr which is the flow rate for the target capillary number in the hydrophobic device, and cross sectional area of 65µm*85µm, a strain rate of was s calculated. Evaluating the strain rate vs viscosity experimental values from the rheometer leads to the values shown in Table 10 below. The full data for the rheometer viscosity 78
93 testing can be found in Appendix B. The values are based on a specific strain rate that the fluids will be experiencing in the microfluidic device which is why the mineral oil and glycerol values different from their cited values in literature. However, the most important takeaway is the relative fluid viscosity ratios at the strain rates that will be experienced in the device. The 1:1 Aqueous solution will have a viscosity ratio of 2.34:1 and the 2:1 Aqueous solution will have a viscosity ratio of 2.67:1 (continuous: dispersed). Table 10: Rheometer Viscosity Testing Experimental Measured Viscosity (cst) 1:1 Aqueous Solution :1 Aqueous Solution Mineral Oil Glycerol Testing with Water-Glycerol as Continuous Phase Fluid The testing was conducted using a target of for the capillary number, which yielded a starting flow rate of 0.40mL/hr for the 1:1 aqueous solution in Device 2B and 0.20mL/hr for the 2:1 aqueous solution in Device 2B [30,48,49]. The addition of glycerol to form a glycerol-water aqueous solution makes the SDS more difficult to mix because of the high viscosity. The SDS mixing into the glycerol solution was much more extensive than previous mixing into only deionized water. 79
94 4.5.7 Results for Water-Glycerol Solution as Continuous Phase Fluid Droplet formation for both solutions began at a 0.045mL/hr flow rate for the continuous phase and was no longer viable starting at 1.9mL/hr with a constant mineral oil dispersed phase flow rate of 0.40mL/hr for the 1:1 aqueous solution and 0.20 ml/hr for the 2:1 aqueous solution. This gives a working capillary range of to for the 1:1 aqueous solution and to for the 2:1 aqueous solution. The testing results from the 1:1 aqueous solution can be seen below in Figure 37 and the testing results for the 2:1 aqueous solution can be seen below in Figure

 Shearing of the oil droplet by the aqueous continuous phase in Outlet 2")
95 Figure 37: O/W microdroplet formation in Device 2B- A) Co-flow of the dispersed and continuous phases at the initial capillary number of and a flow rate ratio of 1:1 in Device 2B. B) Stable oil droplets flowing through Outlet 2 Device 2B at a capillary number of and a flow rate ratio of 1:1 C) Shearing of the oil droplet by the aqueous continuous phase in Outlet 2 Device 2B at a capillary number of and a flow rate ratio of 1:1 81
 Stable oil droplets flowing through the outlet channel at a Capillary number of 0.0015 and a flow rate ratio of 1:1.")

96 Figure 38: O/W microdroplet formation in Device 2B- A) Stable oil droplets flowing through the Outlet 2 in the bulk aqueous phase. B) Stable oil droplets flowing through the outlet channel at a Capillary number of and a flow rate ratio of 1:1. C) Oil droplet formation at the T junction at a Capillary number of and a flow rate ratio of 1: Conclusions O/W microdroplets were finally successfully manufactured after altering viscosity ratios to better reflect literature examples of O/W microdroplet production. This result throws the Okushima result of O/W microdroplets with a flow rate ratio of 1:56.7 into even more 82
97 question. The Okushima result potentially could have been due to the Pyrex glass surface as this was the only key difference in the microdroplet generators. The viscosity ratio has been established as a key parameter in microdroplet formation and research into potential fluids for microdroplet applications is ever more important. 83
98 Chapter 5. Conclusions and Future Directions Microfluidic devices are rapidly gaining momentum in chemical and biological applications to perform specific experimental reactions that require a high throughput and a low cost. This research has made several additions to microfluidic emulsion technology that can be used for biological screening and many other applications which were outlined previously. The stacked device design with only PDMS-PDMS microfluidic devices will allow rapid prototyping of microdroplet emulsion testing rather than fabricating glass or surface coatings on the PDMS to control the surface properties. This will be a valuable tool in keeping microfluidic devices at a low cost. The major aims of this project included validating testing for W/O droplets in hydrophobic PDMS microfluidic devices, creating a hydrophilic PDMS device without expensive surface treatments, making O/W droplets on the hydrophilic device, and integrating the two devices together in a single multilayer PDMS microfluidic device. Each aim of this project was completed successfully with positive results. The data and testing images conclusively show the production of W/O microdroplets on a hydrophobic PDMS surface using the previously established Cal Poly protocols. A hydrophilic PDMS surface was also created using an argon plasma which led to the successful production of O/W microdroplets on a hydrophilic PDMS surface. Testing images also confirmed the successful transfer of W/O microdroplets to the hydrophilic PDMS device when new batches of fluid were mixed prior to each test. However, the O/W microdroplet creation is not consistent with the W/O/W microdroplet emulsions formed by the Okushima research group which formed O/W microdroplets at an incredible 1:56.7 viscosity ratio [40]. This value differs greatly from other viscosity ratios that were explored 84
99 above in Table 9. Further testing using a Pyrex glass or glass slide surface to confirm or refute the Okushima results would be necessary to fully explore the results of this experiment. A potential cause of the different results could be that etched glass has lower intrinsic contact angles with water which could contribute to droplet formation at less favorable viscosity ratios. The formation of successful PDMS microdroplet generators for W/O microdroplets and O/W microdroplets using an argon plasma for the hydrophilic PDMS devices will allow for simpler and integrated rapid prototyping for future PDMS microfluidic applications. In the fall of 2017, a third generation PDMS or glass microfluidic droplet generator could be designed with the following changes: 1. Combining the hydrophobic and hydrophilic devices into a functioning W/O/W emulsion generator 2. 2-Piece droplet stoppers in arrays before the outlets a) Droplet storage method to set up bioreactors b) Stopped droplets allows time for bioreactions and time for optical detection of reactions 3. Abrupt diameter increase for the T-junction device after the junction a) To prevent droplets from sliding along the outlet walls and dividing b) In order to arrange the array of droplet stoppers 4. Changing the inlets on some devices to become more conducive to droplet flow a) Droplets do not come out uniformly through pinwheel inlets 85
100 One of the key next steps to this project will be investigating the use of a chemical surface treatment on the PDMS to create a stable and long term hydrophilic surface to produce O/W droplets. Possible treatments include a PVD or CVD of octyltriethoxysilane, plasma electrolytic oxidation, sol gel modified PDMS, layer by layer deposition of polyelectrolytes, or deposition of Polytetrafluoroethylene [48] [2]. These treatments have been shown to produce hydrophilic contact angles that are consistent with the literature values for contact angles used to produce O/W droplets. A final 3rd generation glass device could be used for mixing two aqueous solutions and using the device as a bioreactor. A glass device would allow the device to be more inert to biomaterials, in addition to facilitating an option of further design modifications that could not be achieved with PDMS such as a chemical surface treatment. In the bigger picture, the microdroplets created could act as highly efficient and precise reactors to measure viral loading for HIV, which currently relies on PCR, bdna or NASBA. Viral loading, reverse transcriptase, RNA and DNA tracing are highly marketable detection methods. These methods could potentially be enhanced by using droplet reactors rather than the standardized gel electrophoresis and ELISA due to the high surface area to volume ratio, enabling rapid reaction processes to occur with precise amounts of reagents within each drop for accurate calculating [61]. 86
101 REFERENCES 1. Lui, Kuo-Kang. Wu, Ren-Guei. Chuang, Yun-Ju. Microfluidic Systems for Biosensing. MDPI - Sensors 10.7 (2010): PubMed. Web. 26 October Barbier, Valessa, Michaal Tatoulian, Hong Li, Farzaneh Arefi-Khonsari, Armand Ajdari, and Patrick Tabeling. "Stable Modification of PDMS Surface Properties by Plasma Polymerization: Application to the Formation of Double Emulsions in Microfluidic Systems." Langmuir (2006): Web. 6 Dec Urbanski, John Paul. Application of Microfluidic Emulsion Technology to Biochemistry, Drug Delivery and Lab-on-a-Chip Programmability. Department of Mechanical Engineering. Massachusetts Institute of Technology, n.d. Web. 8 Feb Whitesides, George M. "The Origins and the Future of Microfluidics." Nature (2006): Web. 8 Feb Herr, A. E., A. V. Hatch, D. J. Throckmorton, H. M. Tran, J. S. Brennan, W. V. Giannobile, and A. K. Singh. "Microfluidic Immunoassays as Rapid Saliva-based Clinical Diagnostics." Proceedings of the National Academy of Sciences (2007): Web. 8 Feb Yager, Paul, Thayne Edwards, Elain Fu, Kristen Helton, Kjell Nelson, Milton R. Tam, and Bernhard H. Weigl. "Microfluidic Diagnostic Technologies for Global Public Health."Nature (2006): Web. 8 Feb Dimov, Ivan K., Jose L. Garcia-Cordero, Justin O'grady, Claus R. Poulsen, - Caroline Viguier, Lorcan Kent, Paul Daly, Bryan Lincoln, Majella Maher, 87
102 Richard O'kennedy, Terry J. Smith, Antonio J. Ricco, and Luke P. Lee. "Integrated Microfluidic TmRNA Purification and Real-time NASBA Device for Molecular Diagnostics." Lab on a Chip 8.12 (2008): Web. 8 Feb Ansari, M.i. Haque, Shabir Hassan, Ahsanulhaq Qurashi, and Firdous Ahmad Khanday. "Microfluidic-integrated DNA Nanobiosensors." Biosensors and Bioelectronics 85 (2016): Web. 8 Feb Balagaddé, F. K., You, L., Hansen, C. L., Arnold, F. H. & Quake, S. R. Longterm monitoring of bacteria undergoing programmed population control in a microchemostat. Science 309, (2005). 10. J. Lederberg, J. Bacteriol.1954, 68, Theberge, Ashleigh B., Fabienne Courtois, Yolanda Schaerli, Martin Fischlechner, Chris Abell, Florian Hollfelder, and Wilhelm T. S. Huck. "Microdroplets in Microfluidics: An Evolving Platform for Discoveries in Chemistry and Biology." Angewandte Chemie International Edition (2010): Web. 12. B. Rotman, Proc. Natl. Acad. Sci. USA 1961, 47, "Droplet Microfluidics." Droplet Microfluidics - Lab on a Chip (RSC Publishing). The Royal Society of Chemistry, 11 Jan Web. 15 Jan Hurd, Brandon, David Clague, Brennan Graham, Charlie Grove, Richard Savage, and Hans Mayer. Microdroplet Generator. California Polytechnic State University, 15 June Web. 15. Mayer, Hans. Microscale Tip-Streaming in a Flow Focusing Device. J. Appl. Phys (2013):4907. AIP Publishing. Web. 20 October
103 16. Y. C. Tan, J. S. Fisher, A. I. Lee, V. Cristini and A. P. Lee, Lab Chip, 2004, 4, A. T.-H. Hsieh, J.-H. Pan, P. G. Pinasco, J. Fisher, L.-H. Hung and A. P. Lee, in The Eleventh International Conference on Miniaturized Systems for Chemistry and Life Sciences, Paris, France, 2007, pp R. B. Fair, A. Khlystov, T. D. Tailor, V. Ivanov, R. D. Evans, P. B. Griffin, V. Srinivasan, V. K. Pamula, M. G. Pollack and J. Zhou, IEEE Des. Test Comput., 2007, 24, Y. P. Hong and F. J. Wang, Microfluidics Nanofluidics, 2007, 3, L. M. Fidalgo, C. Abell and W. T. S. Huck, Lab Chip, 2007, 7, Pit, Arjen, Michel Duits, and Frieder Mugele. "Droplet Manipulations in Two Phase Flow Microfluidics." Micromachines 6.12 (2015): Web. 9 Feb Schneider, Thomas. The Potential Impact of Droplet Microfluidics in Biology. Analytical Chemistry 85.7 (2013): PubMed. Web. 15 November M. Ozkan, M. Wang, C. Ozkan, R. Flynn, A. Birkbeck and S. Esener, Biomed. Microdev., 2003, 5, P. S. Dittrich and P. Schwille, Anal. Chem., 2003, 75, Khashayar Khoshmanesh, Saeid Nahavandi, Sara Baratchi, Arnan Mitchell, Kourosh Kalantar-zadeh. Dielectrophoretic platforms for bio-microfluidic systems. Biosensors and Bioelectronics, Volume 26, Issue 5, 15 January 2011, Pages , ISSN
104 26. N.G Green, H Morgan, Joel J Milner, Manipulation and trapping of sub-micron bioparticles using dielectrophoresis, Journal of Biochemical and Biophysical Methods, Volume 35, Issue 2, 25 September 1997, Pages Suh, Yong Kweon, and Sangmo Kang. "A Review on Mixing in Microfluidics." Micromachines1.3 (2010): Web. 25 Jan Kim, D.S.; Lee, S.H.; Kwon, T.H.; Ahn, C.H. A serpentine laminating micromixer combining splitting/recombination and advection. Lab Chip 2005, 5, Kahn, M. C. "Bacteriostatic Properties of Histiocytes Toward Mycobacterium Tuberculosis as Determined by the Single Cell Method." Experimental Biology and Medicine 46.4 (1941): Web. 25 Jan Dolomite's Double Emulsion System. Place of Publication Not Identified: Book On Demand, Water in Mineral Oil in Water. Dolomite Microfluidics. Web. 4 Dec Sivasamy, Jayaprakash, Yong Cai Chim, Teck-Neng Wong, Nam-Trung Nguyen, and Levent Yobas. "Reliable Addition of Reagents into Microfluidic Droplets." Microfluidics and Nanofluidics 8.3 (2009): Web. 1 Feb Choi, Kihwan, Alphonsus H.c. Ng, Ryan Fobel, and Aaron R. Wheeler. "Digital Microfluidics."Annual Review of Analytical Chemistry 5.1 (2012): Web. 14 Feb Freire, Sergio L.s. "Perspectives on Digital Microfluidics." Sensors and Actuators A: Physical250 (2016): Web. 14 Feb
105 34. I. Barbulovic-Nad, S.H. Au, A.R. Wheeler. A microfluidic platform for complete mammalian cell culture. Lab Chip, 10 (12) (2010), pp I. Barbulovic-Nad, H. Yang, P.S. Park, A.R. Wheeler. Digital microfluidics for cell-based assays. Lab Chip, 8 (4) (2008), pp Morisset, Dany, Dejan A Stebih, Mojca Milavec, Kristina Gruden, and Jana Zel. "Quantitative Analysis of Food and Feed Samples with Droplet Digital PCR." PLoS ONE 8.5 (2013): n. page. Web. 2 Feb Didelot, A., S. K. Kotsopoulos, A. Lupo, D. Pekin, X. Li, I. Atochin, P. Srinivasan, Q. Zhong, J. Olson, D. R. Link, P. Laurent-Puig, H. Blons, J. B. Hutchison, and V. Taly. "Multiplex Picoliter-Droplet Digital PCR for Quantitative Assessment of DNA Integrity in Clinical Samples." Clinical Chemistry 59.5 (2013): Web. 2 Feb Bashir, Shazia, Muhammad Bashir, Xavier Solvas, Julia Rees, and William Zimmmerman. "Hydrophilic Surface Modification of PDMS Microchannel for O/W and W/O/W Emulsions." Micromachines 6.10 (2015): Web. 39. Shingo Okushima, Takasi Nisisako. Controlled Production of Monodisperse Double Emulsions by Two-Step Droplet Breakup in Microfluidic Devices. Langmuir (2004): ACS Publications. Web. 3 December Claudiu A. Stan, Sindy K. Y. Tang, and George M. Whitesides. Independent Control of Drop Size and Velocity in Microfluidic Flow Focusing Generators Using Variable Temperature and Flow Rate. Department of Chemistry and Chemical Biology, Harvard University, Cambridge, MA. [Dynamic viscosity of Light Mineral Oil at range of temperatures]. 91
106 41. Meng, Qiang, Yali Zhang, Jiang Li, Rob G. H. Lammertink, Haosheng Chen, and Peichun Amy Tsai. "Altering Emulsion Stability with Heterogeneous Surface Wettability." US National Library of Medicine. Nature Publishing Group, 3 June Web. 04 Dec Mohammed, J. S., D. T. Eddington, and N. Zachariaha. "Quantification of Hydrophobic Recovery and Temporal Bonding in Polydimethylsiloxane." Journal of Undergraduate Research. University of Illinois at Chicago, Web. 4 Dec Whitesides, George, and Sindy K.Y. Tang. "Basic Microfluidic and Soft Lithographic Techniques." Department of Chemistry and Chemical Biology. Harvard University, 02 June Web. 16 Feb Physical Properties of Glycerine and Its Solutions. New York: Glycerine Producers' Association, ACI Science. Web. 13 Jan Toepke, Michael W., and David J. Beebe. "PDMS Absorption of Small Molecules and Consequences in Microfluidic Applications." Lab on a Chip 6.12 (2006): Web. 15 Feb Quake, Stephen. "Designing Your Own Device: Multi-Height Molds." Microfluidics Foundry. Stanford University, n.d. Web. 16 Feb Pelayo, J. C., R. A. Badiola, J. Castanares, U. Pili, R. Violanda, and R. Bacabac. "Surface Geometry Based Hydrophobicity of the PDMS for Microfluidic Devices." IOP Conference Series: Materials Science and Engineering 79 (2015): Web. 4 Dec
107 48. "Materials Data Safety Sheet Vegetable Glycerin." Ingredient Depot, 11 July Web. 15 Jan Lee, Jung Seok, and Jan Feijen. "Polymersomes for Drug Delivery: Design, Formation and Characterization." Journal of Controlled Release (2012): Web. 50. Kim, Bo-Yeol, Lan-Young Hong, Young-Min Chung, Dong-Pyo Kim, and Chang-Soo Lee. "Solvent-Resistant PDMS Microfluidic Devices with Hybrid Inorganic/Organic Polymer Coatings." Advanced Functional Materials (2009): Web. 6 Dec Physical Properties of Glycerine and Its Solutions. New York: Glycerine Producers' Association, ACI Science. Web. 13 Jan Tan, Yung-Chieh, Vittorio Cristini, and Abraham P. Lee. "Monodispersed Microfluidic Droplet Generation by Shear Focusing Microfluidic Device." Sensors and Actuators B: Chemical114.1 (2006): Web. 13 Dec Bodas, Dhananjay, and Chantal Khan-Malek. "Hydrophilization and Hydrophobic Recovery of PDMS by Oxygen Plasma and Chemical Treatment, An SEM Investigation." Sensors and Actuators B: Chemical (2007): Web. 15 Jan "Safety Data Sheet." Encyclopedia of Lubricants and Lubrication (2014): Safety Sheet. WD-40, 31 July Web. 26 Feb Molina, Paula Malo De, Marie-Sousai Appavou, and Michael Gradzielski. "Oilin-water Microemulsion Droplets of TDMAO/decane Interconnected by the 93
108 Telechelic C18-EO150-C18: Clustering and Network Formation." Soft Matter (2014): Web. 19 Jan Ngo, Ich-Long, Sang Woo Joo, and Chan Byon. "Effects of Junction Angle and Viscosity Ratio on Droplet Formation in Microfluidic Cross-Junction." Journal of Fluids Engineering (2016): Web. 26 Feb Segur, J. B., and Helen E. Oberstar. "Viscosity of Glycerol and Its Aqueous Solutions."Industrial & Engineering Chemistry 43.9 (1951): Industrial and Engineering Chemistry. Web. 13 Jan "HIV Viral Load Testing: How It's Done, Results, and More." WebMD. WebMD, n.d. Web. 03 Dec Kim, Jongsoo, Manoj K. Chaudhury, and Michael J. Owen. "Hydrophobic Recovery of Polydimethylsiloxane Elastomer Exposed to Partial Electrical Discharge." Journal of Colloid and Interface Science (2000): Web. 4 Dec Zeringue, H. C., M. B. Wheeler, and D. J. Beebe. "A Microfluidic Method for Removal of the Zona Pellucida from Mammalian Embryos." Lab on a Chip 5.1 (2005): 108. Web. 8 Feb Tewhey, Ryan, Jason B. Warner, Masakazu Nakano, Brian Libby, Martina Medkova, Patricia H. David, Steve K. Kotsopoulos, Michael L. Samuels, J. Brian Hutchison, Jonathan W. Larson, Eric J. Topol, Michael P. Weiner, Olivier Harismendy, Jeff Olson, Darren R. Link, and Kelly A. Frazer. "Microdropletbased PCR Enrichment for Large-scale Targeted Sequencing." Nature Biotechnology (2009): Web. 1 Feb
109 62. Henkel, T., T. Bermig, M. Kielpinski, A. Grodrian, J. Metze, and J.M Kohler. "Chip Modules for Generation and Manipulation of Fluid Segments for Micro Serial Flow Processes." Chemical Engineering Journal (2004): Web. 1 Feb Hong J, Choi M, Edel JB, demello AJ. Passive self-synchronized two-droplet generation. Lab Chip. 2010; 10: Bodas, Dhananjay, and Chantal Khan-Malek. "Formation of More Stable Hydrophilic Surfaces of PDMS by Plasma and Chemical Treatments." Microelectronic Engineering (2006): Web. 15 Jan Utada, A. S. "Monodisperse Double Emulsions Generated from a Microcapillary Device." Science (2005): Web. 15 Jan VladisavljeviÄ, G. T., Isao Kobayashi, and Mitsutoshi Nakajima. "Production of Uniform Droplets Using Membrane, Microchannel and Microfluidic Emulsification Devices." Microfluidics and Nanofluidics 13.1 (2012): Web. 15 Jan Liao, Chung-Yu, and Yu-Chuan Su. "Formation of Biodegradable Microcapsules Utilizing 3D, Selectively Surface-modified PDMS Microfluidic Devices."Biomedical Microdevices 12.1 (2009): Web. 15 Jan Thiele, Julian, Adam R. Abate, Ho Cheung Shum, Simone Bachtler, Stephan FÃrster, and David A. Weitz. "Fabrication of Polymersomes Using Double- Emulsion Templates in Glass-Coated Stamped Microfluidic Devices." Small 6.16 (2010): Web. 15 Jan
110 69. Simon, Melinda G., and Abraham P. Lee. "Microfluidic Droplet Manipulations and Their Applications." Microdroplet Technology (2012): Web. 15 Jan Xu, Wei, Peixue Ling, and Tianmin Zhang. "Polymeric Micelles, a Promising Drug Delivery System to Enhance Bioavailability of Poorly Water-Soluble Drugs."Journal of Drug Delivery 2013 (2013): Web. 15 Jan Felice, Betiana, Molamma P. Prabhakaran, Andrea P. Rodriguez, and Seeram Ramakrishna. "Drug Delivery Vehicles on a Nano-engineering Perspective."Materials Science and Engineering: C 41 (2014): Web. 15 Jan Baltazar, Gabriel C., Sonia Guha, Wennan Lu, Jason Lim, Kathleen Boesze- Battaglia, Alan M. Laties, Puneet Tyagi, Uday B. Kompella, and Claire H. Mitchell. "Acidic Nanoparticles Are Trafficked to Lysosomes and Restore an Acidic Lysosomal PH and Degradative Function to Compromised ARPE-19 Cells." PLoS ONE 7.12 (2012): n. page. Web. 15 Jan Praetorius, Natalie, and Tarun Mandal. "Engineered Nanoparticles in Cancer Therapy." Recent Patents on Drug Delivery & Formulation 1.1 (2007): Web. 15 Jan Yanes, Rolando E., Derrick Tarn, Angela A. Hwang, Daniel P. Ferris, Sean P. Sherman, Courtney R. Thomas, Jie Lu, April D. Pyle, Jeffrey I. Zink, and Fuyuhiko Tamanoi. "Involvement of Lysosomal Exocytosis in the Excretion of Mesoporous Silica Nanoparticles and Enhancement of the Drug Delivery Effect by Exocytosis Inhibition." Small 9.5 (2012): Web. 15 Jan
111 75. Jahn, Andreas, Samuel M. Stavis, Jennifer S. Hong, Wyatt N. Vreeland, Don L. Devoe, and Michael Gaitan. "Microfluidic Mixing and the Formation of Nanoscale Lipid Vesicles." ACS Nano 4.4 (2010): Web. 15 Jan Sang, Long, Yiping Hong, and Fujun Wang. "Investigation of Viscosity Effect on Droplet Formation in T-shaped Microchannels by Numerical and Analytical Methods." Microfluidics and Nanofluidics 6.5 (2008): Web. 15 Jan Wehking, Jonathan D., Michael Gabany, Larry Chew, and Ranganathan Kumar. "Effects of Viscosity, Interfacial Tension, and Flow Geometry on Droplet Formation in a Microfluidic T-junction." Microfluidics and Nanofluidics 16.3 (2013): Web. 15 Jan Lee, Hyomin, Chang-Hyung Choi, Alireza Abbaspourrad, Chris Wesner, Marco Caggioni, Taotao Zhu, Saraf Nawar, and David A. Weitz. "Fluorocarbon Oil Reinforced Triple Emulsion Drops." Advanced Materials (2016): Web. 15 Jan Abate, Adam R., Daeyeon Lee, Thao Do, Christian Holtze, and David A. Weitz. "Glass Coating for PDMS Microfluidic Channels by Sol Gel Methods." Lab on a Chip 8.4 (2008): 516. Web. 15 Jan Bauer, Wolfgang-Andreas C., Martin Fischlechner, Chris Abell, and Wilhelm T. S. Huck. "Hydrophilic PDMS Microchannels for High-throughput Formation of Oil-in-water Microdroplets and Water-in-oil-in-water Double Emulsions." Lab on a Chip (2010): Web. 15 Jan
112 81. Yao, Mingjin, and Ji Fang. "Hydrophilic PEO-PDMS for Microfluidic Applications."Journal of Micromechanics and Microengineering 22.2 (2012): Web. 15 Jan Tan, Say Hwa, Nam-Trung Nguyen, Yong Chin Chua, and Tae Goo Kang. "Oxygen Plasma Treatment for Reducing Hydrophobicity of a Sealed Polydimethylsiloxane Microchannel." Biomicrofluidics 4.3 (2010): Web. 15 Jan Niiyama, Takayoshi, and Akira Kawai. "Micro Wetting System by Controlling Pinning and Capillary Forces." Microelectronic Engineering (2006): Web. 15 Jan Makamba, Honest, Jin Ho Kim, Kwanseop Lim, Nokyoung Park, and Jong Hoon Hahn. "Surface Modification of Poly(dimethylsiloxane) Microchannels."Electrophoresis (2003): Web. 15 Jan Kovach, Kyle M., Jeffrey R. Capadona, Anirban Sen Gupta, and Joseph A. Potkay. "The Effects of PEG-based Surface Modification of PDMS Microchannels on Long-term Hemocompatibility." Journal of Biomedical Materials Research Part A (2014): n. page. Web. 15 Jan Campos, Richard Piffer Soares De, Inez Valeria Pagotto Yoshida, and Josa Alberto Fracassi Da Silva. "Surface Modification of PDMS Microchips with Poly(ethylene Glycol) Derivatives for utas Applications." Electrophoresis (2014): Web. 15 Jan Gupta, Amid, and Ranganathan Kumar. "Droplet Formation and Stability of Flows in a Microfluidic T-junction: Applied Physics Letters: Vol 94, No 98
113 16." Droplet Formation and Stability of Flows in a Microfluidic T-junction: Applied Physics Letters: Vol 94, No 16. Applied Physics Letters, n.d. Web. 15 Jan Piccin, Evandro, Davide Ferraro, Paolo Sartori, Enrico Chiarello, Matteo Pierno, and Giampaolo Mistura. "Generation of Water-in-oil and Oil-in-water Microdroplets in Polyester-toner Microfluidic Devices." Sensors and Actuators B: Chemical 196 (2014): Web. 13 Jan Tropmann, Artur, Laurent Tanguy, Peter Koltay, Roland Zengerle, and Lutz Riegger. "Completely Superhydrophobic PDMS Surfaces for Microfluidics." Langmuir (2012): Web. 4 Dec Garstecki, Piotr, Michael J. Fuerstman, Howard A. Stone, and George M. Whitesides. "Formation of Droplets and Bubbles in a Microfluidic T-junction: scaling and Mechanism of Break-up." Lab on a Chip Lab Chip6.3 (2006): 437. Web. 91. Zhang, Yonghoa. Droplet Formation in a T-Shaped Microfluidic Junction. Journal of Applied Physics, 106, (2009). 92. Anna, Shelley. "Formation of dispersions using flow focusing in microchannels." J. Appl. Phys (2003):1063. AIP Publishing. Web. 20 October Schneider, Thomas. The Potential Impact of Droplet Microfluidics in Biology. Analytical Chemistry 85.7 (2013): PubMed. Web. 15 November
114 94. Gu, Hao, Michel H.G. Duits, and Frieder Mugele. "Droplets Formation and Merging in Two-Phase Flow Microfluidics." International Journal of Molecular Sciences (2011): Web. 18 Feb Moynihan, Matthew, and David Harding. Double Emulsion Generation in the Mass Production of Inertial confinement Fusion Targets Using T-junctions. University of Rochester, n.d. Web. 18 Feb Felice, Betiana, Molamma Prabhakaran, Andrea Rodriguez, and Seeram Ramakrishna. "Drug Delivery Vehicles on a Nano-engineering Perspective." Science Direct. Materials Science and Engineering, 28 Apr Web. 4 Mar Kogan, Anna, and Nissim Garti. "Microemulsions as Transdermal Drug Delivery Vehicles." Advances in Colloid and Interface Science (2006): Web. 98. Lawrence, M. Jayne, and Warankanga Warisnoicharoen. "Recent Advances in Microemulsions as Drug Delivery Vehicles." Nanoparticulates as Drug Carriers (2006): Web. 99. Corcoran, Sarah. "Lipid-based Drug Carriers Target Tumours." Highlights in Chemical Biology. Royal Society of Chemistry, 19 Mar Web. 05 Mar Marto, J., L. Gouveia, I.m. Jorge, A. Duarte, L.m. Gonçalves, S.m.c. Silva, F. Antunes, A.a.c.c. Pais, E. Oliveira, A.j. Almeida, and H.m. Ribeiro. "Starch-based Pickering Emulsions for Topical Drug Delivery: A QbD Approach." Colloids and Surfaces B: Biointerfaces 135 (2015): Web. 100
115 101. Yan, Jing, Wolfgang-Andreas Bauer, Martin Fischlechner, Florian Hollfelder, Clemens Kaminski, and Wilhelm Huck. "Monodisperse Water-in-Oil-in-Water (W/O/W) Double Emulsion Droplets as Uniform Compartments for High- Throughput Analysis via Flow Cytometry." Micromachines 4.4 (2013): Web Surface Energy Data for PDMS: Polydimethylsiloxane, CAS # Anna, Shelley. "Formation of dispersions using flow focusing in microchannels." J. Appl. Phys (2003):1063. AIP Publishing. Web. 20 October "Mineral Oil." Sigma-Aldrich. n. page., n.d. Web. 14 Mar "Technical Learning: Viscosity." Panther Lubricants. n. page., n.d. Web. 14 Mar Eddings, Mark A., Michael A. Johnson, and Bruce K. Gale. "Determining the Optimal PDMS PDMS Bonding Technique for Microfluidic Devices." Journal of Micromechanics and Microengineering 18.6 (2008): n. page. IOP Science. Web. 14 Mar How Do Blood-Glucose Monitors Work? Intelihealth. Web. 26 October McKewon, Maya, Sarosi, Erin. The CTC Chip: A Microfluidic Technology Utilizing Antibodies for the Detection of Cancerous Tumor Cells. Conference Session B10. Paper #3106. University of Pittsburgh, Swanson School of Engineering. April 2,
116 109. Inglis, David W. "A Method for Reducing Pressure-induced Deformation in Silicone Microfluidics." Biomicrofluidics 4.2 (2010): n. page. American Institute of Physics, 12 Apr Butt, Hans-Jurgen. Graf, Karlheinz. Kappl, Michael. Physics and Chemistry of Interfaces. Weinheim: Wiley-VCH. Print Dwarakanath, Sulatha. Bruno, John G. Shastry, Anant. Quantum dot-antibody and aptamer conjugates shift fluorescence upon binding bacteria. Biochemical and Biophysical Research Communications (2004): ScienceDirect. Web. 26 October 2014.\ 112. Fiorito, Pablo. Cordoba de Torresi, Susana. Glucose Amperometric Biosensor Based on the Co-immobilization of Glucose Oxidase (GOx) and Ferrocene in Poly(pyrrole) Generated from Ethanol / Water Mixtures. Journal of Brazilian Chemical Society 12.6 (2001). SciELO. Web. 26 October

117 APPENDICES Appendix A - Profilometer Scan Verification of Device Channel Depth Profilometer Data Sample 1 Figure 39: Profilometer Data Sample 1- Data taken with the profilometer showing the height of the negative photoresist features patterned onto the silicon wafer. The height of the features corresponds to the channel depth after PDMS is poured over the silicon wafer mold. The height is represented in this figure by the red bracket where the y axis represents microns. 103

118 Profilometer Data Sample 2 Figure 40: Profilometer Data Sample 2- Data taken with the profilometer showing the height of the negative photoresist features patterned onto the silicon wafer. The height of the features corresponds to the channel depth after PDMS is poured over the silicon wafer mold. The height is represented in this figure by the red bracket where the y axis represents microns. 104

119 Profilometer Data Sample 3 Figure 41: Profilometer Data Sample 3- Data taken with the profilometer showing the height of the negative photoresist features patterned onto the silicon wafer. The height of the features corresponds to the channel depth after PDMS is poured over the silicon wafer mold. The height is represented in this figure by the red bracket where the y axis represents microns. 105

120 Profilometer Data Sample 4 Figure 42: Profilometer Data Sample 4- Data taken with the profilometer showing the height of the negative photoresist features patterned onto the silicon wafer. The height of the features corresponds to the channel depth after PDMS is poured over the silicon wafer mold. The height is represented in this figure by the red bracket where the y axis represents microns. 106
121 Table 11: Profilometry Scan Channel Depth (µm) Sample 1 Sample 2 Sample 3 Sample 4 Thickness Mean 75.0 Table 11 shows the recorded values for the height of the photoresist features patterned onto the silicon wafer. Processing steps were customized for a target channel depth of 65µm. The average experimental recorded height was 75.0µm. The experimental error of the soft lithography processing steps is seen in the equations below. abs(theoretical value Experimental Value) %Error = [ 100] Theoretical Value abs(65µm 75µm) %Error = [ 100] = 15.4% error 65µm 107
122 Appendix B - Rheometer Scan Verification of Fluid Viscosities The rheometer testing of fluid viscosities was important to verify the viscosity of the glycerol-water solution to gain an accurate idea of the viscosity ratio present in the microdroplet generators. The rheometer obtains the viscosity of a fluid by taking the shear stress of a fluid and dividing it by the shear rate. During a test, the rheometer tests a range of shear rates which yields a shear stress vs. shear rate trend line. Figure 43 below shows there are different trends depending on the type of fluid and if there is a yield stress present (a stress to be overcome for fluid flow to occur). Figure 43: Trend lines for rheology testing of different fluid types- Typical trend lines for rheology testing of different fluid types. The mineral oil, deionized water, and glycerol water solutions would all be considered Newtonian fluids within the strain rates that are feasible in microfluidic experiments that were described in Section
123 Figure 44: Shear stress vs strain rate curve for the 1:1 glycerol water solution- A shear stress vs strain rate curve of the 33cSt (theoretical) glycerol water solution. The rheometer measured a viscosity of cst at the calculated strain rate of s. 109
124 Figure 45: Shear stress vs strain rate curve for the 2:1 glycerol water solution- A shear stress vs strain rate curve of the 66cSt (theoretical) glycerol water solution. The rheometer measured a viscosity of cst at the calculated strain rate of s. 110
125 Figure 46: Shear stress vs strain rate curve for mineral oil- The rheometer measured a viscosity of cst at the calculated strain rate of s. 111
126 Figure 47: Shear stress vs strain rate curve pure glycerol- The rheometer measured a viscosity of cst at the calculated strain rate of s. 112
127 Appendix C - Bill of Materials The following represents an estimate for materials required to fabricate and test the firstgeneration droplet generators. Table 12: Bill of Materials for Droplet Generator Item Quantity Product Cost EA Vendor 1. 1 PDMS Curing Agent/Base N/A CP 2. 1 Negative Photoresist (SU-8) N/A CP mm Silicon Wafer N/A CP 4. 1 Photomask $50 CAD/Art Services, Inc Light Mineral Oil (500 ml) N/A CP µl Gastight Syringe N/A CP ml Span 80 Surfactant N/A CP mL Gastight Syringes N/A CP mL Glycerol $5 Whole Foods TOTAL N/A N/A $55 N/A 113
128 Appendix D Contact Angles of Hydrophobic PDMS Recovery and Glass Slides and PDMS Bonding There were two key parts to figuring out the window of opportunity to test hydrophilic PDMS devices after they were treated with an argon plasma. First, a preliminary test of the strength of the plasma bond was conducted to determine at what time the plasma bond was strong enough to be tested. This was validated by attempting to manually pull the two bonded plasma layers apart. If they came apart, the bond fails. If the two PDMS layers stuck together, the bond was set and was ready to proceed to testing. The results of the bond testing can be seen below in Table 13. Table 13: Plasma Bond Integrity Testing Test Device Number and Time Pass Fail #1 at 15 minutes X #2 at 30 minutes X #3 at 60 minutes X #4 at 90 minutes X #5 at 120 minutes X The plasma bond fails after 15 and 30 minutes, but passes the plasma bond integrity test at each time interval after 60 minutes. It is concluded after this test that fluid testing of the PDMS hydrophilic devices can begin 60 minutes after the argon plasma treatment. 114
129 Contact Angle ( ) The next key part to figuring out the timeline for testing the hydrophilic PDMS devices was determining the contact angle of the PDMS surface over time after the argon plasma treatment. Since PDMS has a natural tendency to recover its intrinsic hydrophobic properties, several timed interval tests were conducted to measure the contact angles of PDMS samples after argon plasma treatments [43] [59]. The contact angles of glass were also measured to determine the suitability of PDMS-Glass devices as well as to compare contact angles to literature examples of glass. The data collected can be seen below in Figures Contact Angle of Untreated PDMS PDMS Contact Angles Average Value Figure 48: Contact angle of untreated PDMS- This graph shows the contact angle measurements taken of untreated PDMS samples. The data had a mean contact angle of 117 with a standard deviation of
130 Contact Angle ( ) Contact Angle ( ) Contact Angle of Post Plasma Baked PDMS PDMS Contact Angles Average Value Figure 49: Contact angle of post plasma baked PDMS- This graph shows the contact angle measurements taken of Post Plasma Baked PDMS samples. The data had a mean contact angle of 107 with a standard deviation of Contact Angle of Treated PDMS at 0 hours PDMS Contact Angles Average Value Figure 50: Contact angle of treated PDMS at 0 hours- This graph shows the contact angle measurements taken of treated PDMS samples after 0 hours. The data had a mean contact angle of 39.9 with a standard deviation of
131 Contact Angle ( ) Contact Angle ( ) Contact Angle of Treated PDMS at 0.5 hours PDMS Contact Angles Average Value Figure 51: Contact angle of treated PDMS at 0.5 hours- This graph shows the contact angle measurements taken of treated PDMS samples after 0.5 hours. The data had a mean contact angle of 41.7 with a standard deviation of Contact Angle of Treated PDMS at 1 hour PDMS Contact Angles Average Value Figure 52: Contact angle of treated PDMS at 1 hour- This graph shows the contact angle measurements taken of treated PDMS samples after 1 hour. The data had a mean contact angle of 51.1 with a standard deviation of
132 Contact Angle ( ) Contact Angle ( ) Contact Angle of Treated PDMS at 1.5 hours PDMS Contact Angles Average Value Figure 53: Contact angle of treated PDMS at 1.5 hours- This graph shows the contact angle measurements taken of treated PDMS samples after 1.5 hours. The data had a mean contact angle of 38.1 with a standard deviation of Contact Angle of Treated PDMS at 2 hours PDMS Contact Angles Average Value Figure 54: Contact angle of treated PDMS at 2 hours- This graph shows the contact angle measurements taken of treated PDMS samples after 2 hours. The data had a mean contact angle of 58.5 with a standard deviation of
133 Contact Angle ( ) Contact Angle ( ) Contact Angle of Treated PDMS at 3 hours PDMS Contact Angles Average Value Figure 55: Contact angle of treated PDMS at 3 hours- This graph shows the contact angle measurements taken of treated PDMS samples after 3 hours. The data had a mean contact angle of 40.5 with a standard deviation of 23. Contact Angle of Treated PDMS at 4 hours PDMS Contact Angles Average Value Figure 56: Contact angle of treated PDMS at 4 hours- This graph shows the contact angle measurements taken of treated PDMS samples after 4 hours. The data had a mean contact angle of 35.0 with a standard deviation of
134 Contact Angle ( ) Contact Angle ( ) Contact Angle of Treated PDMS at 5 hours PDMS Contact Angles Average Value Figure 57: Contact angle of treated PDMS at 5 hours- This graph shows the contact angle measurements taken of treated PDMS samples after 5 hours. The data had a mean contact angle of 56.2 with a standard deviation of Contact Angle of Treated PDMS at 9.5 hours PDMS Contact Angles Average Value Figure 58: Contact angle of treated PDMS at 9.5 hours- This graph shows the contact angle measurements taken of treated PDMS samples after 9.5 hours. The data had a mean contact angle of 44.5 with a standard deviation of
135 Contact Angle ( ) Contact Angle ( ) 90 Contact Angle of Treated PDMS at 14 hours 85 PDMS Contact Angles Average Value 80 Figure 59: Contact angle of treated PDMS at 14 hours- This graph shows the contact angle measurements taken of treated PDMS samples after 14 hours. The data had a mean contact angle of 85.2 with a standard deviation of Contact Angle of Treated PDMS at 28 hours PDMS Contact Angles Average Value Figure 60: Contact angle of treated PDMS at 28 hours- This graph shows the contact angle measurements taken of treated PDMS samples after 28 hours. The data had a mean contact angle of 58.2 with a standard deviation of
136 Contact Angle ( ) Contact Angle ( ) 60 Contact Angle of Untreated Glass Glass Contact Angles Average Value Figure 61: Contact angle of untreated glass- This graph shows the contact angle measurements taken of untreated glass slides. The data had a mean contact angle of 30.2 with a standard deviation of Contact Angle of Treated Glass at 0 Hours Glass Contact Angles Average Value Figure 62: Contact angle of treated glass at 0 hours- This graph shows the contact angle measurements taken of treated glass slides at 0 hours. The data had a mean contact angle of 16.2 with a standard deviation of
137 Contact Angle ( ) Contact Angle ( ) 60 Contact Angle of Treated Glass at 0.5 Hours Glass Contact Angles Average Value Figure 63: Contact angle of treated glass at 0.5 hours- This graph shows the contact angle measurements taken of treated glass slides at 0.5 hours. The data had a mean contact angle of 24.1 with a standard deviation of Contact Angle of Treated Glass at 1 Hour Glass Contact Angles Average Value Figure 64: Contact angle of treated glass at 1 hour- This graph shows the contact angle measurements taken of treated glass slides at 1 hour. The data had a mean contact angle of 24.6 with a standard deviation of
138 Contact Angle ( ) Contact Angle ( ) 45 Contact Angle of Treated Glass at 2 Hours Glass Contact Angles Average Value Figure 65: Contact angle of treated glass at 2 hours- This graph shows the contact angle measurements taken of treated glass slides at 2 hours. The data had a mean contact angle of 23.2 with a standard deviation of Contact Angle of Treated Glass at 3 Hours Glass Contact Angles Average Value 10 0 Figure 66: Contact angle of treated glass at 3 hours- This graph shows the contact angle measurements taken of treated glass slides at 3 hours. The data had a mean contact angle of 23.6 with a standard deviation of
139 Contact Angle ( ) 45 Contact Angle of Treated Glass at 4 Hours Glass Contact Angles Average Value Figure 67: Contact angle of treated glass at 4 hours- This graph shows the contact angle measurements taken of treated glass slides at 0 hours. The data had a mean contact angle of 24.1 with a standard deviation of


140 Appendix E Soft Lithography Processing Protocol for PDMS Microfluidic Devices This guide details the processing steps taken in soft lithography to deposit either positive or negative photoresist onto a silicon wafer to be used as a PDMS mold. The sectioned layers of the silicon wafer can be seen on the left columns while the right column contains pictures of the corresponding soft lithography step. The processing steps are used for the Cal Poly clean room laboratory and cited from Microdroplet Generators [14] and [15]. Step 1. Piranha - Clean Si Wafer Step 2. Apply SU-8 Photoresist 126

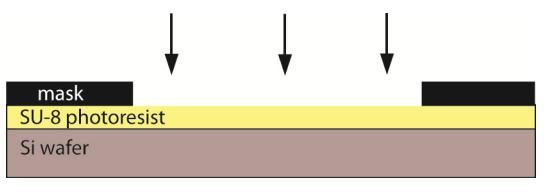

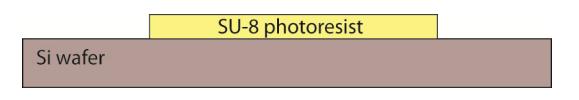
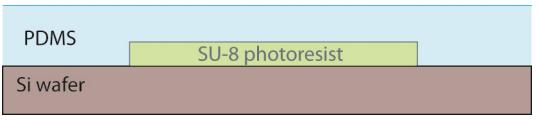

141 Step 3. Define Microfluidic Channel Pattern - Expose Resist Step 4. Develop Photoresist Step 5. Pour PDMS, Degas PDMS, Cure PDMS 127


142 Step 6. Cut and Remove PDMS Device from Mold Step 7. Punch Holes in PDMS for Device Inlets and Outlets 128


143 Step 8. Plasma Treat PDMS Surfaces to be Bonded Together Using the process traveler in the microfabrication lab for soft lithography and microfluidic devices, the silicon wafer and SU8 mold for the droplet generator was fabricated. For this device, the channel depth was set at 65 ums to maintain dimensional consistency with the channel widths. This affects different bake times and the spin speeds of the procedures. Using the photomask from the CAD model of the design, the procedure to make the microfluidic device was used: 1. Piranha Clean Si Wafer a. H2SO4: H2O2 (9:1) at 70 C for 10 minutes b. Rinse in deionized (DI) water c. Buffered Oxide Etch (BOE) at 25 C for 30 seconds d. Rinse in DI water e. Spin rinse & dry in Semitool PSS-101 f. Dehydrate bake on hot plate at 150 C for 5-10 minutes 129
144 2. Apply SU-8 Photoresist a. Negative resist (MicroChem SU ) b. Pre-treat surface with MicroChem MCC 80/20 Primer c. Dispense 4 ml at center of wafer (syringe or pour), static d. Spin off excess at 200/500 RPM e. Spin up to final thickness at 2,250 RPM for 35 seconds - Target 65 µm f. Soft bake at 65 C for 1.5 min then 95 C for 7.5 min 3. Define Microfluidic Channel Pattern - Expose Resist a. Expose photoresist to UV light source for 27.6 seconds (photolithography) b. Exposure dose dependent on resist thickness c. Manual exposure mode (press STOP then use UNIFORMITY to operate shutter) d. Mask in conformal contact with resist (no gap) 4. Develop Photoresist a. Post Exposure Bake (PEB) at 65 C for 1.5 min then 95 C for 6.5 min b. Immerse wafer in MicroChem SU-8 developer at 25 C for 8.3 minutes (time is thickness dependent) c. After development is complete, rinse with isopropyl alcohol (IPA), dry with N2. d. Hard bake at 150 C for 5 min 5. Pour PDMS, Degas PDMS, Cure PDMS a. Mix PDMS (Sylgard 184): base & curing agent (10:1 ratio) b. Place wafer/su-8 photoresist mold into plastic Petri dish 130
145 c. Pour uncured PDMS over photoresist mold d. Degas liquid PDMS to remove air bubbles (~ 20 min) e. Cure PDMS in oven at 75 C for at least 90 min 6. Cut and Remove PDMS Device from Mold a. Cut cured PDMS around device region (use sharp razor blade - don't crack wafer) b. Carefully peel up PDMS device from mold c. Do not put 'channel side' of PDMS device onto unclean surfaces (cover with tape) d. Re-use wafer/su-8 photoresist mold if necessary (continue to pour and cure until mold is not needed or destroyed) 7. Punch Holes in PDMS for Device Inlets and Outlets a. Using a sharpened 16 gage needle (OD = 0.065", ID = 0.047") punch holes in PDMS at channel inlets and outlets. b. Punch holes with PDMS oriented 'channel side' up c. Do not twist the punch - straight through d. Mount plain PDMS slab on glass slide to act as fourth wall of device channels 8. Plasma Treat PDMS Surfaces to be Bonded Together a. Plasma treat both PDMS surfaces using Argon plasma system b. Gently place plasma treated surfaces together to let bond (don't unpeel after this is done or bond will not be effective) 131
 Figure 68: Microfabrication process lithography with photomask, SU8 photoresist, and PDMS")
146 c. Place PDMS device back in curing oven at 75 C for at least 3 hours prior to use (This step is only for hydrophobic devices; hydrophilic devices will not have a post plasma bake step) Figure 68: Microfabrication process lithography with photomask, SU8 photoresist, and PDMS devices. 132