High-Resolution and Quantitative AFM Mapping of The Mechanical Properties of Polymers
|
|
|
- Eleanor Caldwell
- 5 years ago
- Views:
Transcription

1 High-Resolution and Quantitative AFM Mapping of The Mechanical Properties of Polymers Sergei Magonov 1, Marko Surtchev 1, Sergey Belikov 1, Ivan Malovichko 2 and Stas Leesment 2 1 NT-MDT Development Inc., Tempe AZ USA 2 NT-MDT, Zelenograd-Moscow, Russia
2 Outline 1. Studies of Local Mechanical Properties in AFM 2. Quantitative Nanomechanical (QNM) Experiments in HybriD Mode 3. QNM of Neat Polymer Samples 4. QNM of Polymer Blends 5. High-Resolution QNM Mapping 6. Conclusions 2 of 21 2 of 23


3 Studies of Local Mechanical Properties in AFM AFM Modes Contact Mode AFM Operator & Operating Procedures Loading & Aligning a Probe Single probe and multi-probe cartridge; manual and automatic alignment Oscillatory Loading Resonance of a Sample Mode: Amplitude Manual Modulation and automatic loading Deflection-vs-Distance Curve Max. -vs-amplitude E, GPa PVAC Max. Force-vs-Amplitude E, GPa DMT: E el =2.9 GPa O-P: E el =2.3 GPa Amplitude-vs-Distance Curve LDPE Engagement of a Probe Manual and automatic engagement; soft approach algorithm Oscillatory Non-Resonance Mode: Hybrid Mode Measurements Routines Studies at variable tip-forces; automated and non-attended multi-site and multi-probe experiments Deflection-vs-time Curve Deflection-vs-Distance Curve Currently HybriD Mode is most optimal for Quantitative Nanomechanical Studies and High-Resolution Mapping of and Adhesion 3 of 21


4 Phase Studies of Local Mechanical Properties in AFM Comparison of Tip-Sample Forces in Different AFM Modes Amplitude Modulation Mode HybriD Mode Contact Mode Dodecanol Adsorbate on MoS nm 90 nm 7 nm All three modes complement each other in the nanoscale characterization of materials. The contact mode is most suitable for lateral force imaging and piezoresponse studies. The amplitude modulation is superior for operation at low forces and for multifrequency approaches in studies of local electric properties. 4 of 21

 Point-by-Point Calculation of and Work of Adhesion from Region of")
 Elastic modulus and Work of Adhesion Maps are collected as the arrays up")
5 Quantitative Nanomechanical Study in HybriD Mode On-Line and Off-Line Analysis of Force-versus-Time or Force-versus- Cures Fit of the Force-vs-Time Inverted Parabola Curve or Part of It to Find Average and Work of Adhesion (I. Malovichko, NT-MDT) Point-by-Point Calculation of and Work of Adhesion from Region of Interest of Forceversus- Curve (S. Belikov, NT-MDT) Elastic modulus and Work of Adhesion Maps are collected as the arrays up to size. On-line and off-line analysis can be performed using Hertz, DMT and JKR models. 5 of 21

6 Finding of Probe Spring Constant and Optical Sensitivity Inverse optical sensitivity (IOS) can be obtained from Dvt & DvZ curves in the HybriD and contact modes. Hertz: dd 2a dh k Error Propagation in QNM Analysis of Force Curves P kd E r 4 3 E dd dh r 3 a, R 2 a h R 1 1 dd / dz 1 1 y x 1 x QNM Study in HybriD Mode: Experimental Details DMT: P y 1 h x x 4 3/ 2 E 3 2aEr x 2 ae k r Rh 2 wr x = DvZ; y = Dvh Table 1. Probes with Minimal k (N/m) for Material with Modulus E (Pa) & Error Propagation of 2 E, Pa 10M 50M 0.1G 0.5G 1G 3G 5G 10G 20G 30G 40G k, N/m 710m Samples: 1. Neat polymers in blocks: Polycarbonate (PC), Low-density polyethylene (LDPE), octenebranched polyethylene with density 0.87 g/cm 3 (PE87) 2. Polymer blends as films with thickness above 100 nm: Polystyrene-PS with LDPE (PS LDPE), PS with poly(methyl methacrylate) (PS/PMMA), PS with high-density polyethylene (PS HDPE), PS with poly(butadiene) (PS/PBd), PS with poly(vinyl acetate) (PS/PVAC), syndiotactic PS with poly(vinyledene fluoride) (sps/pvdf) 3. Films of block copolymers (PS-b-PMMA, PS-b- PBd-b-PS) and blocks of semicrystalline HDPE and linear low-density polyethylene (LLDPE) Experimental: Si probes with stiffness of k = 25 N/m and 28 N/m and a nominal tip radius of 10 nm were applied. Force range was in the 5 nn nn range Scan rate was in the Hz range Oscillation amplitude: 20 nm at 1. 5 khz; for soft samples - up to 100 nm at 1.5 khz. Typical Map density 512 x 512 Saving Force Curve (Force Volume) - optional 6 of 21


7 Thermal, Acoustic, Vibration Enclosure C Temperature stability better than 0.01C Thermal drift lower than 0.2 nm/min Silver Nanoparticles on Mica: Scans ( ) with 1 Hz rate 7 of 21


8 QNM of Neat Polymers: Polycarbonate Block Fvt FvZ 1 mm 1 mm Elastic modulus Work of Adhesion 1 mm 1 mm 8 of 21


9 QNM of Neat Polymers: Low-Density PE Block Fvt FvZ 1 mm 1 mm Elastic modulus Work of Adhesion 1 mm 1 mm 9 of 21


10 QNM of Neat Polymers: Octene-PE 0.87 Block Fvt FvZ 1 mm 1 mm Work of Adhesion 1 mm 1 mm 10 of 21


11 QNM of Polymer Blends: PS/PBd Phase 6 nn 5 mm 1.5 mm 1.5 mm 1.5 mm, 6 nn, 1.5 mm 1.5 mm 11 of 21


12 QNM of Polymer Blends: PS/LDPE 5 mm 5 mm 5 mm 2 mm 2 mm 2 mm 12 of 21


13 QNM of Polymer Blends: PS/HDPE Phase 7 mm 7 mm 7 mm 7 mm 2 mm 2 mm 2 mm 13 of 21


14 QNM of Polymer Blends: PS/PMMA Map of PMMA Raman Band 20 mm 20 mm 2 mm 2 mm 80 nn 2 mm 2 mm 14 of 21


15 QNM of Polymer Blends: PS/PVAC 7 mm 7 mm 2 mm 2 mm 2 mm 15 of 21


16 QNM of Polymer Blends: sps/pvdf Work of Adhesion 6 mm 6 mm 6 mm 6 mm 16 of 21


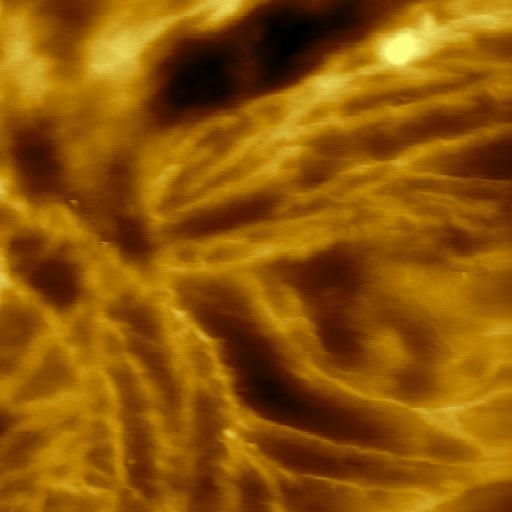
17 High-Resolution QNM of Polymers: HDPE 3 mm 1 mm 1 mm Work of Adhesion 400 nm 400 nm 400 nm 17 of 21


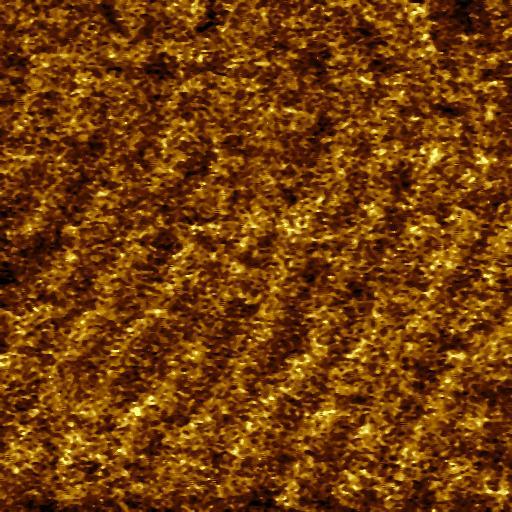
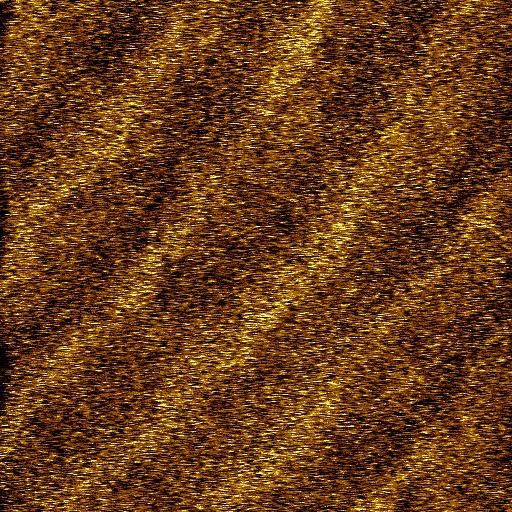
18 High-Resolution QNM of Polymers: LLDPE Phase 3 mm 1 mm 1 mm 1 mm 1 mm 18 of 21


19 High-Resolution QNM of Polymers: PS-b-PB-b-PS Work of Adhesion 1 mm 400 nm 400 nm 400 nm 150 nm 150 nm 150 nm 19 of 21


20 High-Resolution QNM of Polymers: PS-b-PMMA 6 nn 25 nn 1 mm 1 mm 1 mm 1 mm 400 nm 400 nm 400 nm 20 of 21
21 Conclusions QNM measurements of polymer samples in HybriD mode verified the value of quantitative mapping of elastic modulus for characterization of polymers and, particularly, for compositional mapping of heterogeneous materials. High spatial resolution of modulus mapping approaching 10 nm was demonstrated on lamellar structures of semicrystalline polymers and block copolymers. These results provide a solid background for studies of mechanical properties of polymers at interfaces and in other confined geometries. A combination with local electric and spectroscopic methods will make such studies even more comprehensive. In our next HybriD mode applications we will address the viscoelastic behavior of polymers. 21 of 21