MRG: Metabolomics Research Group
|
|
|
- Kathryn Townsend
- 5 years ago
- Views:
Transcription
1 MRG: Metabolomics Research Group Amrita K Cheema: Georgetown University Allis Chien: Stanford University (Liaison) Maryam Goudazi: Georgetown University Tytus Mak (NIST) Andrew Patterson (Penn State) Chris Turck: Max Planck Institute (Chair)
2 J Biomol Tech Sep;26(3):83-9. doi: /jbt The ABRF Metabolomics Research Group 2013 Study: Investigation of Spiked Compound Differences in a Human Plasma Matrix. Cheema AK, Asara JM, Wang Y, Neubert TA, Tolstikov V, Turck CW Abstract Metabolomics is an emerging field that involves qualitative and quantitative measurements of small molecule metabolites in a biological system. These measurements can be useful for developing biomarkers for diagnosis, prognosis, or predicting response to therapy. Currently, a wide variety of metabolomics approaches, including nontargeted and targeted profiling, are used across laboratories on a routine basis. A diverse set of analytical platforms, such as NMR, gas chromatography-mass spectrometry, Orbitrap mass spectrometry, and time-of-flight-mass spectrometry, which use various chromatographic and ionization techniques, are used for resolution, detection, identification, and quantitation of metabolites from various biological matrices. However, few attempts have been made to standardize experimental methodologies or comparative analyses across different laboratories. The Metabolomics Research Group of the Association of Biomolecular Resource Facilities organized a "round-robin" experiment type of interlaboratory study, wherein human plasma samples were spiked with different amounts of metabolite standards in 2 groups of biologic samples (A and B). The goal was a study that resembles a typical metabolomics analysis. Here, we report our efforts and discuss challenges that create bottlenecks for the field. Finally, we discuss benchmarks that could be used by laboratories to compare their methodologies.


3 Metabolomics is Concerned with the Simultaneous, Comprehensive Measurements of Small Molecules DNA Genomics 20,000 30,000 Genes RNA Transcriptomics ~100,000 transcripts Protein Proteomics ~1,000,000 proteins Biochemicals O H O O H N H 2 L-threonine N N H N H 2 N adenine N O H H O O O H glucose O H O H Metabolomics 2,500 25,000 small molecules


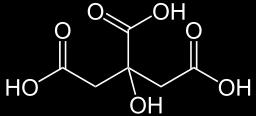
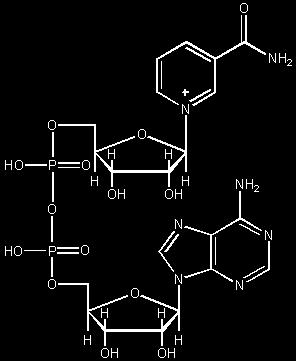
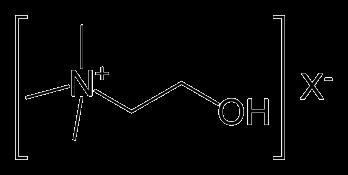
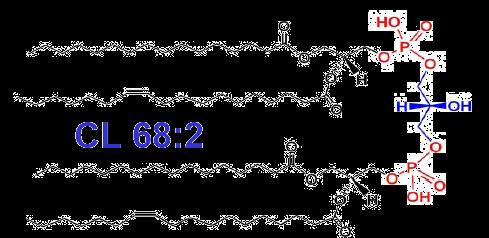
4 Chemical Diversity of the Metabolome H N NH 2 Citric acid C H 2 CH C Tryptophan HO O Choline Acetylcholine Ascorbic Acid (Vitamin C) Cholestenoic Acid Biotin (Vitamin B7) AMP Ceramide NAD ATP Cardiolipin


5 Untargeted Metabolomics Workflow Experimental Design Sample Collection Sample Preparation Extraction LC/MS Profiling Data Processing Data Analysis and Statistics ID Validation Compound Identification Biochemical Analysis and Pathway Mapping
6 Current Challenges in Untargeted Metabolomics Sample Preparation Computational Approaches Compound Identification
7 Sample Preparation Not a uniform approach Each approach needs to be validated across multiple studies Variable preparation approaches can enhance extraction of certain groups of metabolites Missed metabolites Metabolite unstable Sample loss
8 Multiple Computation Approaches for Metabolomics Data Analyses Pre-processing Software Progenesis XCMS mzmine Vendor specific software Computational Approaches Online tools: Metaboanalyst; Mummichog In house scripts: R-based; Matlab SAS; SPSS


 characterization")
9 Untargeted Metabolomics Compound Identification Challenges No linear blueprint Playing field is ill-defined? Most metabolites uncharacterized Limited availability of pure standards for metabolites Custom synthesis of unavailable metabolites from $1K-40K How many metabolites are we looking for? MS/MS Fragmentation patterns Limited library (MS/MS) characterization Libraries not centralized Not predictable (as with peptides) MSMS reference only for a single mode or adduct


10 MRG 2016 Study Outline LCMV extract Step 1: Untargeted metabolomic profiling infect time align analyze days 1,3,7,14 TOF MS m/z Step 2: Pre-process XCMS and upload to ABRF web site Step 3: Data analysis and reporting by participant MRG2016_Submission_Template.xlsx ssion_template.xlsx
11 MRG Inter-Laboratory Metabolomics Study 2016 Design a study that resembles an untargeted metabolomics profiling experiment comparing biological changes under different conditions (exposure to Sham vs 5 Gy) Participants will identify statistically significant differences between groups A & B of samples in order to compare findings with varied methodologies Goal: Examine challenges, overlap and variability in results between approaches to LC-MS metabolomics data analysis
12 Sample Preparation Aliquots of urine sample were processed with extraction solution for 5 biological replicates for group A and B Group A: Sham/0 Gy Group B: 5 Gy Extraction buffer composed of (30% acetonitrile + 40% methanol + 30% water) spiked with internal standards Internal standards: 4-nitrobenzoic acid (O 2 NC 6 H 4 CO 2 H; MW: ), m/z (M-H) - debrisoquine (C 10 H 13 N 3 ; MW: ), m/z (M+H) +
13 LC-MS Experiment Platform: Waters Xevo G2 QTOF-MS with Acquity H UPLC All 10 samples were run with duplicate technical replicate Three pooled QC injections (one every 10 injections) Both ESI Positive and Negative Binary gradient: Water +0.1% Formic Acid/ Acetonitrile +0.1% Formic Acid Column: Acquity UPLC BEH C18 1.7um 2.1 x 50mm at 40C
14 Quality Control Blanks examine carryover throughout run
15 MS Quality Control Small Molecule Standard Cocktail: Pre- and Post- MS Analysis Ensure Mass Accuracy <5ppm Component Empirical Formula Exact mass [M+H]+ Exact mass [M-H]- Acetaminophen C8H9NO Sulfaguanidine C7H10N4O2S Sulfadimethoxine C14H14N4O4S Val-Tyr-Val C19H29N3O Terfenadine C32H41NO Leucine enkephalin C28H37N5O Positive Mode Negative Mode Initial Final Initial Final Expected m/z Mass Error Actual m/z (ppm) Expected m/z Mass Error Actual m/z (ppm) Expected m/z Mass Error Actual m/z (ppm) Expected m/z Mass Error Actual m/z (ppm)
16 Quality Control Base Peak Intensity for pooled QC injections compared to examine response throughout the entire experiment Overlays utilized to examine reproducibility and consistency
17 Data Processing RAW files converted to netcdf Peak picking and alignment performed using XCMS Data uploaded to and accessible through Bioshare FTP bioshare.bioinformatics.ucdavis.edu/bioshare/view/t thvputgo2am4yo/: Masslynx RAW data files netcdf files XCMS-based preprocessed csv
18 Validation and Characterization Additional rounds of compound vetting and validation upon completion of reporting Compound validation with commercially available standards MS/MS libraries, and predicted fragmentation (e.g. Mass Fragment)
19 Result Reporting Finding should be reported using the MRG2016_Submission_Template.xlsx (accessible from the FTP site o2am4yo/mrg_2016_submission_template.xlsx) Additional procedures outlined in report ABRF-MRG2016 Metabolomics Research Group Data Analysis Study MS Analysis should include: m/z, RT, ion mode of each compound (mass spectrometry) Molecular formula (or multiple formulas if ambiguous) Fold-change Statistical metrics for difference detection Putative identity of the compound (based on accurate mass)
20 ABRF-MRG Survey Participant need to complete the brief online survey accessible through: Please provide a detailed description of your methodology in the appropriate textboxes. MRG requests that each participant prepare a short write-up that summarizes the approach that was taken, the methods that were used, and the key findings that were obtained. These anonymous write-ups will be posted online and linked to each participant's results. Please your anonymous write-up as a pdf file along with to completed MRG2016_Submission_Template.xlsx to: anonymousmrg2016@gmail.com The file name should include the 5-digit code that you entered at the beginning of the online survey.
21 Expected Outcomes The primary objective of this study is to examine reproducibility and optimal data analysis strategies for metabolomics studies: Compare the relative quantitative metabolite differences across two sample types reported by participants Examine effects of different computational techniques on the determination of significantly altered metabolites in the two groups. Assess the level of confidence and consistency in the results obtained from unique computational and chemometric approaches. Compare ability of software to determine differences across samples or help analyze data from metabolomics experiments Compare databases used for assigning metabolite ID
22 Acknowledgements MRG members: Amrita, Allis, Maryam, Tytus, Andrew ABRF Susan DeCourcey, Jonathan Korman, Brett Phinney Cheema Lab: Tyrone Dowdy
23 QUESTIONS??? Contacts: Chris Turck: Amrita Cheema: