Haemotherapies. Extracted from blood, directly, or from plasma. plasma protein therapies.
|
|
|
- Morris Ferguson
- 5 years ago
- Views:
Transcription


1 The Global need fo or Plasma Protein Therapies How Much is Enough? Albert Farrugia VP Global Access PPTA a/prof Department of Surgery, University of Western Australia Visiting Fellow, School of Medicine, Australian National University 40 CONVEGNO NAZIONALE DI STUDI DI MEDICINA TRASFUSIONALE, SIMTI, Rimini 23/05/ /05/2012
2 Haemotherapies Extracted from blood, directly, or from plasma Directly extracted therapies are known as blood components Acute medical and surgic cal situations (mostly) The products of industrial plasma fractionation are known as plasma protein therapies Chronic, rare diseases (m mostly) There are crucial differences between these products
3 Blood components Derived from individual donors Minimally processed Delivered from the NFP sector Minimally regulated GMPs No efficacy assessment Historical use Evidence base? Common sense? Haemotherapies Differences (generally) Plasma protein therapies Derived from plasma pools (> 60 K donors) Intensively manufactured Delivered from the FP sector Strongly regulated GMPs Standards Efficacy assessment Post market oversight Etc etc Historical AND evidence based use


4 The gift of history "... the patient expresses herself very strongly on the benefits resulting from the injection of the blood; her observations are equivalent to this - that she felt as if life were infused into her body" Blood components
5 Blood components Do they work? RCCs To increase oxygen delive ery to the tissues but t Do tx red cells increase VO 2? Platelets 1. Yes, around the critical [H b] ie about 50g/l, but 2. At 80 g/l, no obvious effect (Walsh et al 2004) 1. PLADO study Low vs Medium vs High dose platelets 2. Same clinical outcome irrespective of dose FFP Two higher quality trials - No benefit reported in ei ther trial Both evaluated prophylaxis
6 Blood components Are they safe? Tell em Mo Blood Kills!
7 Blood Kills! Some recent examples Intraoperative Transfusion of Small Amounts of Blood Heralds Worse Postoperative Outcome in Patien nts Having Non-cardiac Thoracic Operations - The Annals of Thoracic Surgery Volume 91, Issue 6, June 2011, Pages Platelet Transfusion During Liver Transplantation Is Associated with Increased Posto perative Mortality Due to Acute Lung Injury - Anesth Analg 20 Effect of Blood Products Transfusion on the Development of Postinjury Multiple Organ Failure - Arch Surg. 2010;145(10): ;108:


8 Blood Kills! Transfusionn of older stored blood and risk of death Compared to the risks suggested by emerging evidence on stored red cells, these risks are insignificant Transfusion 2011 doi: /j x
9 Survival after blood component transfusion ta suso Transfusion Volume 44, Issue 7, pages , July 2004


10 The blowtorch of evidence based medicine Plasma Protein Therapies E B M SAFET TY AND EFFICAC CY THE ERAPEUT TIC CLAI IM
11 Effect of PPTs on mortality in chronic c diseases
12 Plasma Protein Therapies Evidence International variations What is the real clinical ca demand? d Costs Treatments are expensive Cost effectiveness analy ysis
13 The international demand landscape
14
15
16 IgG levels and risk of pneumonia
17 IgG levels and risk of pneumonia Orange

18 IgG levels and risk of pneumonia Orange MA 2010 Quinti 5 year prospective study 2011
19 Role of IgA levels Quinti et al 2011

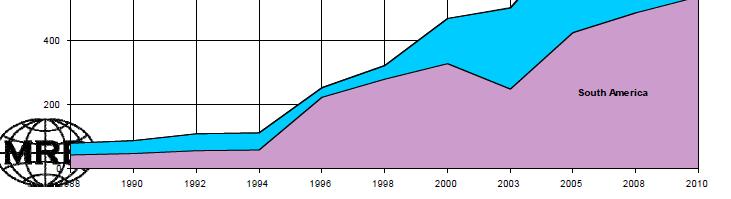
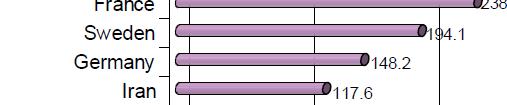
![For instance, the per capita IVIg use in the 15 member states of the form mer EU in 2007 [2] was 55 g per 1000 population, while in North America its use (120](/docs-images/87/95229082/images/20-3.jpg "g in 2008) was three times higher than in Germany (36 g) and 50% higher that of France (79 g).")
20 Waste? Evidence?..WHO recently distinguished demand, use and needs for patients. Despite the progressive global increase in the use of IVIg,there are wide variations of per capita product demand between developed countries. For instance, the per capita IVIg use in the 15 member states of the form mer EU in 2007 [2] was 55 g per 1000 population, while in North America its use (120 g in 2008) was three times higher than in Germany (36 g) and 50% higher that of France (79 g).furthermore, there is no evidence that clinical outcomes are inferior in countries that have developed robust therapeutic evidence-based d systems for optimal use
21 The concept of Latent Therapeutic Demand Stonebraker 2004 et seq Latent therapeutic demand (LTD) is the underlying demand that represents how physicians would prescribe treatment and how patients would follow or comply with the prescrib bed treatment if ample supplies of drugs were available and affordable (in this case grams of Ig per 1000 population)
22 Methodology based decision analysis to estimate latent therapeutic demand (LTD) for primary immune deficiency y( (PID). (1) Focus on Common Variable Immunodeficiency (CVID ) and X-Linked Agammaglobulinemia (XLA). (2) Identified and defined the variables impacting LTD for PID through a literature review of PID disease epidemiology and its treatment and discussions with experts. (3) Constructed an influence diagram to model the variables impacting LTD for PID and their interrelationships. (4) Obtained range estimates for each variable from published articles. (5) Conducted sensitivity analysis using a tor rnado diagram to order variables in terms of their impact on LTD for PID. (6) Modeled the uncertainty surrounding the most sensitive variables.
23 By changing the model inputs, the key drivers of the output are identified and a probability distribution for the output can be generated INPUTS Latent Therapeutic Demand (LTD) Model OUTPUT Tornado Diagram Probability Distribution 10% 9% 8% 7% 6% 5% Probability 4% 3% 2% 1% 0% Latent Therapeutic Demand (LTD) (grams per 1,000 inhabitants)
24 esults Model Variables Epidemiology Diagnosed Prevalence (per 100,000 population) Age Group of Patients Patient Gender Patient Weight Population Treatment Treatment Rate Administration IVIG vs. SCIG Compliance Rate Treatment Dosage Treatment tinterval
25 esults Integration of variables into model Epidemiology Related Variables Age Group of Patients Patient Gender Patient Weight Population Diagnosed Prevalence Number of Patients Treatment Rate Latent Therapeutic Demand (LTD) Treatment Related Variables Administration Compliance Rate Treatment Dosage Treatment Intterv val Treatment per Patient
26 esults Diagnosed prevalence is the key driver for LTD of Ig in CVID Diagnosed Prevalence IVIG Treatment Dose Treatment Rate Patient Weight IVIG Treatment Interval SCIG Treatment Interval SCIG Treatment Dose IVIG Compliance Rate Administration SCIG Compliance Rate Age Group of Patients Patient Gender Latent Therapeutic Demand for CVID (grams per 1,000 inhabitants)
27 CVID 30% All inputs 10% Base case Joshi et al Probability 27.5% 25% 22.5% 20% 17.5% 15% 12.5% 10% 7.5% 5% The probability distribution of latent therapeutic demand for CVID is skewed right with a mean of 44 grams per 1,000 inhabitants (median of 37 and standard deviation of 43). Probability 9% 8% 7% Distribution no longer skewed but 6% LTD stays 44 5% g/1000 4% 3% 2% 2.5% 1% 0% Latent Therapeutic Demand for CVID (grams per 1,000 inhabiitants) Licensed by Syncopation Software for educational and non-commercial research purposes only. 0% Latent Therapeutic Demand for CVID (grams per 1,000 inhabiitants) Licensed by Syncopation Software for educational and non-commercial research purposes only
28 esults The IG latent therapeutic demand (LTD) for the treatment of CVID alone is larger than most countries IG consumption across all disease indications. 10% 9% 8% 7% Mean = 44 80% confidence range: % Probability 5% 4% 3% 2% 1% 0% Latent Therapeutic Demand for CVID (grams per 1,000 inhabiitants) Licensed by Syncopation Software for educational and non-commercial research purposes only.


29 North America Europe
30
31 Prevalence of Haemophilia A Effect of FVIII usage Quality of life Life span
32 Swedish patients on prophylaxis early start of prophylaxis continuing i throughouth t the lifespan has been successful in virtually eliminating joint bleeds, preserving a close to normal joint status, and keeping patients healthy and able to live normal lives. 5 0 Age at start Joint Sco ore Factor usage X10 3 IU/kg/year European Journal of Haematology 88 ( )
33 Cost Utility analysis of prophylaxis vs OD therapy

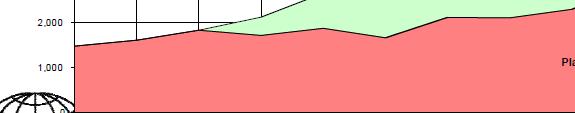
34 Factors impacting on FVIII demand 6.66 IU unconstrained demand Haemophilia (2004), 10, 18 26
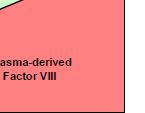
35 Observed FVIII consumption Haemophilia (2004), 10, 18 26


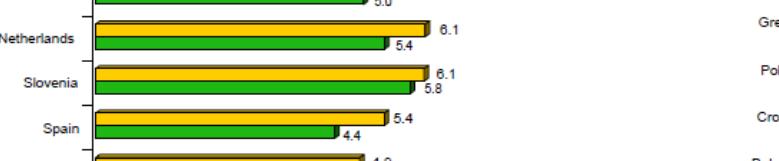
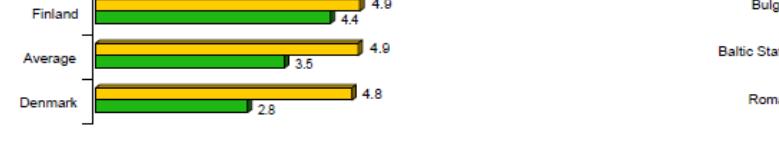


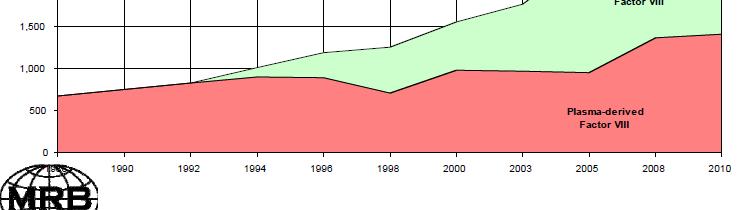
36 FVIII usage in Europe
37 Haemophiliaa A - association between annua number of joint bleeds and factor level Den Uijl et al Haemophilia (2011), 17, 41 44


38


39
40 Some quick thoughts on GETTING THE RAW MATE ERIAL
41 WHO s Twelve core interventions to promote more rational use of medicines 1. A mandated multi-disciplinary national body to coordinate medicine use policies 2. Clinical i l guidelines 3. Essential medicines list based on treatments of choice 4. Drugs and therapeutics committees in districts and hospitals 5. Problem-based pharmacotherapy training in undergraduate curricula 6. Continuing in-service medical education as a licensure requirement 7. Supervision, audit and feedback 8. Independent information on medicines 9. Public education about medicines 10. Avoidance of perverse financial incentives 11. Appropriate and enforced regulation 12. Sufficient government expenditure to ensure availability of medicines and staff


42 ustralian Ig provision eflects many of WHO s olicies Single government payer Product supplied free to all patients Expert advisory committee to reimbursement agency Evidence based guidelines Gate-keeping role strict ti t adherence to Level 1 indications How much plasma is needed? A proposed p callibrator
43 Plasma How Much? On the basis of Usage of 120 g/10000 population Ig yield of 4g/L of plasma Ig needs can be met through 30L of plasma/1000 population This will also generate 6 IU/per capita FVIII
44 Plasma From where? Options for plasma procurement Recovered from blood donations Sourced from plasmapheresis If recovered Assume 95% of donation ns are packed, each donation 250ml of plasma Need to collect 126 units of whole blood per 1000 population!
45 Plasma Production The Top Ten Country Plasma production L/1000 populatio n Donor status United Stated 66 Austria Czech Republic 33 Germany 31.6 Uncompensated and compensated Uncompensated and compensated Uncompensated and compensated Uncompensated and compensated Australia 21.5 Netherlands Denmark 17 France 16.3 Sweden 16.1 Belgium 15.5 Uncompensated Uncompensated Uncompensated Uncompensated Uncompensated Uncompensated


46 Plasma collection worldwide Some realities
47 Summary and conclusions Plasma protein therapies are assessed for evidence of clinical benefit Our understanding of many of these benefits is still evolving On the basis of current evidence, the major product groups are under used Assessing whole of life treatment demonstrates cost effectiveness of the therapies Plasma requirements are being met predominantly from the for-profit sector with compensated donors