WHEAT BLAST: QUANTITATIVE PATHWAY ANALYSES FOR THE TRITICUM PATHOTYPE OF MAGNAPORTHE ORYZAE AND PHENOTYPIC REACTION OF U.S.
|
|
|
- Felix Briggs
- 5 years ago
- Views:
Transcription
1 WHEAT BLAST: QUANTITATIVE PATHWAY ANALYSES FOR THE TRITICUM PATHOTYPE OF MAGNAPORTHE ORYZAE AND PHENOTYPIC REACTION OF U.S. WHEAT CULTIVARS by CHRISTIAN D. CRUZ B.S., Escuela Agrícola Panamericana El Zamorano, 2002 M.S., The Ohio State University, 2008 AN ABSTRACT OF A DISSERTATION submitted in partial fulfillment of the requirements for the degree DOCTOR OF PHILOSOPHY Department of Plant Pathology College of Agriculture KANSAS STATE UNIVERSITY Manhattan, Kansas 2013
2 Abstract Wheat blast, caused by the Triticum pathotype of Magnaporthe oryzae (MoT), is a serious disease of wheat causing yield failures and significant economic losses during epidemic years in Brazil, Paraguay, and Bolivia. Although outbreaks occur only sporadically, wheat blast is considered a major disease affecting wheat production in South America and may be a threat to the wheat crop in the United States. Wheat is a major crop in the U.S. and wheat exports from the U.S. are important to food security of several countries around the World. Thus, it is important to understand the potential for MoT entry and establishment into the U.S. and to test U.S. wheat cultivars for susceptibility to MoT. The hypotheses of this research project were a) importing wheat grain from Brazil does not pose a risk for MoT establishment in the U.S., and b) resistance to MoT head infection does not exist in U.S. hard red winter wheat elite cultivars. Quantitative pathway analysis models were used to estimate the risk of MoT entry and establishment, in the coterminous U.S. and in a more targeted area within southeast North Carolina, via the importation of wheat grain from Brazil. The pathway model predicted that significant risk for MoT entry and establishment exists in some areas of the U.S. However, in approximately 60% of the coterminous U.S. winter wheat production areas the risk of MoT establishment was estimated to be zero. With respect to winter wheat growing areas in the U.S., conditions for MoT establishment and wheat blast outbreak occur only in small, restricted geographic areas. A higher resolution pathway analysis based on a ground transportation corridor in North Carolina indicated that conditions for MoT establishment exist seven out of ten years. Among U.S. cultivars tested, a continuum in severity to head blast was observed; cultivars Everest and Karl 92 were highly susceptible with more than 90% disease severity, while cultivars PostRock, Jackpot, Overley, Jagalene, Jagger, and Santa Fe showed less than 3% infection.
3 WHEAT BLAST: QUANTITATIVE PATHWAY ANALYSES FOR THE TRITICUM PATHOTYPE OF MAGNAPORTHE ORYZAE AND PHENOTYPIC REACTION OF U.S. WHEAT CULTIVARS by CHRISTIAN D. CRUZ B.S., Escuela Agrícola Panamericana El Zamorano, 2002 M.S., The Ohio State University, 2008 A DISSERTATION submitted in partial fulfillment of the requirements for the degree DOCTOR OF PHILOSOPHY Department of Plant Pathology College of Agriculture KANSAS STATE UNIVERSITY Manhattan, Kansas 2013 Approved by: Co-Major Professor William W. Bockus Approved by: Co-Major Professor James P. Stack
4 Copyright CHRISTIAN D. CRUZ 2013
5 Abstract Wheat blast, caused by the Triticum pathotype of Magnaporthe oryzae (MoT), is a serious disease of wheat causing yield failures and significant economic losses during epidemic years in Brazil, Paraguay, and Bolivia. Although outbreaks occur only sporadically, wheat blast is considered a major disease affecting wheat production in South America and may be a threat to the wheat crop in the United States. Wheat is a major crop in the U.S. and wheat exports from the U.S. are important to food security of several countries around the World. Thus, it is important to understand the potential for MoT entry and establishment into the U.S. and to test U.S. wheat cultivars for susceptibility to MoT. The hypotheses of this research project were a) importing wheat grain from Brazil does not pose a risk for MoT establishment in the U.S., and b) resistance to MoT head infection does not exist in U.S. hard red winter wheat elite cultivars. Quantitative pathway analysis models were used to estimate the risk of MoT entry and establishment, in the coterminous U.S. and in a more targeted area within southeast North Carolina, via the importation of wheat grain from Brazil. The pathway model predicted that significant risk for MoT entry and establishment exists in some areas of the U.S. However, in approximately 60% of the coterminous U.S. winter wheat production areas the risk of MoT establishment was estimated to be zero. With respect to winter wheat growing areas in the U.S., conditions for MoT establishment and wheat blast outbreak occur only in small, restricted geographic areas. A higher resolution pathway analysis based on a ground transportation corridor in North Carolina indicated that conditions for MoT establishment exist seven out of ten years. Among U.S. cultivars tested, a continuum in severity to head blast was observed; cultivars Everest and Karl 92 were highly susceptible with more than 90% disease severity, while cultivars PostRock, Jackpot, Overley, Jagalene, Jagger, and Santa Fe showed less than 3% infection.
6 Table of Contents List of Figures... viii List of Tables... xi Acknowledgements... xii Dedication... xiii Chapter 1 - Wheat Blast Literature Review... 1 Plant Biosecurity... 5 References... 9 Chapter 2 - Quantitative pathway analyses to estimate the probability of Magnaporthe oryzae (Triticum pathotype) entry and establishment into the U.S Abstract Introduction Pathway Models Model Methods and Assumptions Thresholds for MoT establishment and wheat blast outbreak in its native habitats in Brazil Threshold for MoT overwintering survival based on extrapolations from an MoT close relative currently established in the U.S Calculating the climate suitability for MoT inoculum build-up, infection during heading and MoT overwintering survival in the coterminous U.S. and the North Carolina Corridor Results Discussion References Chapter 3 - Preliminary Assessment of Resistance Among U.S. Wheat Cultivars to the Triticum Pathotype of Magnaporthe oryzae Abstract Introduction Materials and Methods vi
7 Data analysis Results Discussion References Appendix A - General Pathway Model Assumptions Appendix B - U.S. Model P BR-US Appendix C - North Carolina Model P BR-NC Appendix D - Wheat blast outbreak vs non-outbreak year maps Appendix E - Climate suitability risk for wheat blast outbreak in Paraná and Rio Grande do Sul Appendix F - Climate suitability risk maps for MoT establishment for the three major tiers that included the lower 48 U.S. states Appendix G - Glossary vii
8 List of Figures Figure 1-1. The most visible symptom of whet blast in the field is head infection. Bleaching of wheat heads usually progresses upward from the point of infection; infection in the rachis prevents grain production in highly susceptible cultivars Figure 2-1. Differences in the daily maximum and minimum temperature profiles for Londrina (Paraná state) and Lagoa Vermelha (Rio Grande do Sul state) during 2001, 2004, and 2009 (wheat blast epidemic years in Brazil). Data obtained from the NCEP CFSR database Figure 2-2. An MoT risk corridor in North Carolina was identified based on the most likely truck routes for transportation of imported wheat grain from the port of Wilmington to feed mills Figure 2-3. Winter wheat fields in 10 selected counties in North Carolina that encompass the MoT risk corridor Figure 2-4. Spatial display of accumulated infection days based on 10-years of CFSR climate data for Paraná and Rio Grande do Sul Figure 2-5. Based on the survival of the closely related MoL pathotype, it was assumed that MoT survival in the U.S. would be limited by frost occurrence (>105 frost days to simulate the MoL pathotype). The map in this figure displays the area where low temperatures are predicted to preclude the overwinter survival of MoT (red area) and the zone where the overwinter survival of MoT will not likely be limited (white area). A transition zone exists where low temperatures may or may not limit the overwinter survival of MoT. Map based on 10-year climate from NAPPFAST North American station dataset Figure 2-6. Climate suitability risk maps showing the probability of MoT establishment (A) and the probability of a wheat blast outbreak (B) in the coterminous U.S. based on ten years of NCEP-CFSR climate data Figure 2-7. Climate suitability risk map showing the probability of MoT establishment (A) and a wheat blast outbreak (B) in the North Carolina corridor Figure 2-8. Cumulative distribution function for the total kernels infected/infested with Magnaporthe oryzae (Triticum pathotype) (MoT) exported from Paraná and Rio Grande do Sul, states in Brazil, to the U.S viii
9 Figure 2-9. Cumulative distribution function for the amount of kernels infected/infested with Magnaporthe oryzae (Triticum pathtype) (MoT) spilled in U.S. winter wheat production areas Figure Cumulative distribution function for the amount of kernels infected/infested with Magnaporthe oryzae (Triticum pathotype) (MoT) spilled in winter wheat production areas within a corridor in North Carolina Figure Proportion of U.S. winter wheat production areas at risk of MoT establishment according to cell counts of p ranking values Figure Proportion of U.S. winter wheat production areas at risk of wheat blast outbreak according to cell counts of p ranking values Figure Proportion of winter wheat production areas in the North Carolina corridor at risk of MoT establishment according to cell counts of p ranking values. Wheat is not produced in two of the ten counties through which the corridor runs and consequently there is an approximately 10% probability of a zero risk of MoT establishment Figure Proportion of winter wheat production areas in the North Carolina corridor at risk of wheat blast outbreak according to cell counts of p ranking values Figure Discrete probability distribution and cumulative distribution function for years until first establishment of Magnaporthe oryzae (Triticum pathotype) (MoT) in the U.S Figure Discrete probability distribution and cumulative distribution function for years until establishment of Magnaporthe oryzae (Triticum pathotype) (MoT) in a corridor in North Carolina Figure Sensitivity analysis for the likelihood of at least one establishment of Magnaporthe oryzae (Triticum pathotype) (MoT) in the U.S. The Spearman correlation coefficient value for each parameter is shown on each bar Figure Sensitivity analysis for the likelihood of at least one establishment of Magnaporthe oryzae (Triticum pathotype) (MoT) in North Carolina. The Spearman correlation coefficient value for each parameter is shown on each bar Figure A logistic distribution of hypothetical thresholds for the probability of Magnaporthe oryzae (Triticum pathotype) (MoT) establishment. Threshold values need to be determined for the number of infected/infested kernels necessary for MoT establishment at a probability greater than zero (x), a probability of 0.5 (y), the inflection point, and a probability of 1.0 ix
10 (z), the maximum. It is not known where on this curve the 31.3 billion imported kernels infected/infested with MoT would lie Figure 3-1. Wheat blast severity values (percent affected spikelets) for 12 artificially infected cultivars from two independent experiments. Pearson's correlation between experiments was r=0.96, N=12, p< Figure 3-2. Linear regression analysis between percent tissue affected by blast on wheat seedling leaves versus wheat heads. Relationship between leaf severity (LS) and head severity (HS) was: HS= *LS, N=12, R2=0.57, P= Figure 3-3. Reaction of six selected wheat cultivars to four isolates (T-7, T-12, T-22, and T-25) of the Triticum pathotype of Magnaporthe oryzae. Values within an isolate, when followed by a common letter, are not significantly different (P=0.05) x
11 List of Tables Table 2-1. Stages and parameters of the general pathway to estimate the annual rate of the Triticum pathotype of Magnaporthe oryzae entry and establishment from Brazil into the U.S Table 2-2. Models used in this study Table 2-3. The coterminous 48 U.S. states were grouped into tiers based upon usual wheat active growth after winter dormancy and approximate heading dates to account for the geographic variation in dates of susceptibility to head infection Table 2-4. For each tier critical dates were identified for the periods of wheat active growth after winter dormancy and heading (USDA, 2010; USDA NASS, 2013). This information was used to inform model parameters of inoculum build-up and infection at heading. The North Carolina corridor was modeled using information from tier Table 2-5. Cell counts for each predicted probability class for MoT establishment in the coterminous U.S. and the North Carolina corridor Table 2-6. Cell counts for each predicted probability class for wheat blast outbreak in the coterminous U.S. and the North Carolina corridor Table 2-7. Selected risk output results from models P BR-US and P BR-NC Table 3-1. Disease severity and resistance rating to wheat blast for 85 U.S. hard winter wheat cultivars. Plants were inoculated, held in a controlled environment chamber, and assessed after 14 days. a Percent spikelets affected by blast xi
12 Acknowledgements Working with the wheat blast research group was a unique and rewarding experience. It was a luxury to have the direction, assistance, and guidance of many wonderful and remarkable scientists in producing this work. I owe special thanks to my co-major advisors Dr. Jim Stack and Dr. Bill Bockus for being great mentors and critics in the best of senses. I would like to thank them for being always open to discuss new ideas and projects, and for their invaluable guidance. I would also like to express my most sincere gratitude to Dr. Barbara Valent and Dr. Roger Magarey for their constant support and direction during my Ph.D. program. I thank Dr. Glenn Fowler and B.S. David Christie at USDA-APHIS-PPQ-CPHST- PERAL for the important inputs in the development of portions of this work. Special thanks to Ing. Diego Baldelomar, and Lic. Jaime Hernandez from the Bolivian Association of Oilseed and Wheat Producers (ANAPO) for the wonderful collaborations. I also wish to thank Dr. Gary Peterson (USDA-ARS), Dr. Mauricio Fernandes (EMBRAPA-Brazil), M.Sc. Guillermo Barea (COPERAGRO-Bolivia), Dr. Mohan Kohli (CAPECO-Paraguay), Dr. Carl Reed and Dr. Jay O'Neil (IGP-KSU), for their technical support and assistance during my studies. I am thankful to the USDA National Institute for Food and Agriculture for financial support during my doctorate program. Surviving this experience would have been impossible withouth a special combination of moral support from my family and friends. Thank you all for your continous support during my whole career. Special thanks to Maria Vittoria, Freddy, Carmen, Andres, Marcela, and Ivan Cruz. xii
13 Dedication To those who teach others to believe in themselves. xiii
14 Chapter 1 - Wheat Blast Literature Review Magnaporthe oryzae (Couch and Kohn, 2002) (anamorph, Pyricularia oryzae) is a fungal pathogen with a high degree of host specificity (Couch et al., 2005). It is the causal agent of blast disease on graminaceous plants, including wheat (Triticum aestivum L.), rice (Oryza sativa L.), and barley (Hordeum vulgare L.) (Valent and Chumley, 1991; Igarashi et al., 1986; Lima and Minella, 2003). M. oryzae is a filamentous, heterothallic ascomycete that has potential for sexual and asexual reproduction; however, there is evidence that sexual fertility has been lost in some populations (Valent et al., 1986; Zeigler, 1998). The genus Pyricularia was first described by Saccardo (1880) and later illustrated by other authors (Barret and Hunter, 1998; Henry and Andresen, 1948). Originally from a leaf of the grass Setaria, it was characterized as a fungus with long, slender, mostly simple conidiophores; 2- to 3-celled, obpyriform to nearly ellipsoid hyaline conidia attached at the broader end (Barnett and Hunter, 1998). Conidia are approximately 8-9 x m (Henry and Andersen, 1948). Several names have been applied to the blast fungus, both for the teleomorph and anamorph stages (Agrios, 2005; Couch and Kohn, 2002). The teleomorph stage was previously known as Magnaporthe grisea (Agrios, 2005; Rossman et al., 1990), and two species names were applied to the anamorph stage: Pyricularia oryzae and P. grisea (Agrios, 2005; Couch and Kohn, 2002; Rossman, 1990). Sprague (1950) applied the names based on the host from which the fungus was isolated (P. oryzae to isolates from rice, and P. grisea to isolates from cereals and other grasses). Agrios (2005) and Rossman et al. (1990) synonymized P. oryzae and P. grisea. However, Couch and Kohn (2002), using a multilocus phylogenetic analysis, described M. oryzae as a new species distinct from M. grisea, and proposed M. oryzae as the correct name for isolates from rice, perennial ryegrass, wheat, millets, and other grasses of agricultural importance. In addition, M. grisea isolates are pathogenic on Digitaria sanguinalis (L.) Scop (crabgrass) and other related grasses. Collectively, M. oryzae and M. grisea species are members of the Magnaporthe grisea species complex (Couch et al., 2005). The blast disease was reported for the first time on wheat in 1986 in northern Paraná, state of Brazil, where it had caused severe damage to the local wheat plantings (Igarashi et al., 1986). Igarashi et al. (1986) suggested that the fungus that they had described might have been the cause of both wheat and rice blast. However, this hypothesis was later refuted in reports 1
15 showing that the wheat and rice blast pathogens were different (Orbach et al., 1996; Urashima et al., 1999; Urashima et al., 1993; Prabhu et al., 1992). Today, it is widely accepted that close relatives of the wheat blast fungus, especially newly emerged isolates from perennial ryegrass (Lolium perenne) causing gray leaf spot, represent a growing agricultural threat (Khang and Valent, 2010) because they are closely related to each other (Viji et al., 2001; Farman, 2002; Tosa et al., 2004). In the U.S. gray leaf spot was reported for the first time in 1971 on forage annual ryegrass (Lolium multiflorum Lam.) in the states of Mississippi and Louisiana (Bain et al., 1972; Carver et al., 1972). In 1991 it was reported as a serious problem on perennial ryegrass (Lolium perenne) in the state of Pennsylvania (Landschoot and Hoyland, 1992). Since then, the geographic range of gray leaf spot has expanded to Indiana, (Latin and Harmon, 2004), Illinois (Pedersen et al., 2000), Kentucky (Williams et al., 2001), Ohio, West Virginia, Virginia, Tennessee, and North Carolina (Harmon and Latin, 2003), Connecticut, Rhode Island (Schumann and Jackson, 1999), California, Nevada, and Utah (Wong, 2006). It occurs infrequently in Iowa, Nebraska, and Kansas, and has not been confirmed in northern Midwestern states such as Michigan, Wisconsin, and Minnesota (Latin and Harmon, 2004). In 2011 M. oryzae was found on a single head in research plot in Princeton, Kentucky (Pratt, 2012). The pathogen was isolated and by comparative analysis of sequenced whole genomes it was concluded that this strain was more similar to native strains isolated from U.S. Lolium than to Triticum isolates from South America (Farman, Pedley, and Valent, unpublished). M. oryzae has also been previously reported in wheat interplanted with ryegrass in Louisiana where no serious losses were reported (Rush and Carver, 1973). The origin of both the wheat blast and perennial ryegrass pathogens is still unknown. However, it has been suggested that host shifts may account for their recent emergence in Brazil, the U.S. and Japan (Khang and Valent, 2010). Wheat blast is today considered a major disease affecting wheat production in Brazil (Urashima et al., 2009). The economic importance of this disease derives from the fact that the fungus can reduce yield and the quality of the wheat grain (Goulart, 2005). Infected grains from highly susceptible cultivars are usually small, wrinkled, deformed, and have low-test weight (Goulart, 2005). The highest yield losses occur when infections start during flowering or grain formation (Goulart, 2005). Reported yield losses in Brazil on susceptible cultivars vary from 10.5 up to 100% (Goulart et al., 1992; Goulart and Paiva, 2000). 2
16 Since its first report in Paraná, the disease has spread to the most important wheatproducing regions of Brazil (Dos Anjos et al., 1996; Goulart et al., 1990; Igarashi, 1990; Picinini and Fernandes, 1990; Goulart and Paiva, 2000), as well as to Bolivia (Barea and Toledo, 1996) and Paraguay (Viedma, 2005). In 2007 it was reported for the first time in northeastern Argentina (Cabrera and Gutierrez, 2007). The most visible symptom in the field is head infection (Figure 1-1); however, all above (Igarashi, 1990) ground plant parts can be affected. On heads, infection can occur on the glumes, awns, and rachis (Igarashi, 1990). Infected glumes present elliptical lesions with reddish-brown to dark-gray margins and white to light-brown centers (Igarashi, 1990). Infected awns show brown to whitish discoloration while infected rachises, depending on the point of infection, can present partial loss or complete death of the head (Igarashi, 1990). In general, symptoms on heads can vary from elliptic lesions with bleached centers to partial or total spike bleaching, sterility, and empty grains depending on the time of infection (Igarashi et al., 1986; Igarashi, 1990). An infection in the rachis can block the translocation of photosynthates to upper parts of the spike, and therefore cause partial or total spike sterility. Grain fill is better when blast infections are later in the season; however, later infections may increase the chance of seed transmission of the pathogen with infected seeds (Igarashi, 1990). On leaves, lesions vary in shape and size depending on the age of the plants; as plants grow older, lesions are less frequent (Igarashi, 1990). Lesions with a white center and a reddish-brown margin on the upper side, and dark grey on the underside of the leaf can be observed on both young and old infected leaves (Igarashi, 1990). Infection on seedlings can be severe under high temperature and humidity, and can result in total plant death (Igarashi, 1990; Cruz et al, unpublished). MoT sporulation has been observed on seedling roots under laboratory conditions (Cruz et al, unpublished). Wheat blast, among other diseases, has limited the Brazilian wheat production during recent years (Goulart, 2005). Based upon weather conditions, cultivar, and organ infected on the plant, blast in Brazil can vary greatly in severity from region to region and year to year (Urashima et al., 2009; Goulart, 2005). A combination of high temperatures, excessive rain, long and frequent leaf wetness, and poor fungicide efficacy has favored the presence of this disease during outbreak years (Goulart, 2005). It has been reported that optimum conditions of temperature range between 25 to 30 C and spike wetness between 25 to 40 hours (Cardoso et al, 2008). These two factors alone can favor the incidence and severity of wheat blast (Cardoso et al, 3
.")
17 2008). Two fungicide active ingredients have been recommended for the control of wheat blast, tebuconazole and metconazole. Consensus opinion is that fungicides are not effective in controlling wheat head blast if warm, rainy weather occurs during the heading stage (Goulart, 2005, Urashima et al., 2009). However, it is unknown if poor control is due to improper timing or incomplete application, or poor active ingredient activity. Figure 1-1. The most visible symptom of whet blast in the field is head infection. Bleaching of wheat heads usually progresses upward from the point of infection; infection in the rachis prevents grain production in highly susceptible cultivars. Finding sources of genetic resistance has been intense since its first appearance in Brazil (Arruda et al., 2005; Goulart and Paiva, 1992; Igarashi, 1990; Urashima and Kato, 1994; 4
18 Urashima et al., 2004). However, no source of durable or race non-specific resistance has yet been found (Urashima et al., 2004). Urashima et al. (Urashima et al., 2004) tested 20 commercial wheat cultivars for resistance to 72 isolates of the Triticum pathotype of M. oryzae. Although BR18 had the best performance, no promising resistant cultivar was identified in their study. Prestes et al. (2007) evaluated 100 Brazilian wheat genotypes for resistance to head blast. Eighteen genotypes among commercial cultivars and advanced breeding lines showed moderate resistance; however, no genotype with complete resistance was reported. Cruz et al. (2010) tested 50 Brazilian commercial cultivars and 20 synthetic wheat genotypes from crosses between Triticum durum and Aegilops tauschii for resistance to 18 isolates of the Triticum pathotype of M. oryzae. In general, synthetic wheat genotypes showed less area affected at the adult plant stage and were considered promising sources of resistance to wheat blast. Plant Biosecurity The protection of natural and controlled plant ecosystems through strategies aimed to assess and manage the risk associated with biological threats is known as plant biosecurity (Meyerson and Reaser, 2002). A potential wheat disease outbreak in a major world supplier region, for example the Great Plains Region of North America, can have a serious impact with global magnitude. Today, several challenges exist for the achievement of crop biosecurity at the local, regional, and global scales (Gamliel et al, 2008; Stack, 2008). The introduction of exotic pathogens by means of global trade (National Research Council, 2002; Stack, 2008), and the effect of pathogen evolution (Couch et al, 2005) are just two examples of these challenges. Wheat is internationally the most traded food crop (Ortiz el at., 2008) and the U.S. is a major wheat-producing country. Even though the U.S. produced only about nine percent of world wheat during 2009, today it is the biggest wheat exporter with nineteen percent of the world s total exports (Vocke, 2009). Wheat blast represents not only a threat to the $5 billion U.S.-wheat-export industry (Brooks and Jerardo, 2009) but also to the world wheat market. Serious international market damage (i.e. increases in price due to changes in supply) would result from any occurrence of this exotic disease within any U.S. wheat producing region as a consequence of quarantine/embargo measures that can be imposed at the international level. For 5
19 these reasons, it is important to discuss the associated factors that can increase the probability of wheat blast occurrence in the U.S. Historical data suggest that the introduction of plant pathogens by natural means is uncommon; instead, human activities are the main factors for almost all of them (National Research Council, 2002). Pathogenic microorganisms and pests are in most cases introduced as contaminants of plants and plant products traded internationally between biogeographical zones (Brasier, 2008; National Research Council, 2002). Today, this is the primary mode of introduction of exotic pathogens and pests into new areas (Brasier, 2008). Liberalization of agricultural trade increases the chance of introduction of some of the hundreds of thousands species of plant pathogens and pests not yet found in the U.S. (National Research Council, 2002). Plant pathogens have the ability to remain in a latent stage until conditions are favorable for their growth and multiplication, an ability that can help these pathogens to increase the chance of surviving transport (National Research Council, 2002). Although currently confined to South America, blast is a potential threat to wheat production globally. MoT is a seed-borne pathogen (Goulart and Paiva, 1990; Goulart and Paiva, 1991; Goulart and Paiva, 1993; Cruz et al., unpublished) and consequently contaminated seed can be the vehicle of its introduction to non-endemic countries. The presence of pathogens in commodities represents a risk associated with the enormous volumes of plants and plant products traded internationally. Despite the fact that there are technical regulations imposed on imports at the national and international level aimed to reduce the spread of diseases and pests through international trade (Brasier, 2008; Reed, 2001), there are still issues delaying their implementation. For instance, in the U.S. less than 2% of incoming containers are inspected at ports of entry (National Research Council, 2002), and inspections are usually based on simple visual detections of disease symptoms caused by listed organisms (Brasier, 2008). Inspections of plant material for the presence of fungi by visual detection alone can be inadequate because they can be present in the form of largely invisible spores or mycelia (Brasier, 2008). Likewise, the principles underlying the protocols given by the International Plant Protection Convention (IPPC) and the World Trade Organization (WTO), have been considered outdated and seriously flawed (Brasier, 2008). These protocol efforts generally come into effect only after a problem is identified, and they also tend to assume that target hosts for a pathogen are always hosts taxonomically related to that affected in its center of origin (Brasier, 2008). 6
20 Plant biosecurity is a state of preparedness (Stack and Fletcher, 2007) that includes an array of strategies used to assess and manage the risk of biological threats (Meyerson and Reaser, 2002). Undoubtedly, several components with unique strategies can help minimize the impact of a plant disease outbreak (Stack and Fletcher, 2007). The development of plant biosecurity infrastructure is based on a conceptual approach obtained from a simple disease outbreak model that illustrates this array of strategies (Stack and Fletcher, 2007). In this model, the prevention strategy helps to reduce a potential pathogen introduction (Stack and Fletcher, 2007). Pest risk assessment is part of a decision-support tool known as pest risk analysis (PRA). A PRA is a technical analysis based on biological and economic information that provides the justification for administrative and legislative decisions used in the development of strategies for prevention (Petter et al., 2010). This analysis consists of three stages: initiation, risk assessment, and risk management (International Plant Protection Convention, 2004). The initiation of a PRA may be the result of the identification of a pest to be considered for risk analysis (e.g., risk identified by scientific research), the identification of a pathway associated with the introduction of a pest to an identified PRA area, or a required review or revision of a trade policy (International Plant Protection Convention, 2004). This stage starts with a rapid categorization of the organism considered for risk analysis, to determine if it meets the criteria for being considered a quarantine pest (Petter et al., 2010). A quarantine pest is an organism of potential economic importance to an endangered area, which may be present and not widely distributed, or not yet present there (International Plant Protection Convention, 2008). The organism is categorized based on its identity, presence or absence in the PRA area, regulatory status, and potential for establishment and economic consequences in the PRA area (International Plant Protection Convention, 2004). Pest risk assessment includes the probability of introduction, establishment, and spread of a pest (International Plant Protection Convention, 2004). Pest risk management is a process that identifies and evaluates the efficacy of available measures in order to determine the most appropriate option that could be used to prevent the entry, establishment, or spread of a pest (International Plant Protection Convention, 2004; Petter et al., 2010). These measures can be implemented in the exporting country or at origin, at the point of entry, or within the importing country (Petter et al., 2010). Based on the fact that imported agricultural products can harbor non-indigenous pests that could threat domestic agricultural industries, sanitary and phytosanitary measures can be 7
21 applied to the international movement of agricultural commodities (Reed, 2001). These measures need to be based on international standards and scientific principles (Griffin, 2012; Reed, 2001). Current analyses have to be constructed under the SPS-IPPC framework and be based on PRA (Griffin, 2012). PRA is mainly a scientific decision-support tool used to justify phytosanitary measures, but it also has other applications (Devorshak, 2012). It can also be used in surveillance programs to determine the potential of a new pest to enter and get established into a country. A PRA can be applied to consider pathways or means by which a pest can gain entry and spread from one location to another (Devorshak, 2012). Commodities are considered the most common type of pathway analyzed but other types of pathways, such as natural spread, can also be studied (Devorshak, 2012). A pathway pest risk analysis considers important events to represent transmission points that must occur for a pest to gain entry, become established, and spread in a new location. Events prior to commodity export may include pest prevalence and disease outbreaks at place of origin, infestation at the field level, and amount of commodity for export. Among the events for consideration after commodity arrival, one may include commodity loss and spillage during transshipment and transit, presence of suitable hosts, climatic conditions for pest overwintering survival, establishment, spread, and outbreak. Specific times or events in a pathway that could lead to pest arrival, establishment and spread are analyzed by certain pathway pest risk analyses (Devorshak, 2012). In some instances, only the likelihood of entry and establishment is analyzed. Direct climate pattern matching approach has previously been used in risk analyses to predict pest establishment after entry (Lanoiselet et al., 2002). Because of the complexity and the many factors associated with establishment, studies have traditionally assumed that each entry of inoculum in a location results in successful establishment (Rafoss, 2003; Devorshak, 2012). To simulate a pathway, probabilistic models based on probability distributions or point estimates are often used (Fowler and Takeuchi, 2012). The Triticum pathotype of M. oryzae (MoT) is an emerging pathogen that has not yet been reported outside of South America and its spread poses a threat to wheat producing nations globally. Since wheat is extremely important in the U.S. it was necessary to estimate the risk for MoT entry into and establishment in the U.S., and to assess the vulnerability of some U.S. winter wheat elite cultivars to this pathogen. 8
22 References Agrios, G Plant Pathology. Fifth Edition. Elsevier Academic Press. Burlington, MA. Arruda, M., Cassiara, R., Zamprogno, K., Lavorenti, N., Urashima, A Reação do Trigo à Magnaporthe grisea nos Diferentes Estádios de Desenvolvimento. Fitopatol. bras. 30: Bain, D., Patel, B., and Patel, M. (1972). Blast of ryegrass in Mississippi. Plant Disease Reporter 56, 210. Barea, G., Toledo, J Identificación y zonificación de Pyricularia o brusone (Pyricularia oryzae) en el cutivo de trigo en el departamento de Santa Cruz. Centro de Investigación Agrícola Tropical. Santa Cruz de la Sierra, Bolivia Barnet, H., and Hunter, B Illustrated genera of imperfect fungi. Fourth edition. American Phytopathological Society, St. Paul, MN. Braiser, C The biosecurity threat to the UK and global environment from international trade in plants. Plant Pathology 57: Brooks, N., and Jerardo, A U.S. agricultural exports year-to-date and current months. Online. Available at [Accessed on January, 2009] Cabrera, M., and Gutiérrez, S Primer registro de Pyricularia grisea en cultivos de trigo del NE de Argentina. Depto. Protección Vegetal, Facultad de Ciencias Agrarias, UNNE. Available online at: agr.unne.edu.ar/ Extension/Res2007/SanVegetal/SanVegetal_06.pdf Cardoso, C., Reis, E., and Moreira, E Desenvolvimento de sistema de previsão de brusome causada por Pyricularia grisea. Summa Phytopathologica, 34: Carver, R., Rush, M., and Lindberg, D. (1972). An epiphytotic of ryegrass blast in Louisiana. Plant Disease Reporter 56, Couch, B., Kohn, L A multilocus gene genealogy concordant with host preference indicates segregation of a new species, Magnaporthe oryzae, from M. grisea. Mycologia. 94: Couch, B., Fudal, I., Lebrun, M., Tharreau, D., Valent, B., Van Kim, P., Nottéghem, J., and Kohn, L Origins of host-specific populations of the blast pathogen Magnaporthe oryzae in crop domestication with subsequent expansion of pandemic clones on rice and weeds of rice. Genetics 170: Cruz, M., Prestes, A., Maciel, J., and Scheeren, P Resistencia parcial à brusone de genótipos de trigo comum e sintético nos estádios de planta jovem e de planta adulta. Trop. Plant Pathol. 35:1:
23 Devorshak, C Uncertainty in Pest Risk Analysis. In: Plant Pest Risk Analysis: Concepts and Applications. Ed.: Devorshak, C. CAB International, Oxford, UK Dos Anjos, J., Da Silva, D., Charchar, M., Rodrigues, G Ocorrência de brusone (Pyricularia grisea) em trigo e centeio na região dos cerrados do Brasil Central. Pesquisa Agropecuaria Brasileira. 31: Farman, M Pyricularia grisea isolates causing gray leaf spot on perennial ryegrass (Lolium perenne) in the United States: relationship to P. grisea isolates from other host plants. Phytopathology 92: Fowler, G., and Takeuchi, Y Mapping, Climate and Geographic Information for Risk Analysis. In: Plant Pest Risk Analysis: Concepts and Applications. Ed.: Devorshak, C. CAB International, Oxford, UK Gamliel, A., Gullino, M., and Stack, J Crop Biosecurity: global, national, regional, and global perspectives. Pages In: Crop Biosecurity: assuring our global food supply. Eds: Gullino M.L., Fletcher J., Gamliel A., Stack P.J. Springer, The Netherlands. 148 pp Goulart, A Perdas em trigo causadas pela brusone. Pages in: Workshop de Epidemiologia de Doenças de Plantas. Viçosa, M. Quantificação de perdas no manejo de doenças de plantas: anais. Viçosa, M: Universidade Federal de Viçosa, 2004b. Goulart, A., and Paiva, F Transmissão de Pyricularia oryzae através de sementes de trigo (Triticum aestivum L.). Fitopatol. bras. 15: Goulart, A., Paiva, F., Mesquita, A Ocorrência da brusone (Pyricularia oryzae) do trigo (Triticum aestivum) em Matto Grosso do Sul. Fitopatologia Brasileira. 15: Goulart, A. and Paiva, F Controle da Pyricularia oryzae e Helminthosporium sativum pelo tratamento de sementes de trigo com fungicidas. Pesquisa Agropecuária Brasileira 26: Goulart, A., Paiva, F Incidência da brusone (Pyricularia oryzae) em diferentes cultivares de trigo (Triticum aestivum) em condições de campo. Fitopatologia Brasileira 17: Goulart, A., and Paiva, F Sobrevivência de Pyricularia Oryzae Cav. em sementes de trigo (Triticum Aestivum L.) armazenadas em diferentes ambientes. Revista Brasileira de Sementes 15: Goulart, A., Paiva, F Perdas no rendimiento de grãos de trigo causada por Pyricularia grisea, nos anos de 1991 e 1992, no Mato Grosso do Sul. Summa Phytopathologica 26: Goulart, A., Paiva, F., Mesquita, N Perdas en trigo (Triticum aestivum) causadas por Pyricularia oryzae. Fitopatologia Brasileira 17:
24 Goulart, A. Perdas em trigo causadas pela brusone. In: Workshop de Epidemiologia de Doenças de Plantas Viçosa, M. Quantificação de perdas no manejo de doenças de plantas: anais. Viçosa, M: Universidade Federal de Viçosa, 2004b p Goulart, A., Paiva, F Perdas no rendimiento de grãos de trigo causada por Pyricularia grisea, nos anos de 1991 e 1992, no Mato Grosso do Sul. Summa Phytopathologica 26: Griffin, R Uncertainty in Pest Risk Analysis. In: Plant Pest Risk Analysis: Concepts and Applications. Ed.: Devorshak, C. CAB International, Oxford, UK Harmon, P., and Latin, R. (2003). Gray leaf spot of perennial ryegrass. In Plant Health Progress. Henry, B., Andersen, A Sporulation by Piricularia oryzae. Phytopathology. 38: Igarashi S., Utimada C., Igarashi L., Kazuma A., Lopes, R Pyricularia sp. em trigo. I. Ocorrência de Pyricularia sp. no Estado do Paranà. Fitopatologia Brasileira 11: Igarashi, S Update on wheat blast (Pyricularia oryzae) in Brazil. Pages In: Proceedings of the International Conference-Wheat for the nontraditional warm areas. Saunders, D. ed. Mexico, D.F. International Plant Protection Convention ISPM No. 11: Pest risk analysis for quarantine pests including analysis of environmental risks and living modified organisms. International standards for phytosanitary measures. Online. Available at [Accessed on March, 2010]. International Plant Protection Convention ISPM No. 5: Glossary of phytosanitary terms. International standards for phytosanitary measures. Online. Available at [Accessed on March, 2010]. Khang, C., and Valent, B Magnaporthe oryzae and rice blast disease. In: Cellular and Molecular Biology of Filamentoys Fungi. Eds. Borkovich, A., and Ebbole, D. ASM Press, Washington D.C. Landschoot, P.J., and Hoyland, B.F. (1992). Gray Leaf-Spot of perennial ryegrass turf in Pennsylvania. Plant Disease 76, Lanoiselet, E., Cother, E., and Ash, G CLIMEX and DYMEX simulations of the potential occurrence of rice blast disease in south-eastern Australia. Australasian Plant Pathology 31:1-7. Latin, R., and Harmon, P. (2004). Managing gray leaf spot in the Midwest. Golf Course Management 72, Lima, M., and Minella, E Ocurrence of Head Blast in Barley. Embrapa Trigo, Cx. Postal 451, CEP , Passo Fundo, RS. 11
25 Meyerson, L., and Reaser, J A unified definition of biosecurity. Science 295:44. National Research Council Predicting invasions of nonindigenous plants and plant pests. National Academy Press. Washington, D.C. Orbach, J., Chumley, F., and Valent B Eletrophoretic karyotypes of Magnaporthe grisea pathogens of diverse grasses. Molecular Plant-Microbe Interactions. 4: Ortiz, R., Braun, H., Crossa, J., Crouch, J., Davenport, G., Dixon, J., Dreisigacker, S., Duveiller, E., He, Z., Mezzalama, M., morgounov, A., Murakami, J., Nicol, J., Ortiz, G., Ortiz- Monasterio, J., Payne, T., Peña, R., Reynolds, M., Sayre, K., Sharma, R., Singh, R., Wang, J., Warburton, M., Wu, H., Iwanaga, M Wheat genetic resources enhancement byt the International Maize and Wheat Improvement Center (CIMMYT). Genet Resour Crop Evol. 55: Petter, F., Brunel, S., and Suffert, M Pest risk analysis as applied to plant pathogens. Pages In The role of Plant Pathology in Food Safety and Food Security, Plant Pathology in 21 st Century. Springer. The Netherlands Pedersen, D.K., Kane, R.T., and Wilkinson, H.T. (2000). First report of gray leaf spot caused by Pyricularia grisea on Lolium perenne in Illinois. Plant Disease 84, Piccinini, E., and Fernandes, J Ocorrência da brusone (Pyricularia oryzae) em lavouras comerciais de trigo (Triticum aestuvum) no Estado do Rio Grande do Sul. Fitopatologia Brasileira. 15: Prabhu, A., Filippi, M., and Castro, N Pathogenic variation among isolates of Pyricularia oryzae infecting rice, wheat and grasses in Brazil. Trop. Pest Manage. 38: Pratt, K UK researchers find important new disease. Online available at Rafoss, T Spatial Stochastic Simulation Offers Potential as a Quantitative Method for Pest Risk Analysis. Risk Analysis 23:4: Reed, M Technical Barriers to Trade. Pages In International Trade in Agricultural Products. Prentice Hall. Upper Saddle River, New Jersey. Rossman, A., Howard, R., and Valent, B Pyricularia grisea, the correct name for the rice blast disease fungus. Mycologia, 82: Rush, M., and Carver, R Ryegrass blast: a serious new disease in Louisiana. Louisiana Agriculture 16:15. Saccardo, P Fungorum extra-europaeorum Pugillus. Michelia 2: Schumann, G.L., and Jackson, N. (1999). First report of gray leaf spot (Pyricularia grisea) on perennial ryegrass (Lolium perenne) in New England. Plant Disease 83,
26 Sprague, R Diseases of Cereals and Grasses in North America. Ronald Press, New York. Stack, J Challenges to crop biosecurity. Page In: Crop Biosecurity: assuring our global food supply. Eds: Gullino M.L., Fletcher J., Gamliel A., Stack P.J. Springer, The Netherlands. 148 pp Stack, J., and Fletcher, J Plant biosecurity infrastructure for disease surveillance and diagnostics. Page In: Institute of Medicine Global infectious disease surveillance and detection: Assessing the challenges finding solutions. Workshop summary. The National Academic Press, Washington DC. Tosa, Y., Hirata, K., Tamba, H., Nakagawa, S., Chuma, I., Isobe, C., Osue, J., Urashima, A., Don, L., Kusaba, M., Nakayashiki, H., Tanaka, A., Tani, T., Mori, N., and Mayama, S Genetic constitution and pathogenicity of Lolium isolates of Magnaporthe oryzae in comparison with host species-specific pathotypes of the blast fungus. Phytopathology 94: Urashima, A., Hashimoto, Y., Don, L., Kusaba, M., Tosa, Y., Nakayashiki, H., and Mayama, S Molecular analysis of the wheat blast population in Brazil with a homolog of retrotransposon MGR583. Ann. Phytopathol. Soc. Jpn. 65: Urashima, A., Kato, H Varietal Resistance and Chemical Control of Wheat Blast Fungus. Summa Phytopathologica. 20: Urashima, A., Igarashi, S., and Kato H Host range, mating type, and fertility of Pyricularia grisea from wheat in Brazil. Plant Dis. 77: Urashima, A., Grosso, C., Stabili, A., Freitas, E., Silva, D., Netto, D., Franco, I., and Merola Bottan, J Effect of Magnaporthe grisea on seed germination, yield and quality of wheat. Page 267 In: Advances in Genetic, Genomics and Control of Rice Blast Disease. Wang G., and Valent B. eds. Springer, Netherlands. Urashima, A., Lavorenti, N., Goulart, A., Mehta, Y Resistance Spectra of Wheat Cultivars and Virulence Diversity of Magnaporthe grisea Isolates in Brazil. Fitopatol. bras. 29: Valent, B., Crawford M., Weaver G., and Chumley, F Genetic studies of fertility and pathogenicity in Magnaporthe grisea (Pyricularia oryzae). Iowa State Journal of Research. 60: Valent, B., and Chumley, F Molecular genetic-analysis of the rice blast fungus, Magnaporthe grisea. Ann. Rev. Of Phytopathol. 29: Viedma, L Wheat blast occurrence in Paraguay. Phytopathology 95:S152. Viji, G., Wu, B., Kang, S., and Uddin, W Pyricularia grisea causing gray leaf spot of perennial ryegrass turf: population structure and host specificity. Plant Dis. 85:
27 Vocke, G World and U.S. wheat production, exports and ending stocks. Online Available at [Accessed on December 2009]. Williams, D.W., Burrus, P.B., and Vincelli, P. (2001). Severity of gray leaf spot in perennial ryegrass as influenced by mowing height and nitrogen level. Crop Science 41, Wong, F. (2006). Gray leaf spot in the West: A new disease of perennial ryegrass and kikuyugrass has become established in California and Nevada. Golf Course Management 74, Zeigler, R Recombination in Magnaporthe grisea. Ann. Rev. Phytopathol. 36:
28 Chapter 2 - Quantitative pathway analyses to estimate the probability of Magnaporthe oryzae (Triticum pathotype) entry and establishment into the U.S. Abstract Wheat blast, caused by the Triticum pathotype (MoT) of Magnaporthe oryzae (Couch & Kohn), is a serious disease of wheat causing yield failures and significant economic losses during epidemic years in South America. In this study, two pathway models were constructed for estimating the probability of MoT entry and establishment into the U.S. via the importation of wheat grain from Brazil. Establishment refers to the probability of MoT becoming a resident species in the agro-ecosystem studied. The two models are similar in structure and complementary in function, but differ by two parameters and in the levels of spatial resolution. The first pathway model, P BR-US, was constructed to predict MoT entry from Brazil and establishment into any wheat production area in the U.S. That model identified significant risk for MoT establishment in some areas. However, in approximately 60% of the coterminous U.S. winter wheat production areas, the risk of MoT establishment was zero. With the threshold levels used, the models predicted that the climate is adequate for maintaining MoT populations in some areas of the U.S. However, disease outbreak threshold levels were not reached in most of the country. Since entry is prerequisite to establishment, spread, and outbreak, a higher level of resolution for the entry stage was applied in the second pathway model, P BR-NC. This model is based on a ground transportation corridor developed to target areas at risk to MoT entry within southeast North Carolina. Vulnerability of this corridor to MoT establishment was assessed based upon the presence of a susceptible host in a disease-conducive environment. In approximately 55% of the North Carolina corridor, the model predicted that conditions for MoT establishment exist seven out of ten years. The models generated in this study should provide the foundation for more advanced models in the future. The corridor approach that was developed may offer a strategy for establishing a sentinel plot system or for executing a targeted surveillance system to support forward and backward epidemiological analyses. 15
29 Introduction Although the U.S. is one of the largest producers and exporters of wheat globally, imports of wheat into the U.S. have grown over the last few years to a record of 2.6 million tonnes (t) in 2009 (USDA FAS, 2013). The reasons for this growth in imports may include U.S. farmers switching to more profitable crops, large-scale droughts, high domestic prices, government policies, and favorable shipping rates (Anonymous, 2012a; Anonymous, 2012b; Anonymous, 2012c; Thurman et al., 2012; Piggott, 2013). Feed grain imports have been a critical safeguard to the livestock industry in recent years (Piggott, 2013; Thurman et al., 2012). When buyers look for grain, they search for the best balance between grain quality, low price, and cost of delivery. For instance, a U.S. consortium of corporate hog and poultry producers was formed with the purpose of diversifying their sources of feed supply, to take advantage of seasonal factors with South American harvests, and minimize their feed ingredient costs (Promar International, 2003; Thurman et al., 2012). In many cases for buyers on the East Coast, importing grain from South America has been less expensive than shipping feed by rail from the Midwest (Thurman et al., 2012). In addition, the Brazilian Premio para Escoamento do Produto (PEP) program provides a premium for international grain brokers to sell Brazilian grain on the world market at a lower price (SEAPA, 2010; USDA FAS, 2011). International trade of agricultural goods exists because it has a positive effect on economic growth and countries welfare (Koo and Kennedy, 2005; Piggott, 2013). However, increased global trade of agricultural products has increased the risk of introducing exotic invasive species (National Research Council, 2002; Stack, 2008). Historical data suggest that the introduction of plant pathogens by natural means is uncommon; instead, human activities are the main factors for almost all of them (NRC, 2002). Pathogenic microorganisms and pests are in most cases introduced as contaminants of plants and plant products traded internationally between biogeographical zones (Brasier, 2008; NRC, 2002). Today, this is an important mode of introduction of exotic pathogens and pests into new areas (McCullough et al, 2006; Brasier, 2008). The presence of pathogens in commodities constitutes a risk factor associated with the enormous volumes of plants and plant products traded internationally (Brasier, 2008). Rules and regulations to prevent the introduction and spread of pests have been established at the international level. The International Plant Protection Convention (IPPC) and the Sanitary and 16
30 Phytosanitary Agreement (SPS) make provisions for international trade and for plant protection (FAO, 1996; Devorshak, 2012). Despite the fact that these regulations have been in place for several years, there are still technical issues delaying their full implementation (Brasier, 2008). For instance, in the U.S. less than 2% of incoming containers are inspected at ports of entry (NRC, 2002), and inspections usually involve simple visual detections of disease symptoms caused by certain listed organisms (Brasier, 2008; USDA APHIS PPQ, 2012a). Quarantine commodity treatments may be required as a condition of entry based on pest findings by visual detection (USDA APHIS PPQ, 2012b). However, inspections of plant materials for the presence of pathogens by visual detection alone can be inadequate because of asymptomatic colonization (Brasier, 2008) and due to the fact that most pathogens can invade visually inaccessible tissues (Elmer, 2001). The Triticum pathotype (MoT) of Magnaporthe oryzae (Couch & Kohn) is a seed-borne pathogen and contaminated kernels are considered to play an important role in its long distance spread (Goulart and Paiva, 1990). Goulart and Paiva (1990) estimated that the rate of MoT transmission from a non-treated seed lot with 21% incidence could potentially create 400,000 primary inoculum units per hectare. Under laboratory conditions, abundant sporulation can be observed in MoT infected/infested ungerminated kernels (Cruz et al, unpublished). As the seedling emerges, the pathogen can colonize new tissues such as coleoptile, stem, and primary leaves (Menten and Moraes, 1988; Tanaka et al., 1988; Goulart and Paiva, 1990; Cruz et al, unpublished), increasing its inoculum production capacity. Because imported agricultural products can harbor non-indigenous pests that could threaten domestic agricultural industries, sanitary and phytosanitary measures can be applied to the international transport of agricultural commodities (Reed, 2001). Any measures taken must be based on international standards and scientific principles (Griffin, 2012; Reed, 2001). Current analyses have to be constructed under the SPS-IPPC framework and be based on Pest Risk Analysis (PRA) (Griffin, 2012). PRA is a process that evaluates scientific and economic evidence to determine the level of risk a pest may represent and the strength of phytosanitary regulations that may be used against it (IPPC, 2004; IPPC, 2007). PRA is mainly a scientific decision-support tool used to justify phytosanitary measures, but it can also be used in 17
31 surveillance programs and to determine the potential of a new pest to enter and get established into a country (Devorshak, 2012). A PRA can be applied to consider pathways or means by which a pest can gain entry and spread from one location to another (Devorshak, 2012). Commodities are the most common type of pathway analyzed but other types of pathways, such as natural spread, can also be studied (Devorshak, 2012). A pathway pest risk analysis considers important events that represent transmission points that must occur for a pest to gain entry, become established, and spread in a new location. Events prior to commodity export may include pest prevalence and disease outbreaks at the place of origin, infestation at the field level, and amount of commodity for export. Among the events for consideration after commodity arrival are commodity loss and spillage during transshipment and transit, presence of suitable hosts, climatic conditions for pest overwintering survival, establishment, spread, and outbreak. A plant disease outbreak refers to a level of disease sufficient to cause economic loss or an epidemic greater than what would normally be expected in a particular geographical area or season (Adapted from McMichael et al, 2003). However, the emergence of a previously unreported disease in a geographical area may also constitute an outbreak (Adapted from McMichael et al, 2003). Specific times or events in a pathway that could lead to pest arrival, establishment and spread are analyzed by pathway pest risk analyses (Devorshak, 2012). In some instances, only the likelihood of entry, establishment, or spread is analyzed. Direct climate pattern matching approach has previously been used in risk analysis to predict pest establishment after entry (Lanoiselet et al., 2002). Because of the complexity and the many factors associated with establishment, studies have traditionally assumed that each entry of inoculum in a location results in successful establishment (Rafoss, 2003; Devorshak, 2012), as a result of a very conservative regulatory approach. To simulate pathways, models based on probability distributions and point estimates are often used (Fowler and Takeuchi, 2012). To comply with international phytosanitary guidelines, the expression of risk in a PRA must be connected to scientifically based evidence (Griffin, 2012). Uncertainty should always be identified and characterized (Griffin, 2012). High levels of uncertainty are expected to take place over the course of a pathway pest risk analysis. In fact, uncertainty is inherent in any risk analysis process and can occur at any step of the analysis (Griffin, 2012). Insufficient information, large variability, and imprecision are three factors that 18
32 contribute to uncertainty in pest risk analysis (Griffin, 2012). Detailed, specific policies and guidelines are lacking for how to handle uncertainty in risk analysis (Griffin, 2012; NRC, 2009). According to the National Research Council (1994), uncertainties need to be managed in ways that are scientifically defensible, predictable, and responsive to the needs of decision makers (NRC, 1994). Analytic techniques to manage uncertainty in quantitative analysis include Monte Carlo simulation, expert judgment, and default assumptions (Griffin, 2012; NRC, 1994; NRC, 2009). Monte Carlo is a technique used to build a distribution of estimated risk given probability density functions for the model input parameters (NRC, 1994). Monte Carlo outcome values can be used to communicate the level of certainty associated with the estimate of risk (Griffin, 2012). Although controversial among risk experts and epidemiologists (Yang, 2003), expert judgment and default assumptions are commonly used to fill gaps when uncertainties are the result of a lack of information (Griffin, 2012). Even though these values are in most cases subjectively derived, they could be meaningful in a mathematical sense (Griffin, 2012) and can express the magnitude or quantity of real-world problems. Geographic Information Systems (GIS) can be used for the purpose of retrieving, analyzing, and displaying spatially referenced data that can be use in quantitative pest pathway analysis (Chang, 2004; Rafoss, 2003). This system allows generating maps at different spatial and temporal resolution that can help visualize and interpret risk. Among different mapping methods, climate mapping identifies areas where the climatic conditions that support survival and establishment os a pest exist based on the conditions where the pest presently exists. Climate risk maps are developed using biological and/or spatial distribution parameters of known pests (Fowler and Takeuchi, 2012). These maps provide spatially detailed information on biotic (i.e. host) and abiotic (i.e. climatic conditions) information to predict risk (Magarey et al., 2011). Different modeling systems can be used to combine biology and climatology to predict infection and climate suitability (Fowler and Takeuchi, 2012). For phytosanitary risk analysis, two commonly used modeling systems include NAPPFAST and CLIMEX (Borchert et al, 2007; Fowler and Takeuchi, 2012; Magarey et al, 2007; Sutherst et al, 2007). NAPPFAST is a webbased system that links georeferenced climatological weather data with biological templates for modeling (Borchert et al, 2007). The climatological database used by NAPPFAST contains daily weather data since 1978 (Magarey et al, 2011). The biological templates in NAPPFAST include a generic infection model based on a temperature-moisture response function (TMRF) that uses 19
33 cardinal temperatures (T min, T opt, T max ), wetness requirements for infection (W min, W max ), and a moisture requirement for splash dispersal (Borchert et al., 2007; Magarey et al., 2005; Magarey et al., 2007). This generic infection model predicts infection periods by fungal foliar pathogens and is generally used for exotic pathogens with unknown epidemiology (Magarey et al., 2005). The TMRF in NAPPFAST processes daily weather data into infection potential and has a built-in accumulate function that can be used to calculate the total number of times infection occurs (Borchert et al., 2007; Magarey et al., 2007). The NAPPFAST TMRF algorithm is: I= W*f (T) /W min W/W max (Magarey et al., 2005; Magarey and Sutton, 2007), where W=wetness duration hours, f (T) = temperature response function, and W min W max = minimum and maximum wetness duration requirement (Magarey and Sutton, 2007). The temperature response function f (T) is adjusted to the minimum and maximum values of surface wetness duration requirement (Magarey et al., 2007). It estimates the wetness duration required to cause critical disease intensity (i.e. incidence or severity) at a given temperature (Magarey et al., 2005). Since all biological processes respond to temperature, these responses can be summarized in relation to the minimum, optimum, and maximum cardinal temperatures (Yan and Hunt, 1999; Yin et al., 1995). The temperature response function f (T) is based on the Wang and Engel formulation (1998), which is functionally equivalent to the Yin et al. formulation (Yin et al., 1995; Yan and Hunt, 1999; Magarey et al. 2005). This formulation is based on a standard density function of a beta distribution, which provides a unimodal response with fixed end points (Johnson and Leone, 1964; Yan and Hunt, 1999; Yin et al., 1995). The Yin et al (1995) equation combines an exponential response, a positive linear response, a parabola response, and a negative response at low, intermediate, optimum, and high temperatures, respectively (Magarey et al., 2005). W min represents the number of hours required to produce 20% disease incidence or 5% disease severity on inoculated plant parts at a given temperature (Magarey et al., 2005). The built-in accumulate function is often used to generate an output grid that creates colored areas on maps produced by NAPPFAST (Borchert et al., 2007). NAPPFAST can create risk maps at a 10km (100 km 2 ) resolution for North American models and 38km (1444 km 2 ) for global models (Borchert et al, 2007; Magarey et al, 2011). These maps can be later exported to GIS and combined with host distribution maps to create integrated risk maps (Magarey et al, 2011). Final maps can be used to support pathway analysis, commodity risk assessment, pest risk assessment and emergency program activities (Fowler and Takeuchi, 2012; Magarey et al, 2011). 20
34 MoT has not yet been reported outside of South America but its spread poses a threat to wheat producing nations globally. The hypothesis tested in this study was that importing wheat grain from Brazil does not pose a risk for MoT entry into and establishment in the U.S. General statement of modeling philosophy regarding uncertainty. Detailed MoT biological information was not always available. When confronted with parameters for which there was no available data, assumptions were made (Apprendix A) based on general biological principles, surrogate organisms, or expert judgement. Assumptions and extrapolations and the rationale of their application have been clearly identified and explained for transparency purposes. The uncertainty resulting from insufficient information was useful for identifying and prioritizing research needs. Pathway Models Modeling and simulation attempt to explore systems and complex processes when physical experimentation is not feasible (Saltelli et al, 2000). Models are not a perfect representation of reality, but are a powerful tool to approximate or mimic systems and processes of varying nature and complexity (Saltelli et al, 2000). A series of input factors, parameters, equations, and distributions are often used to define a quantitative pest risk pathway model (Devorshak, 2012). Model inputs are subject to different sources of variability and uncertainty (Saltelli, 2000; Vose, 2008). Variability is the effect of chance (i.e. intrinsic variability of the system), and uncertainty is the modeler s lack of knowledge (Saltelli, 2000; Vose, 2008). Fortunately, computer software programs are available to help manage the intrinsic variability and uncertainty through the use of simulation techniques (Palisade Corporation, 2010; Vose, 2008). The methodology used in this analysis was similar to the USDA-APHIS-PPQ-CPHST methodology for developing quantitative risk pathway analyses (Devorshak, 2012). Two stochastic quantitative models (P BR-US and P BR-NC ) were developed to determine the probability of MoT entry as a contaminant of wheat kernels imported from two-wheat blast endemic areas in Brazil: 1. Model P BR-US estimates a nationwide annual rate of MoT entry and establishment. 21
35 2. Model P BR-NC estimates the annual rate of MoT entry and establishment in a more targeted area within southeast North Carolina. The entry and establishment processes of MoT were divided into stages spanning from infected/infested wheat kernels in an MoT endemic agro-ecosystem in Brazil to its entry and establishment into agro-ecosystems in the U.S (Table 2-1). In our analyses, entry refers to the movement of South American MoT strains into the U.S. Establishment refers to the probability of MoT becoming a resident species in the agro-ecosystem studied. It was assumed that if adequate conditions for disease occurrence and overwinter survival were present, then establishment of self-sustaining populations of MoT would likely occur. The two different models used (Table 2-2) relied on several assumptions (Appendix A). For each stage, a probability distribution for infected/infested units or establishments was assigned and then the events modeled (Appendix B, Appendix C). Parameter values for each step in the model were obtained from scientific and technical or from expert estimation when data were not available. Monte Carlo simulation was performed using the risk analysis Industrial Edition. Distributions used in these analyses included Beta, Bernoulli, Binomial, Log-normal, Normal, and PERT. Model Methods and Assumptions Steps 1 5: The U.S. imports feed-grade wheat from Brazil. The use of wheat in animal feeds (Amerah et al, 2011; Rose, 1996; Luce, 2004; Sullivan et al., 2005) is largely restricted to times when the price of wheat is more competitive to corn and other cereal grains (Luce, 2004; Blair and Paulson, 1997; Sullivan et al., 2005; USDA FAS, 2010). In recent years, there have been periods when the international price of wheat has been especially attractive to justify its import and use in animal rations (Promar International, 2003; USDA FAS, 2010; USDA FAS, 2011). To calculate the amount of wheat kernels imported from Brazil, input parameter values were obtained from the USDA Foreign Agricultural Service (FAS) Global Agricultural Trade System (GATS) database (USDA FAS, 2013). These values represent common amounts of wheat grain imports from Brazil during 2009 and PERT is a continuous distribution consisting of minimum, most likely, and maximum values and was used to model this step. A PERT distribution is useful and informative when using small data sets such as estimates from 22
36 subject matter experts (Vose, 2008). To inform this step on models P BR-US and P BR-NC the minimum (126,000 t) and maximum (268,000 t) values reported by USDA FAS GATS were used. The mean between these two amounts (197,000 t) was used as the most likely value. The pathway model was set-up in such a way that Monte Carlo considers 10,000 iterations in each model simulation. Steps 6 7: Origin of imported kernels. In Brazil, wheat is grown in the central, southcentral and southern climatic producing regions (Kochhann, 1987). The top producing states are Paraná and Rio Grande do Sul (CONAB, 2010b; Kochhann, 1987). These two states account for approximately 90% of the national wheat production every year (CONAB, 2010b). Between 2009 and 2010 about 93% of the wheat offered through PEP auctions was produced in the states of Paraná and Rio Grande do Sul (MAPA, 2009a, 2009b, 2009c; MAPA 2010a, 2010b, 2010c, 2010d). During these two years Paraná contributed with 41.1% and Rio Grande do Sul with 52.6% respectively (MAPA, 2009a, 2009b, 2009c; MAPA 2010a, 2010b, 2010c, 2010d). These proportions were used to estimate the amount of wheat coming from each of these two states; e.g. if Brazil exported 126,000 t and 41.1% came from Paraná, then Paraná contributed 51,786 t of wheat for export. For each state, this step was equal to the total number of kernels exported to the U.S. from Brazil times the proportion of exports contributed by each state; e.g. assuming 18,160 kernels/t (Boratynsky, 2005), therefore, Paraná exported 51,786 t x 18,160 kernels/t. 23
37 U.S. BRAZIL Table 2-1. Stages and parameters of the general pathway to estimate the annual rate of the Triticum pathotype of Magnaporthe oryzae entry and establishment from Brazil into the U.S. Count ry Ste p Step Definition 1 tonnes of wheat grain exported to U.S. from Brazil 2 kilograms per tonne conversion 3 kilograms of wheat grain exported to U.S. from Brazil 4 Kernels per kilogram conversion 5 kernels exported to U.S. from Brazil 6 kernels from Parana for export 7 kernels from Rio Grande do Sul for export 8 p (wheat blast outbreak in Paraná) 9 p (wheat blast development in Rio Grande do Sul) 10 p (kernels from infested field in Paraná) 11 p (kernels from infested field in Rio Grande do Sul) 12 number of kernels from infested field in Paraná during outbreak year 13 number of kernels from infested field in Rio Grande do Sul during wheat blast development year 14 p (infected/infested kernels from Paraná) 15 p (infected/infested kernels from Rio Grande do Sul) 16 number of infected/infested kernels from Paraná 17 number of infected/infested kernels from Rio Grande do Sul 18 total number of infected/infested kernels exported from Paraná and Rio Grande do Sul 19 p (kernels spilled between ports and feed mills) 20 number of infected/infested kernels spilled between ports and feed mills 21 p (kernels spilled within winter wheat production areas in the coterminous U.S. or the North Carolina corridor) 22 number of infected/infested kernels spilled in wheat production areas in the coterminous U.S. or the North Carolina corridor 23 climate suitable for MoT establishment in coterminous U.S. or the North Carolina corridor 24 p (wheat blast would occur in U.S. wheat field) 25 number infected/infested kernels spilled in or near field where wheat blast would occur) 26 p (infected volunteer plant from infected kernels) 27 number of infected volunteer plants from spilled infected/infested kernels in or near field where wheat blast would occur 28 p (inoculum from volunteer plant results in establishment) 29 number of initial infections from volunteer plant inoculum 30 total number of establishments from volunteer plant inoculum 31 Number of ungerminated infected/infested kernels spilled in or near field where wheat blast would occur 32 p (inoculum production from infected/infested kernels results in establishment) 33 number of initial infections from infected/infested kernels 34 total number of establishments from infected/infested kernels 35 total number of establishments in the coterminous U.S. or the North Carolina Corridor 36 1 MoT establishment in the coterminous U.S. or the North Carolina corridor 37 years until first establishment in the coterminous U.S. or the North Carolina corridor 24
38 Table 2-2. Models used in this study Model Description Pathway models Purpose Years until first establishment Geographic area Abbreviation Resolution Brazil-U.S. P BR-US 10km; 38km Brazil-North 30m; 10km; P Carolina BR-NC 38km Daily inoculum build up (planting to heading) p ( 12 infection days from planting to heading) p ( 6 infection days from planting to heading) Paraná BG PR 38km Rio Grande do Sul BG RS 38km U.S. BG US 38km North Carolina BG NC 38km Daily infection (heading) Daily frost (planting to heading) Risk corridor Risk of wheat blast outbreak Risk of MoT establishment p ( 2 infection days during heading time) p (zero frost days from planting to heading) p (<105 frost days per year) p (kernel spillage within wheat production areas) p (wheat blast outbreak) p (MoT establishment) Paraná IH PR 38km Rio Grande do Sul IH RS 38km U.S. IH US 38km North Carolina IH NC 38km Paraná FG PR 38km Rio Grande do Sul FG RS 38km U.S. OG US 10km North Carolina OG NC 10km North Carolina C NC 30m Paraná CO PR 38km Rio Grande do Sul CO RS 38km U.S. CE US 10km; 38km North Carolina CE NC 10km; 38km 25
39 Steps 8 9: Probability of a wheat blast outbreak in Paraná and probability of wheat blast development in Rio Grande do Sul. Paraná and Rio Grande do Sul, two MoT natural habitats, are located in the south central and southern wheat growing regions of Brazil (Kochhann, 1987). The south central wheat-growing region includes northern and western areas of Paraná (Kochhann, 1987) where wheat blast outbreaks have historically occurred (Antunes da Cruz, 2008; Igarashi, 1988; Pontes, 2004; Alves and Fernandes, 2006). The southern wheatgrowing region includes south central Paraná and the state of Rio Grande do Sul, where wheat blast outbreaks have not been reported (Pontes, 2004). In the southern wheat-growing region, temperatures during the winter are low and frost periods may occur (Kochhann, 1987). Rainfall patterns in the southern wheat-growing region are uniform throughout the year, with moderately higher amounts received during winter and spring (Kochhann, 1987). In the state of Rio Grande do Sul, blast occurrence incidence is usually very low (Pontes, 2004). It has been suggested that low wheat blast incidence in Rio Grande do Sul may be correlated with adverse climate conditions (i.e. temperature) for disease development (Pontes, 2004). However, the exact factors responsible for the low incidence of wheat blast in Rio Grande do Sul are still unknown. Wheat blast outbreaks were reported in 1987, 2001, 2004, and 2009 in the south central wheat-growing region of Brazil (Antunes da Cruz, 2008; Igarashi, 1988; Pontes, 2004; Alves and Fernandes, 2006, Torres et al., 2009; Fernandes, unpublished). The climatic conditions, as reflected by the minimum and maximum temperatures, differed significantly between Londrina (Paraná) and Lagoa Vermelha (Rio Grande do Sul) during three wheat-growing seasons (2001, 2004, and 2009) when wheat blast incidence and severity was high in Paraná but low in Rio Grande do Sul (Figure 2-1). In both P BR-US and P BR-NC, the probability of a wheat blast outbreak in Paraná and the probability of wheat blast development in Rio Grande do Sul were modeled. According to Fernandes (personal communication), the frequency of observed outbreaks in Paraná is one every five years (1/5=0.2). For Paraná, the probability of a wheat blast outbreak year was modeled using a Binomial distribution (1,p) where p equals 0.2. According to Fernandes (personal communication), in Rio Grande do Sul there is a very low incidence and severity of wheat blast and it has never exceeded the economic damage threshold for Brazil. We have arbitrarily selected a point estimate of p=0.001 for the fact that the disease is not completely 26
40 absent in Rio Grande do Sul. For Rio Grande do Sul the probability of wheat blast development was modeled using a Binomial distribution (1,p). Steps 10-11: Probability that exported kernels are from MoT infested fields in Paraná or Rio Grande do Sul. In both P BR-US and P BR-NC a PERT distribution (min, ml, max) was used to calculate the probability of kernels coming from MoT infested fields in Paraná. The minimum (0) corresponds to non-infested fields and the maximum (0.3) is half the value of the proportion of area affected by excess of rain reported by EMBRAPA (2009). In 2009, an abnormal frequency of rainy days in several Brazilian wheat producing regions made it difficult to adequately control wheat blast and Fusarium head blight (caused by Fusarium graminearum) (Fernandes et al, 2009; IAPAR, 2009). Because it is not clear what was the individual incidence of these two diseases during that year, we assumed that wheat blast affected half of the 60% wheat area planted in Paraná. According to expert observations, both of these diseases can occur together during outbreak years (Torres et al., 2009) and their symptoms on heads can be easily confused (Pontes, 2004). The mean between the minimum and maximum (0.165) was used as the most likely value. Historically, wheat blast severity levels reported in Rio Grande do Sul have not been sufficient to cause economic losses (Pontes, 2004), yet MoT can be present in fields and wheat heads. Kernels from these wheat heads can still be an important source of inoculum. Maximum and most likely values of infested fields have never been reported in Rio Grande do Sul. Given that the disease has been reported at a low incidence, models P BR-US and P BR-NC use a PERT distribution where the minimum (0) corresponds to non-infested fields, and the most likely and maximum values are both factors of ten less than what was used for Paraná. The calculation of these parameter values for Rio Grande do Sul corresponds to a conservative approach to estimating risk (Griffin, 2012). 27
 and Lagoa Vermelha (Rio Grande do Sul")
41 Figure 2-1. Differences in the daily maximum and minimum temperature profiles for Londrina (Paraná state) and Lagoa Vermelha (Rio Grande do Sul state) during 2001, 2004, and 2009 (wheat blast epidemic years in Brazil). Data obtained from the NCEP CFSR database. 28
42 Steps 12 13: Number of kernels from infested fields in Paraná during an outbreak year or Rio Grande do Sul during wheat blast development year. A Normal approximation of the binomial distribution was used in models P BR-US and P BR-NC to calculate these two steps. This Normal approximation uses the mean (n*p) and standard deviation ( n * p(1 p)) of the binomial distribution, where the mean equals the number of kernels exported from either Paraná or Rio Grande do Sul times the probability of kernels coming from MoT affected fields in either Paraná or Rio Grande do Sul. The distribution was truncated to take on values greater than zero. Steps 14 15: Probability that kernels from Paraná or Rio Grande do Sul are infected/infested with MoT. We used the following methodology for both P BR-US and P BR-NC. For Paraná, this probability was calculated using a PERT distribution. The minimum (0) and maximum (0.267) are values of seed infection reported by Goulart et al (1995). The mean seed infection (0.0896) of five experiments (Goulart et al, 1995) was used as the most likely value. The presence of MoT in these experiments was determined using the blotter test. Since the blotter method tends to underestimate the real level of infection, these values were considered adequate in comparison to lower values of MoT incidence in seeds reported in other studies (Goulart, 2000). For Rio Grande do Sul, this probability draws from a Log-normal distribution with mean ( =0.0001) and standard deviation ( =0.0001) parameters reported by Brancão et al (2008). Steps 16 18: Number of MoT infected/infested kernels exported from Paraná or/and Rio Grande do Sul. In models P BR-US and P BR-NC a normal approximation of the binomial distribution was used on this step. In this approximation, the mean (n*p) equals the number of kernels coming from infested fields in Paraná or Rio Grande do Sul times the probability that kernels from Paraná or Rio Grande do Sul are infected/infested with MoT. The standard deviation is equal to ( n * p(1 p)). The number of MoT infected/infested kernels exported was modeled independently for each state, but the total MoT infected/infested kernels exported was calculated by adding the number obtained from each individual state. 29
43 MoT survival in wheat kernels during transportation. MoT longevity is affected by climatic factors and low temperatures favor its survival in wheat seeds (Goulart and Paiva, 1993). MoT was reported to survive from 12 (Goulart and Paiva, 1993) to 22 months (Reis et al, 1995) in wheat seeds stored at room temperature. The assumption is that MoT mycelia will remain viable in wheat kernels long enough to be a source of primary inoculum after entry into the U.S. (National Research Council, 2002). Entry of wheat kernels at U.S. ports. The GATS database reports that the U.S. Custom District of Charlotte, NC, received wheat (Harmonized Tariff Schedule HTS code ) from Brazil between 2009 and 2010 (USDA FAS, 2013). Under current U.S. plant quarantine regulations, wheat kernels from Brazil are neither restricted nor prohibited. Upon arrival in the U.S., representatives of Customs and Border Protection, Agriculture Quarantine Inspection, or Plant Protection and Quarantine visually inspect commodities for the presence of exotic pests, diseases, noxious weeds, soil, and other prohibited matter (USDA APHIS PPQ, 2012a). Given that no molecular diagnostic tool to detect MoT is currently available, infected/infested grain would most likely escape detection during routine inspection by APHIS-PPQ and state regulatory officials. The default assumption is that MoT can escape detection on imported wheat kernels and be released according to the code of Federal Regulation 7 CFR (USDA APHIS PPQ, 2012a). Steps 19 20: Kernel spillage between ports and feed mills. The movement of commodities involves a variety of transportation systems during which losses can occur (Desai, 2004). For grains, these losses are mainly due to spillage and can occur at all stages of the handling and transport process (Desai, 2004; Harris and Lindblad, 1978; USDA GIPSA, 2010). The amount of spillage depends upon the mode of transport, the condition and tightness of the transport vehicle, weather conditions (i.e. winds), and the mode of product transfer (bulk unloading, crane handling, etc.) (Tamis and de Jong, 2010; Evans et al, 1996). The mode of transportation varies by destination and by type of grain (Anonymous, 2012a; Anonymous, 2012b). Trucks are the primary mode of short distance transportation in a range of km or less (Anonymous, 2012a; Anonymous, 2012b). Since 1993, trucks have been the primary 30
44 mode of grain transportation in the U.S. mainly due to the flexibility of delivery (USDA, 2011). Trucks are used to transport imported grain from port terminals to feed mills (Promar International, 2003). In most cases, grain spillage is unavoidable even when transport is in sealed trucks (Reed, personal communication; Tamis and de Jong, 2010). Studies have demonstrated the role of kernel spillage from grain trucks in the establishment of volunteer plant populations along roadside verges and transport networks (Pivard et al, 2008; Yoshimura et al, 2006; Knispel and McLachlan, 2010; von der Lippe and Kowarik, 2007; Crawley and Brown, 2004; Crawley and Brown, 1995). For example, rapeseed feral populations have been found between ports of entry and processing facilities (Aono et al., 2006; Saji et al., 2005). Because transported goods including grain are weighed at numerous points in the transport chain, loss during transport has been quantified (Tamis and de Jong, 2010). However, these datasets are proprietary information and are not disclosed (Tamis and de Jong, 2010). For this reason, we have used estimates of loss given by experts in the trade industry (EFSA Panel on Plant Health, 2010; USDA APHIS, 2008). In models P BR-US and P BR-NC, minimum (0.0025), most likely ( ), and maximum (0.006) values (Italmopa, 2010; EFSA Panel on Plant Health, 2010) were used in a PERT distribution. Step 21: Probability of kernel spillage within winter wheat production areas in the coterminous U.S. or the North Carolina corridor. Two approaches were used to estimate this step. The first approach, for model P BR-US, consisted of an estimate of kernel spillage in winter wheat production areas at the national level. This approach assumed equally spatial risk of spillage in any wheat field in the U.S. To calculate this point estimate, the total U.S. area planted with winter wheat between 2002 and 2013 was modeled with a PERT distribution and divided by the area for the lower 48 states. A PERT distribution, with the minimum (15,108,938 ha) and maximum (18,739,778 ha) planted wheat area reported by the USDA National Agricultural Statistics Service (USDA NASS, 2013), was used to inform this step. The mean wheat area planted (17,111,856 ha) between 2002 and 2013 (USDA NASS, 2013) was used as the most likely value. The area for the lower 48 states was obtained from Esri s GIS (Geographic Information Systems) mapping software. The second approach, for model P BR-NC, consisted of an estimation of kernel spillage in wheat production areas in North Carolina. Upon arrival to the Wilmington seaport (Port of Wilmington General Cargo Terminal), it was assumed that kernels were transported to mills in North Carolina for processing and use as animal feed. This 31
45 assumption is based on the fact that a consortium of corporate North Carolina hog and poultry producers has been the only importer of Brazilian wheat to the U.S. (Great Export Import, 2013). Therefore, the final destination included 16 feed mills in North Carolina belonging to this consortium. This risk corridor approach, named model C NC, assumed equally spatial risk of spillage through a network of roads that initiates from the port of Wilmington and runs through the following ten counties in North Carolina: New Hanover, Brunswick, Columbus, Pender, Bladen, Duplin, Sampson, Wayne, Johnston, and Lenoir. The corridor is comprised of the most likely routes that trucks would take to deliver the imported grain from the Port of Wilmington General Cargo Terminal to the feed mills. The probability of spillage of MoT infected/infested kernels into wheat fields was estimated as follows. The National Agricultural Statistical Service (NASS) Cropscape web-service ( was used to identify any crop that included winter wheat within the ten counties of interest. The information was exported as geotiff files. ArcGIS was used to manually create a network of roads based on routes taken from the Wilmington seaport to each grain feed mill using Google Earth version (Google Inc., Mountain View, CA). Networks of roads with a 2,000m width were created and dissolved into a single unit or corridor. When the corridor was made in ArcGIS, it created a 1,000m distance on both sides of the line. So in this case, a distance of 1000m was created on either side of the line to make a total width of 2,000m (Figure 2-2). Wheat data were converted from raster to vector data and wheat fields from each county were included as a layer (Figure 2-3). Following the calculations for the areas for corridor and wheat fields, all wheat fields that intersected the corridor were summed using a selection statistics tool. The wheat area was divided by the corridor area to get a ratio of wheat to corridor that represented the probability of spillage into a wheat field. The total area of wheat fields within the corridor was approximately 5,247 ha, while the total area of corridor was approximately 100,444 ha. Therefore, the probability of infected/infested wheat kernel spillage into wheat fields was Step 22: Number of infected/infested kernels spilled in winter wheat production areas in the coterminous U.S. or the North Carolina corridor. In both P BR-US and P BR-NC, a binomial distribution (n,p) was used when the number of infected/infested kernels spilled between ports and feed mills was different than zero. In this distribution, the number of 32
46 observations (n) was the number of infected/infested kernels spilled between ports and storage and p the probability of kernels being spilled in winter wheat fields. Step 23: Climate suitability for MoT establishment in the coterminous U.S. or the North Carolina corridor. Thresholds for weather parameters from Rio Grande do Sul and Northern Paraná were used to estimate the risk of MoT establishment and wheat blast outbreaks at other locations. However, due to geographic and climatic variation, predicting MoT establishment and wheat blast outbreaks based on direct extrapolations from Brazil was not possible. To account for differences in agro-ecological systems between Brazil and the U.S., it was assumed that weather parameters could independently influence the three parameters believed most important: MoT inoculum build-up, infection during heading, and winter survival of MoT. These same parameters would also likely influence the development of wheat blast outbreaks. Therefore, a climate-based inductive approach was developed to estimate the climate suitability for the three parameters under U.S. conditions. The final product of this inductive approach is given in the form of climate suitability risk maps showing the probability of MoT establishment in the coterminous U.S. (Figure 2-6) and in a ground transportation-based corridor in North Carolina (Figure 2-7). For comparison purposes only, two climate suitability risk maps were developed to show the probability of wheat blast outbreaks in the coterminous U.S. (Figure 2-6) and in a corridor in North Carolina (Figure 2-7). To estimate the risk of MoT establishment, the threshold for MoT inoculum build-up was based on data from MoT s native habitat in Rio Grande do Sul where the pathogen is established, but outbreaks do not occur (Pontes, 2004). To estimate the risk of wheat blast outbreak, the threshold for MoT inoculum build-up was based on data from MoT s native habitat in Northern Paraná where the pathogen is established and outbreaks periodically occur (Antunes da Cruz, 2008; Igarashi, 1986; Igarashi, 1988; Pontes, 2004; Alves and Fernandes, 2006). The threshold for MoT infection at the heading stage did not differ between Rio Grande do Sul and Northern Paraná and was applied to estimate both the risk of MoT establishment and wheat blast outbreaks in the coterminous U.S. and in a defined corridor in North Carolina. Since harsh winters occur in the U.S. but not in Brazil, we selected a threshold for MoT overwintering survival based on extrapolations from the Lolium (ryegrass) population of M. oryzae (MoL), a close relative of MoT currently established in the U.S. This 33

47 threshold was also applied to estimate both the risk of MoT establishment and wheat blast outbreaks in the coterminous U.S. and in a defined corridor in North Carolina. Figure 2-2. An MoT risk corridor in North Carolina was identified based on the most likely truck routes for transportation of imported wheat grain from the port of Wilmington to feed mills. 34

48 Figure 2-3. Winter wheat fields in 10 selected counties in North Carolina that encompass the MoT risk corridor. 35
49 Thresholds for MoT establishment and wheat blast outbreak in its native habitats in Brazil The average number of infection days during the growing season, the average number of infection days during heading, and the average number of frost days in Paraná and Rio Grande do Sul were determined using an average prediction made from 10 years of climate data. Thresholds were selected empirically from each independent map based on the known spatial distribution of MoT and the known spatial distribution of wheat blast outbreaks (Figure 2-4). The threshold identified for MoT establishment was 6 or more infection days during the growing season (based on data from Rio Grande do Sul), two or more infection days during heading, and zero frost days during the growing season. The threshold identified for Mot outbreaks was 12 or more infection days during the growing season (based on data from northern Paraná), two or more infection days during heading, and zero frost days during the growing season. It was assumed that when these thresholds were reached, the combined effect lead to MoT establishment in Rio Grande do Sul and wheat blast outbreak in northern Paraná. The primary limiting factor for MoT establishment (6 or more infection days) or for blast outbreak (12 or more infection days) was the threshold for accumulated infection days during the growing season. Based on the selected thresholds, risk maps were generated for wheat blast outbreaks in Paraná and Rio Grande do Sul. Developing these risk maps served to test NAPPFAST capabilities knowing that MoT is established in both Paraná and Rio Grande do Sul, but wheat blast never gets to outbreak levels in Rio Grande do Sul. The outbreak risk models did not take into account the source of inoculum and assumed a uniform spatial distribution of MoT in Paraná and Rio Grande do Sul. It also assumed that the inoculum would be constant between years (i.e. it could not accoult for inoculum loss after a sequence of non-favorable years). The proposed climate risk maps were based on the assumption that wheat blast outbreaks in Paraná and Rio Grande do Sul are limited by the occurrence of build-up 36


50 Figure 2-4. Spatial display of accumulated infection days based on 10-years of CFSR climate data for Paraná and Rio Grande do Sul. Paraná Rio Grande do Sul Accumulated infection during growing season From 04/15 to 08/30 From 06/15 to 10/15 Accumulated infection during heading From 06/01 to 08/30 From 08/01 to 10/15 From 04/15 to 08/30 From 06/15 to 10/15 Accumulated frost 37
51 of inoculum from planting to heading, presence of infection periods during heading time, and frost days from planting to heading. It was assumed that sudden frost periods could significantly reduce inoculum/infection. Three independent climate suitability models were constructed for Paraná (BG PR, IH PR, FG PR ) and for Rio Grande do Sul (BG RS, IH RS, FG RS ) to estimate 1) inoculum build-up from planting to heading (BG PR and BG RS ), 2) infection at the heading stage (IH PR and IH RS ), and 3) frost effect on inoculum/infection from planting to heading (FG PR and FG RS ) (Appendix D). Climate suitability (CO X ) for wheat blast outbreaks was determined by comparing the climatic conditions during wheat blast outbreak years (1987, 2004, 2009) to the climatic conditions during non-outbreak years (2003, 2005, 2006, 2007, 2010) (Appendix D). A cumulative risk estimate was generated using the following equations and thresholds: Equations CO PR BG PR IH PR FG PR Thresholds BG PR and BG RS = infection days 12 CO RS BG RS IH RS FG RS IH PR and IH RS = infection days 2 FG PR and FG RS = zero frost days Using these equations and thresholds, spatially explicit cumulative risk maps were generated for Paraná and Rio Grande do Sul (Appendix E). According to probability theory, three events are independent as long as the outcome (probability) of any one event does not affect the outcome of the other events (Moore and McCabe, 2006; Vose, 2008). The multiplicaton rule for three independent events is given by P(A B C)=P(A)P(B)P(C) (Moore and McCabe, 2006; Vose, 2008). According to our models, wheat blast outbreaks in Paraná and Rio Grande do Sul are dependent upon three parameters: climatic conditions that affect inoculum build-up, infection at heading, and the occurrence of frost. It was assumed that these parameters were independent and thus the multiplication rule was implemented (Moore and McCabe, 2006; Vose, 2008). When these events occur during the same wheat growing season, there is risk for a wheat blast outbreak. Each pixel was assigned a daily value between 0 (unfavorable) and 1 (favorable) and values were accumulated over time. All models used 10-year daily climatic data 38
52 from the National Centers for Environmental Prediction (NCEP) Climate Forecast System Reanalysis (CFSR) at a 38k resolution (Saha et al., 2006). MoT inoculum build-up and infection parameters included daily temperatures (minimum = 10 C, optimum = 27.5 C, and maximum = 32 C), leaf wetness (minimum = 12h, maximum = 24h), and precipitation (>2 mm). Cardinal temperatures and wetness parameters were derived from Moss and Trevethan (1987), de Andrade Cardoso et al (2008), Anderson et al (1948), and Alves and Fernandes (2006). Frost model input included minimum daily temperatures above 0 C. Threshold for MoT overwintering survival based on extrapolations from an MoT close relative currently established in the U.S. MoT in Brazil is not subject to extreme low temperatures as it could be in some wheat growing regions of the U.S. Two phylogenetic relatives of MoT, the Oryza (MoO) and Lolium (MoL) pathotypes of M. oryzae, causal agents of rice blast and gray leaf spot of perennial ryegrass, respectively are currently established in the U.S. Freezing temperatures limit the survival of the MoL pathotype (Harman and Latin, 2003; Harmon and Latin, 2005). Since MoL is a close phylogenetic relative of MoT (Farman, 2002; Tosa et al, 2004; Viji et al., 2001), MoT populations could be limited by overwinter survival in the U.S. The geographic range and transition zone of MoL in the U.S., as described by Harmon and Latin (2005), were used to estimate a threshold for the number of low temperature days that could limit MoT survival. Threshold maps based on 10-year daily climatic data at a 10km resolution (NAPPFAST) were created. A risk map with a threshold of 105 or more frost-days per year (Figure 2-5) closely matched the approximate geographic range of gray leaf spot on perennial ryegrass in Indiana (Harmon and Latin, 2003; Latin and Harmon, 2005), Illinois (Pedersen et al., 2000), Pennsylvania (Landschoot and Hoyland, 1992; Uddin et al., 1999), Connecticut and Rhode Island (Schumann and Jackson, 1999), California, Nevada, and Utah (Wong, 2006). This overwintering risk map also matched the northern boundary of the transition zone described by Harmon and Latin (2005). Gray leaf spot has occurred infrequently in Iowa, Nebraska, and Kansas, and has not been confirmed in northern Midwestern states such as Michigan, Wisconsin, and Minnesota (Latin and Harmon, 2004). 39
.")
53 Figure 2-5. Based on the survival of the closely related MoL pathotype, it was assumed that MoT survival in the U.S. would be limited by frost occurrence (>105 frost days to simulate the MoL pathotype). The map in this figure displays the area where low temperatures are predicted to preclude the overwinter survival of MoT (red area) and the zone where the overwinter survival of MoT will not likely be limited (white area). A transition zone exists where low temperatures may or may not limit the overwinter survival of MoT. Map based on 10-year climate from NAPPFAST North American station dataset. Calculating the climate suitability for MoT inoculum build-up, infection during heading and MoT overwintering survival in the coterminous U.S. and the North Carolina Corridor It was assumed that once introduced, MoT would be exposed to a range of climatic conditions that would determine whether MoT propagules were produced to infect a susceptible host and whether MoT would survive from season to season in the U.S. (Theoharides and Dukes, 2007). It was assumed that if adequate conditions for disease occurrence and overwinter survival were present, then establishment of self-sustaining populations of MoT would likely occur. 40
54 Three independent climate suitability models were constructed for the coterminous U.S. (BG US, IH US, OG US ) and for the North Carolina corridor (BG NC, IH NC, OG NC ) to estimate 1) inoculum build-up (BG US and BG NC ), 2) infection at the heading stage (IH US and IH NC ), and 3) frost effect on inoculum survival (OG US and OG NC ). Climate suitability for MoT establishment (CE X ) was determined and a cumulative risk estimate was generated using the following equations and thresholds: Equations CE US BG US * IH US *OG US CE NC BG NC * IH NC *OG NC Thresholds BG US and BG NC = infection days 6 IH US and IH NC = infection days 2 OG US and OG NC = frost days < 105 Using these equations and thresholds, maps were developed for the coterminous U.S. and the North Carolina corridor. The NAPPFAST modeling system used 10-year daily CFSR data (Saha et al., 2006) at 38km resolution to create inoculum build-up maps, and 10-year daily station climatic data at a 10km resolution to create infection during heading and frost maps. Cardinal temperatures and wetness parameters used for inoculum build-up and infection during heading models were derived from Moss and Trevethan (1987), de Andrade Cardoso et al (2008), Anderson et al (1948), Alves and Fernandes (2006). Input parameters included a minimum (10 C), optimum (27.5 C), and maximum (32 C) temperatures; minimum (12h), and maximum (24h) leaf wetness hours; and minimum (2 mm) precipitation. To account for the geographic variation in dates of phenological stages that influence susceptibility to head infection, the U.S. was divided into three major groups or tiers that included the lower 48 states (Table 2-3). Representative wheat producing states (USDA, 2013) included Texas and Oklahoma (tier 1), Kansas and Nebraska (tier 2), and South Dakota and North Dakota (tier 3). U.S. tiers were assigned dates for usual wheat active growth after winter dormancy and dates for usual heading (Table 2-4). These representative dates were selected and used in models BG US, IH US, BG NC and IH NC. The assumption is that inoculum build-up starts approximately 60 days prior to the beginning of winter wheat heading. These 60 days correlate with the description of the literature when Feekes developmental stage 4-5 is present in 41
55 representative states on each tier (Paulsen, 1997; Royer, 2010; Hall and Nleya, 2012; Weisz, 2011). The Feekes developmental stage 4-5 (Large, 1954) is an indication of when a break of winter wheat dormancy occurs. Likewise, the assumption is that infection starts at the beginning of heading. Table 2-3. The coterminous 48 U.S. states were grouped into tiers based upon usual wheat active growth after winter dormancy and approximate heading dates to account for the geographic variation in dates of susceptibility to head infection. Tier No. States Arkansas, Alabama, Arizona, California, Florida, Georgia, Louisiana, 1 Mississippi, Oklahoma, South Carolina, Texas, North Carolina Delaware, Illinois, Kansas, Kentucky, Maryland, Missouri, New Jersey, New 2 Mexico, Tennessee, Virginia Colorado, Connecticut, Idaho, Indiana, Iowa, Maine, Massachusetts, Michigan, Minnesota, Montana, Nevada, New Hampshire, New York, North Dakota, Ohio, 3 Oregon, Rhode Island, South Dakota, Utah, Vermont, Washington, West Virginia, Wisconsin, Wyoming, Pennsylvania, Nebraska Table 2-4. For each tier critical dates were identified for the periods of wheat active growth after winter dormancy and heading (USDA, 2010; USDA NASS, 2013). This information was used to inform model parameters of inoculum build-up and infection at heading. The North Carolina corridor was modeled using information from tier 1. Tier Dates for usual wheat active growth after winter Approximate dormancy heading date Begin & Begin* End^ 1 February 5 April 5 May 20 2 March 3 May 3 June 9 3 March 20 May 20 June 28 & Dates selected based on approximate timing for Feekes developmental stage 4-5. * 5% complete on tier. ^ 90-95% complete on tier. 42
56 Figure 2-6. Climate suitability risk maps showing the probability of MoT establishment (A) and the probability of a wheat blast outbreak (B) in the coterminous U.S. based on ten years of NCEP-CFSR climate data. 43
")
57 Figure 2-7. Climate suitability risk map showing the probability of MoT establishment (A) and a wheat blast outbreak (B) in the North Carolina corridor. 44
58 Given that the probability values of the climate suitability risk for MoT establishment (i.e. probability of establishment year) are discrete, a discrete distribution based on the proportion of each rank was selected as a way of representing the climate suitability risk of climate match for MoT establishment in models P BR-US and P BR-NC. The probability of MoT establishment was modeled using a Binomial distribution (1,p) where p was calculated through the aforementioned discrete distribution for the coterminous U.S. or the North Carolina corridor (Table 2-5). Cell (pixel) counts were obtained from climate suitability risk maps from the three major groups or tiers that included the lower 48 U.S. states (Appendix F). Cell counts only include data from final suitability risk maps that consider winter wheat presence. Table 2-5. Cell counts for each predicted probability class for MoT establishment in the coterminous U.S. and the North Carolina corridor. p ranking value U.S. Tier 1 U.S. Tier 2 U.S. Tier 3 Cell Count U.S. Total U.S. Total proportion North Carolina North Carolina proportion 0 470, ,961 2,233,696 2,923, , , , , , ,052 69, , ,691 77,846 77, , ,203 89,981 38, , ,946 63,314 31, , ,097 63,555 22, , ,315 47,290 24, , ,756 42,105 12, , ,777 32,151 4, , ,164 2, , TOTAL 1,355, ,375 2,626,043 4,848,
59 Cell counts for the probability of climate match for wheat blast outbreaks in the coterminous U.S. and the North Carolina corridor (Table 2-6) are provided for comparison and not for modeling purposes. Table 2-6. Cell counts for each predicted probability class for wheat blast outbreak in the coterminous U.S. and the North Carolina corridor. P ranking value U.S. Tier 1 U.S. Tier 2 U.S. Tier 3 Cell Count U.S. Total U.S. total proportion North Carolina North Carolina proportion 0 791, ,136 2,305,688 3,658, , , , , ,452 98,136 58, , ,815 15,258 45, , , ,724 74, , ,456 23, , , , , , , TOTAL 1,355, ,375 2,626,043 4,848, Step 24: Probability that wheat blast will occur in a U.S. wheat field. The suitability for MoT infestation at the field level would differ from location to location. In the absence of information, we used a default assumption to bridge the gap and uncertainty in this step. The greatest probability of field suitability for infection during an outbreak year in Brazil was assumed to be the most appropriate for risk assessment since wheat blast has not been reported in the U.S. The same distribution and parameters to calculate the probability of kernels coming 46
60 from infested fields in Paraná were used to estimate the probability for this step for both P BR-US and P BR-NC models. Step 25: Number of infected/infested kernels spilled in or near field where wheat blast would occur. To calculate this step, a conditional statement, and a binomial distribution were used. If the climate was not suitable for establishment, then the output was zero. Otherwise, a binomial distribution (n, p) was used where n was the number of infected/infested kernels spilled within wheat fields and p was the probability that wheat blast will occur in a U.S. wheat field. Step 26: Probability that MoT infected volunteer plant germinates from MoT infected/infested kernel. The probability of MoT transmission from infected/infested kernels to volunteer plants was modeled in both P BR-US and P BR-NC. A Beta distribution was used for this purpose, where s equals the number of seedlings with MoT and n equals the number of kernels, values reported by Goulart and Paiva (1990). Studies have demonstrated the role of kernel spillage from grain trucks in the establishment of volunteer plant populations along roadside verges (Pivard et al, 2008; Yoshimura et al, 2006; Knispel and McLachlan, 2010; von der Lippe and Kowarik, 2007). Some of the MoT infected/infested spilled kernels would potentially germinate and produce MoT infected volunteer plants along roadside verges. As the pathogen grows and invades new tissue, these volunteer plants could potentially sustain large amounts of MoT conidia that could serve as inoculum. Step 27: Number of infected volunteer plants emerged from spilled infected/infested kernels in or near a wheat field where wheat blast would occur. To calculate this number in both P BR-US and P BR-NC, a conditional statement and a binomial distribution were used. If the number of infected/infested kernels spilled in or near a field where wheat blast would occur was zero, the output was zero. Otherwise, a binomial distribution (n, p) was used where n was the number of infected/infested kernels spilled in or near a field where wheat blast would occur and p the probability that MoT infected volunteer plants germinate from MoT infected/infested kernels. Step 28: Probability that inoculum from a volunteer plant results in establishment. In the absence of specific information for MoT, this step used the Tens Rule proposed by 47
61 Williamson and Fitter (1996). Assuming that inoculum is dispersed from an infected volunteer plant, there is a given probability that MoT establishment would occur. According to the Tens rule, approximately 10% of imported species will be released or escape in the wild, 10% of the introduced ones will become established, and 10% of the ones established will become a pest (Williamson and Brown 1986; Williamson 1993; Williamson, 1996). From our perspective, this means that most inoculum will not be effective because will be unable to reach the infection court in a timely manner and will not find adequate conditions for establishment. As a result, we used a point estimate of 0.01 (10% released times 10% established according to the Tens rule ) on this step for both P BR-US and P BR-NC. It is important to mention that we did not calculate nor did we include MoT spore dispersal parameters. Step 29: Number of initial infections from volunteer plant inoculum. To calculate this number on both P BR-US and P BR-NC, a conditional statement and a binomial distribution were used. A binomial distribution (n, p) was used where n was the number of infected volunteer plants from spilled infected/infested kernels in or near a wheat field where wheat blast would occur; p was the probability that inoculum from volunteer plant results in establishment. Step 30: Total number of establishments from volunteer plant inoculum. The central limit theorem states that the sum or average of a large number of independent parameters, with different probability distribution types, will have an approximately normal distribution (Vose, 2008). The central limit theorem allows us to model variation in the number of establishments that an initial establishment will produce. Therefore, a normal approximation was used to estimate this step in pathway models P BR-US and P BR-NC. In this normal approximation (n, n ) and are the mean and standard deviation for number of establishments possible from inoculum produced in a volunteer plant, and n the number of initial establishments from a volunteer plant. In the absence of specific information, we used a factor ten times more than the and values used for the number of establishments possible from ungerminated infected/infested kernels. Step 31: Number of ungerminated infected/infested kernels spilled in or near field where wheat blast would occur. To estimate this number in pathway models P BR-US and P BR- 48
62 NC, the number of infected/infested kernels spilled that germinated and became volunteer plants was subtracted from the number of infected kernels spilled in or near a field where wheat blast would occur. These are kernels that will be on the surface of roads or soil. They will be subject to varying climatic conditions. The rate of transmission from infected/infested kernels to seedlings is close to 4% (Goulart and Paiva, 1990). Therefore, it was assumed that the approximate remaining 96% of infected/infested kernels would produce inoculum on the kernel surface. Step 32: Probability that inoculum from infected/infested kernels results in establishment. Most inoculum will not be effective because will not be able to reach the infection court in a timely manner and will not find adequate conditions for establishment. The tens rule of release and establishment was assumed (Williamson and Fitter, 1996). As a result, we used a point estimate of 0.01 on this step in both P BR-US and P BR-NC. MoT spore disersal parameters were not included to calculate this probability. Step 33: Number of initial infections from infected/infested kernels. To calculate this number in both P BR-US and P BR-NC, a conditional statement and a binomial distribution were used. A binomial distribution (n, p) was used where n was the number of infected/infested kernels spilled in or near a field where wheat blast would occur and p the probability that inoculum from infected/infested kernels results in establishment. Step 34: Total number of establishments from infected/infested kernels. A normal approximation was used to estimate this step in pathway models P BR-US and P BR-NC. In this normal approximation (n, n ) and are the mean and standard deviation for number of establishments possible from infected/infested kernels inocula, and n the number of initial establishments from infected/infested kernels inocula. The mean and standard deviation of possible establishments from inocula originating on infected/infested kernels was calculated as follows. The mean and standard deviation of MoT spores produced on kernels threshed from wheat spikes with four levels of artificial infection (0.1-10%, 11-40%, 41-80%, and %) was calculated (Cruz et al., unpublished). Even though each individual spore has the capacity to infect a host and create an establishment focus, there are forces that can preclude establishment 49
63 (Williamson and Fitter, 1996). The mean and standard deviation for MoT spores (Cruz et al., unpublished) were assumed to be subjected to those forces. As a result, the mean and standard deviation for MoT spores produced on kernels were each multiplied by 0.01 (Williamson and Fitter, 1996) to obtain the mean and standard deviation for number of establishments possible from infected/infested kernels. Step 35: Total number of establishments in the coterminous U.S or North Carolina corridor. Resulted from the sum of the total number of establishments from inoculum produced on volunteer plants and infected/infested kernels. Step 36: 1 establishment in the coterminous U.S. or North Carolina corridor. This step consisted of a conditional statement: if the total number establishments in the U.S. or North Carolina was zero, then the output in this step was zero. Otherwise, a value of one was reported if at least one establishment occurred. A probability (p) for at least one establishment was calculated. This probability was calculated based on the number of establishment successes after running 10,000 iterations. The mean x 1 x n i represents the probability of at least one establishment occurrence; where x is the number of establishment successes and n the number of iterations. Step 37: Years until first establishment in the coterminous U.S or North Carolina corridor. The number of years (trials) to achieve one or more establishments (success) was modeled according to Vose s (2008) methodology. A negative binomial distribution (Vose, 2008) was used considering that each trial may or may not become a success according to previous random processes (Vose, 2008). The years needed for at least 1 MoT successful establishment was given by the distribution 1+RiskNegBin(1,p), where 1 successful establishment is required in any given year, with p probability that any individual year will consist of a successful establishment (p calculated in previous step). 50
64 Sensitivity Analysis. To identify the extent to which input parameters influenced the outcomes, a sensitivity analysis (Vose, 2008) was conducted on each model P BR-US and P BR-NC, respectively. The purpose of a sensitivity analysis was to identify sources of variation in the model (Saltelli et al, 2000). For that reason, a sensitivity analysis was used to identify key input parameters that mainly contribute to the output variability (Vose, 2008). Our sensitivity analysis was based on the Spearman s rank order correlation coefficient r. Rank order correlation analysis was performed on data generated from input distributions and data calculated for output parameter 1 MoT establishment? for either the U.S. or North Carolina. Rank order correlation is considered a robust analysis given its non-parametric nature (Vose, 2008). By performing rank order correlation, tornado charts were developed. Tornado charts display the influence of an input distribution on a selected model output (Vose, 2008). They are commonly used to verify if the model has worked as expected (Vose, 2008). Tornado charts consist of individual input distributions listed vertically and represented by horizontal bars (Vose, 2008). The largest bar at the top of the chart represents the input with the highest degree of correlation and the most influential input model parameter. The higher the degree of correlation between input and output parameters, the more influence the input parameter has on the selected output (Vose, 2008). 51
65 Results Using historical data of U.S. wheat imports from Brazil, we estimated that approximately 94% of the imported wheat grain originated in Paraná and Rio Grande do Sul. Two approaches were used to estimate the probability of kernel spillage within winter wheat production areas in the U.S. The first approach consisted of an estimate of kernel spillage in winter wheat production areas at the national level. This approach assumed equally spatial risk of spillage in any winter wheat field in the U.S. The second approach consisted of an estimation of kernel spillage in winter wheat production areas in a ground transportation-based corridor in North Carolina. Outputs from selected parameters in models P BR-US and P BR-NC are summarized in Table 2-7. Table 2-7. Selected risk output results from models P BR-US and P BR-NC Step Minimum Mean Maximum P BR-US P BR-NC P BR-US P BR-NC P BR-US P BR-NC 18 a E E E E b E E E E c E E E E d e a total number of kernels infected/infested with Magnaporthe oryzae (Triticum pathotype) (MoT) exported from Paraná and Rio Grande do Sul, states in Brazil. b number of infected/infested kernels spilled in wheat production areas in the coterminous U.S. or the North Carolina corridor c total number of MoT establishments in the coterminous U.S. or the North Carolina Corridor d Probability that 1 MoT establishment occurs in the coterminous U.S. or the North Carolina corridor e years until first MoT establishment in the coterminous U.S. or the North Carolina corridor 52
66 Assuming an importation of 126,000 to 268,000 t of Brazilian wheat per year, 80% of the simulations indicated that zero infected/infested kernels could enter the U.S., 15% of those simulations were between 1 and 31.3 billion kernels, and 5% were greater than 31.3 billion infected/infested kernels (Figure 2-8). According to our analyses, 15% of the simulations in models P BR-US and P BR-NC indicated that 1 to 2.72 million and 1 to 6.61 million infected/infested kernels would be spilled in winter wheat fields nationwide (Figure 2-9) and in a North Carolina corridor (Figure 2-10), respectively. Approximately eighty percent of the simulations in models P BR-US and P BR-NC indicated that zero infected/infested kernels would be spilled in winter wheat fields nationwide or within a corridor in North Carolina. Figure 2-8. Cumulative distribution function for the total kernels infected/infested with Magnaporthe oryzae (Triticum pathotype) (MoT) exported from Paraná and Rio Grande do Sul, states in Brazil, to the U.S. 53
67 Figure 2-9. Cumulative distribution function for the amount of kernels infected/infested with Magnaporthe oryzae (Triticum pathtype) (MoT) spilled in U.S. winter wheat production areas. Figure Cumulative distribution function for the amount of kernels infected/infested with Magnaporthe oryzae (Triticum pathotype) (MoT) spilled in winter wheat production areas within a corridor in North Carolina. 54
68 In approximately 60% of the coterminous U.S. winter wheat production areas, the risk of MoT establishment is zero (Figure 2-6A, Table 2-5, Figure 2-11). The remaining 40% are areas where conditions for MoT establishment may exist in a range from one out of ten years (0.1) to nine out of ten years (0.9). For individual frequency categories of the p ranking value, the proportion of area is approximately 8% or less (Figure 2-11). According to these results, areas with a risk of MoT establishment of 0.1 or higher are located in the states of Texas, Oklahoma, Louisiana, Arkansas, Mississippi, Tennessee, Alabama, Georgia, Florida, South Carolina, North Carolina, Kansas, Nebraska, Iowa, Missouri, Illinois, Kentucky, Indiana, Michigan, Ohio, Virginia, West Virginia, Pennsylvania, Maryland, Delaware, and New Jersey (Figure 2-6A). According to model projections, most of the winter wheat production areas in the coterminous U.S. (approximately 75%) are not at risk of wheat blast outbreaks (Figure 2-6B, Table 2-6, Figure 2-12). In the approximately 25.5% remaining area, conditions for wheat blast outbreaks may exist in a range from one to eight out of ten years. For individual frequency categories such as 0.1, the proportion of area at risk is approximately 13%, and for the remaining categories, it is less than 5% (Figure 2-6B, Table 2-6, Figure 2-12). According to the climate suitability risk map for wheat blast outbreaks in the U.S. areas with a risk of 0.1 or higher are located in the states of Texas, Oklahoma, Louisiana, Arkansas, Mississippi, Tennessee, Alabama, Georgia, Florida, South Carolina, North Carolina, Kansas, Nebraska, Iowa, Missouri, Illinois, Kentucky, Indiana, Michigan, Ohio, Virginia, West Virginia, and Pennsylvania (Figure 2-6B). In approximately 9% of the North Carolina corridor, the risk of MoT establishment is zero (Figure 2-7A, Table 2-5, Figure 2-13). In approximately 55% of this corridor conditions for MoT establishment may exist seven out of ten years. The remaining 36% of the corridor may possess conditions adequate for MoT establishment five, six, eight, or nine years out of ten (Figure 2-7A, Table 2-5, Figure 2-13). According to our results, areas of risk range from 0.5 to 0.9 and are located in a corridor that passes through Columbus, Pender, Bladen, Duplin, Sampson, Wayne, Johnston, and Lenoir counties (Figure 2-7A). In 19.7% of the North Carolina corridor area, the risk of conditions for wheat blast outbreaks is zero (Figure 2-7B, Table 2-6, Figure 2-14). However, in 50.5% of the area, conditions for wheat blast outbreaks may exist one out of ten years, and in 29.8% of the area, conditions may exist two out of ten years (Figure 2-55
69 7B, Table 2-6, Figure 2-14). These areas are located in a corridor that passes through Columbus, Bladen, Pender, Sampson, Duplin, and Lenoir counties (Figure 2-7B). Figure Proportion of U.S. winter wheat production areas at risk of MoT establishment according to cell counts of p ranking values. Figure Proportion of U.S. winter wheat production areas at risk of wheat blast outbreak according to cell counts of p ranking values. 56
70 Figure Proportion of winter wheat production areas in the North Carolina corridor at risk of MoT establishment according to cell counts of p ranking values. Wheat is not produced in two of the ten counties through which the corridor runs and consequently there is an approximately 10% probability of a zero risk of MoT establishment. Figure Proportion of winter wheat production areas in the North Carolina corridor at risk of wheat blast outbreak according to cell counts of p ranking values. 57
71 According to model P BR-US, 96.52% of the 10,000 simulations indicated that no MoT establishment would occur in the coterminous U.S (Table 2-7). This means that 3.48% of the 10,000 simulations of model P BR-US indicated that at least one MoT establishment would occur in the U.S. (Table 2-7). According to model P BR-NC 87.79% of the 10,000 simulations indicated that no MoT establishment would occur within the North Carolina corridor (Table 2-7). However, 12.21% of the 10,000 simulations of model P BR-NC indicated that at least one establishment would occur within the corridor (Table 2-7). It is important to note that millions of MoT establishments could occur during a given simulation but only the occurrence of at least one establishment was considered. When successful establishment occurred in a given simulation, Model P BR-US predicted a mean of approximately 20,000 MoT establishments while model P BR- NC predicted a mean of approximately 160,000 MoT establishments (Table 2-7). Outputs from both models predicted that MoT entry into the U.S. through an identified pathway and establishments in U.S. agro-ecosystems are probable within different time frames. Model P BR-US predicted that MoT establishment in the coterminous U.S. could occur within a range of 1 and 282 years, with a mean of 29 years (Table 2-7, Figure 2-15). Model P BR-NC predicted that MoT establishment in a North Carolina corridor could occur within a range of 1 and 71 years, with a mean of 8 years (Table 2-7, Figure 2-16). Sensitivity Analysis. Tornado charts in Figures 2-17 and 2-18 display the influence of input parameters on the selected model output 1 MoT establishment in models P BR-US and P BR-NC. These charts identified key input parameters that mainly contributed to variability of model output. Horizontal bars represent individual input parameters listed vertically. The largest bar at the top of the chart represents the input with the highest degree of correlation and the most influential input model parameter. In both P BR-US and P BR-NC models the most influential input parameter was grain spillage in or near wheat field where wheat blast would occur, and climate suitability for MoT establishment was second in importance. Other important input parameters in model P BR-NC included the number of initial infections from infected/infested kernels or volunteer plant inoculum, and the number of infected volunteer plants from spilled infected/infested kernels in or near a field where wheat blast would occur. 58
72 Figure Discrete probability distribution and cumulative distribution function for years until first establishment of Magnaporthe oryzae (Triticum pathotype) (MoT) in the U.S. Figure Discrete probability distribution and cumulative distribution function for years until establishment of Magnaporthe oryzae (Triticum pathotype) (MoT) in a corridor in North Carolina. 59
73 Figure Sensitivity analysis for the likelihood of at least one establishment of Magnaporthe oryzae (Triticum pathotype) (MoT) in the U.S. The Spearman correlation coefficient value for each parameter is shown on each bar. numer infected/infested kernels spilled in or near field where wheat blast would occur 0.99 climate suitable for MoT establishment in coterminous U.S Coefficient value Figure Sensitivity analysis for the likelihood of at least one establishment of Magnaporthe oryzae (Triticum pathotype) (MoT) in North Carolina. The Spearman correlation coefficient value for each parameter is shown on each bar. number infected/infested kernels spilled in or near field where wheat blast would occur climate suitable for MoT establishment in the North Carolina corridor number initial infections from infected/infested kernels number of infected volunteer plants from spilled infected/infested kernels in or near field where wheat blast number of initial infections from volunteer plant inoculum Coefficient value 60
74 To assess the quality and predictive capabilities of models P BR-US and P BR-NC, various methods were used (Vose, 2008). Spreadsheets were checked for syntax, mechanical, logical, application, and administrative errors. Models were also subject to internal auditing. Model behavior was assessed through running random scenarios, comparing with known answers (i.e. setting rates to zero), stressing parameter values (i.e. setting parameter values to extreme), and analyzing outputs (Vose, 2008). In addition, important input parameters identified through the sensitivity analysis verify that the model has worked as expected. Discussion The U.S. mainly imports wheat from Canada, but over the last decade Brazil, Mexico, and the United Kingdom figure among the list of countries that have exported wheat to the U.S. (USDA FAS, 2013). Factors such as high corn prices, relatively large world production of wheat, government policies, and favorable transportation prices may have influenced this growth in wheat imports (Promar International, 2013; Piggott, 2013). Detailed information (e.g. amount and origin) is available regarding the U.S. importation of wheat grain from Brazil (Great Export Import, 2013; SEAPA, 2010; CONAB, 2010a; USDA FAS, 2013). Trade policy and practice, and local economics within Brazil and the U.S. have resulted in the creation of a pathway that may spread MoT beyond South America. The Brazilian export-subsidy program PEP promotes and integrates domestic market systems and export markets. One consequence of PEP policy is that low quality commodities, including wheat, get exported. For instance, PEP auctions of wheat have been implemented for the international market when the national production has not reached the standard of quality for the wheat consumed internally (Bem Paraná, 2010; SEAPA, 2010). In 2009, an abnormal frequency of rainy days in several Brazilian wheat producing regions made it difficult to adequately control wheat blast and Fusarium head blight (caused by Fusarium graminearum) (Fernandes et al, 2009; IAPAR, 2009). Major losses were reported in Paraná, São Paulo and the Federal District (CONAB, 2010a). That year, approximately 0.8 million hectares of wheat were affected, corresponding to 32% and 60% of the total area planted to wheat in Brazil and the state of Paraná, respectively (EMBRAPA, 2009; CONAB. 2010a; CONAB 2010b; IAPAR, 2009). The harvested product was rejected by the Brazilian milling 61
75 industry due to its low quality (CONAB, 2010a) and sold as salvage crop for livestock feed in other countries (SEAPA, 2010). During 2009 and 2010, PEP auctions of wheat intended for export reached a total of 540,000 and 944,000 t respectively. Paraná and Rio Grande do Sul, states where MoT is endemic (Igarashi et al., 1986; Igarashi, 1990; Picinini, and Fernandes, 1990) contributed respectively 41.4% and 53.6% of those exports. A consortium of livestock producers on the East Coast of the U.S. imported 126,000 and 268,000 t of Brazilian wheat during those two years (USDA FAS, 2013). Therefore, a physical transportation pathway by which MoT-contaminated wheat kernels could gain entry and be released into an agro-ecosystem in the U.S. existed. Hence, two quantitative pathway analysis models, P BR-US and P BR-NC, were used to estimate the risk of MoT entry and establishment in the U.S. via the importation of wheat grain from Brazil. Entry refers to the movement of South American MoT strains into the U.S. and establishment refers to the probability of MoT becoming a resident species in the agroecosystem studied. The two models are similar in structure and complementary in function, but differ by two parameters and in the levels of spatial resolution. We have concluded that if the U.S. continues to import wheat grain from Brazil on a regular basis, and if the risk of wheat blast disease development in areas such as Paraná and Rio Grande do Sul is considered, the result is an associated risk for the U.S. Outputs from both models predicted that MoT entry into the U.S. through the identified pathway, and establishments in U.S. agro-ecosystems, are probable. Model P BR-US predicted that there is a risk of MoT establishment in the coterminous U.S. within a range of years with an average of approximately 29 years. Model P BR-NC predicted that there is a risk of MoT establishment in a North Carolina ground transportation corridor within a range of 1-71 years with an average of approximately 8 years. Pathway model P BR-US was constructed to predict MoT establishment assuming an equally spatial risk of spillage in any wheat production area in the U.S. after entry. This approach identified potential areas suitable for MoT establishment at the national level. However, since establishment, spread, and outbreaks are only relevant if MoT entry to the U.S. occurs, a higher level of resolution to the entry stage was warranted (model P BR-NC ). Model P BR-NC used a risk corridor based on an existing entry location and a road transportation network from the port of entry to destination feed mills. The risk corridor approach is unique in the sense that it includes specific areas based on transportation pathways where pathogen, host, and environment 62
76 conducive to MoT and wheat blast development are likely to coincide. The risk corridor approach provides the opportunity to approximate locations where MoT introductions may have already occurred. Based on available trade data, it is likely that MoT infected/infested kernels have been imported into the U.S. through the port of Wilmington, North Carolina. Based on industry norms for ground transportation of grains, kernels were likely spilled-off trucks into environments favorable for MoT establishment during transport to feed mills. Wheat production fields were located within the transportation corridor that was delimited by the estimated MoT spore dispersal distance (Urashima et al., 2007). This corridor approach could complement traditional pest pathway analysis and be useful for designing future surveillance systems in general and MoT surveillance systems in particular. Moreover, it could be of benefit for phytosanitary or forensic purposes (Fletcher et al., 2006; Kahn, 1991), to help identify areas with imminent risk of MoT establishment. To our knowledge, this is the first time that a corridor approach has been applied for a plant pathogen pathway risk assessment. Testing wheat kernel shipments for the presence of MoT, as infected or infested seed or infested debris at harvest and before shipment, might reduce the risk of pathogen introduction into non-endemic countries. This could be an adequate strategy; however, logistics at the country of origin are always a challenge. In the absence of this strategy, models P BR-US and P BR-NC can help in the identification of stages where management will also be effective. For each pathway model, a sensitivity analysis was performed in order to identify important risk parameters associated with MoT establishment. Knowing these key parameters could help decision makers identify where changes could be implemented to reduce the risk of MoT establishment. Number of infected/infested kernels spilled in or near field where wheat blast would occur was the most influential input model parameter for determining if at least one MoT establishment would occur in the U.S. or North Carolina. Spillage could provide an opportunity for the establishment of plant pathogens (Australina Quarantine & Inspection Service, 1999). Knowing that spillage can occur during all stages of handling and transport (USDA GIPSA, 2010), special attention should be given to the mode of transport (sealed or open truck), and the condition and tightness of the transport vehicle when hauling imported feed grains (e.g. use of tarpaulin cover). The risk posed by dust produced during the loading and unloading of imported grain (Evans, 1996) is currently 63
77 unknown. An assessment of dust discharge effects would be important to determine optimal surveillance, containment, and eradication strategies. The expression of risk in a pathway risk analysis must be based on evidence, which must be distinguished from uncertainty (Griffin, 2012). Certain stages in models P BR-US and P BR-NC included various levels of uncertainty. Uncertainty is inherent in any risk analysis process and can occur at any step; insufficient information, large variability, and imprecision are three factors that can contribute to uncertainty (Griffin, 2012; Wintle and Cleeland, 2012). Uncertainty in the entry and establishment stages was due to limited data sets and the lack of detailed information regarding important biological, ecological, and epidemiological processes in the MoT pathosystem. Uncertainty associated with key input parameters (i.e. quantities internal to the model) could be reduced through improved knowledge. As a result, these parameters should be prioritized for additional data collection and research. The models used to calculate the climate suitability for MoT establishment in the U.S. and North Carolina (BG US *IH US *OG US, and BG NC *IH NC *OG NC ) are based on the assumption that weather parameters that influence the development of the pathogen are independent. We believe that weather parameters influence MoT inoculum build-up, infection during heading, and winter survival. For example, in any given year, the probability of overwintering survival might be high, but that will only influence disease development if climatic conditions are optimal for inoculum build-up and disease development during heading. However, a true test of independence will only be possible with increase understanding of the biology and epidemiology of the wheat blast pathosystem. The gridded weather dataset NCEP CFSR that NAPPFAST used for modeling wheat blast outbreaks in Brazil has a low spatial resolution (38km). However, it has several advantages including the availability of data in regions with no weather data collection, and interpolation of missing observations (reanalysis). These processes are computed on models that are imperfect and therefore the datasets may contain errors (Saha et al., 2006). Equally important, the NAPPFAST system currently has limited infection-modeling capabilities and relatively low spatial and temporal resolutions (Magarey et al., 2007). For instance, the generic infection model 64
78 template of NAPPFAST uses daily data and does not include a sporulation function. The major limitation of using daily data as opposed to hourly or sub-hourly data is that infection processes occur over a smaller temporal scale than a day (Magarey et al., 2007). Daily average temperature, rainfall, and relative humidity may roughly describe climatological conditions; however, they are not sufficient to describe the infection process for many pathogens. Mean daily data do not capture the variability of these conditions throughout the day. For example, interruption to wetness is an important parameter for estimating infection. In this case, daily data will not be enough to examine the influence of the duration and timing of those interruptions. There is a need for more advanced MoT infection model capabilities. The sporadic nature of wheat blast epidemics in Brazil, Bolivia, and Paraguay suggests that pathogen and disease development may be limited to very narrow ranges in weather parameters. Weather conditions during the early part of the growing season, heading and grain-fill may be important for inoculum build up, infection and disease development. A simulation model for predicting infection periods and damage potential is required for more accurate risk predictions. Damage potential could be calculated based on host susceptibility, rate of infection, infection period, and pathogen population parameters. On the other hand, survival and establishment of exotic species depend upon many factors at the new habitat (National Research Council, 2002; Theoharides and Dukes, 2007). When an organism is released at a geographic location, not only abiotic but also biotic barriers exist to population growth and establishment (Theoharides and Dukes, 2007). In this study we did not parameterize important evolutionary factors associated with MoT establishment. Evolutionary processes such as size of founder population, genetic diversity, genetic bottlenecks, and competitive ability are some of the factors that were not included in our models. Invasion biologists proposed the Tens Rule as a generalized estimate for biological invasions into new environments in the absence of specific information (Williamson and Fitter, 1996). We adapted the tens rule concept to account for the absence of specific information regarding an individual species (MoT); the Tens Rule was applied to generate estimates for parameters in models P BR- US and P BR-NC and thus to derive probabilities for the invasion of MoT into the coterminous U.S. and into the North Carolina corridor. There is a propensity for introduced organisms to go to extinction as a function of initial population size (National Research Council, 2002); therefore, it 65
79 will be important to estimate thresholds for initial population size of MoT infected/infested wheat kernels arriving to the U.S. that could present an imminent risk. Using U.S. wheat import data, 80% of the simulations indicated that no infected/infested kernels entered the U.S. between 2010 and 2011; 15% of the simulations indicated that between 1 and 31.3 billion (approximately 1,724 t) infected/infested kernels entered the U.S. (Figure 2-8). The high proportion of simulations with zero infected/infested kernels could be explained by the sporadic nature of wheat blast outbreaks in Brazil. However, when outbreaks occur, billions of infected kernels could potentially be exported. As a possible preventative measure, Plant Protection and Quarantine officials could set tolerance levels to minimize the risk associated with imported MoT infected/infested kernels. If the number of imported infected/infested units falls below a known threshold, it could be assumed that the risk is negligible (Kahn, 1991). Unfortunately, no threshold exists, and the inflection and maximum points where a higher probability of MoT establishment occurs are also unknown. Research needs to be done in order to determine the relationship between the number of MoT infected/infested kernels and the probability of MoT establishment in new areas. Statistically derived sampling protocols are also needed in order to determine if detections represent a small or large number of infected/infested kernels, below or above a previously established threshold. Figure 2-19 illustrates the importance of determining a threshold value. In addition, important ecological and climatic processes that could affect MoT and the epidemiology of wheat blast are not known. The influence of frost on the survival of MoT is one example. As MoT in Brazil is not subject to extreme low temperatures as it could be in some regions of the U.S., we selected MoL, a phylogenetic relative of MoT (Farman, 2002; Tosa et al, 2004; Viji et al., 2001) as a surrogate to derive estimates for the overwintering parameter in models OG US and OG NC. In the U.S., the MoL pathotype that causes gray leaf spot on perennial ryegrass is well established but freezing temperatures limit its survival (Harmon and Latin, 2003; Harmon and Latin, 2005). We have assumed that MoT populations could be limited by overwinter survival in the U.S. similar to its close relative MoL (Harmon and Latin, 2005). We designated MoL as an acceptable but not a perfect surrogate. For this reason, caution should be taken due to the lack of direct MoT data to prove cause and effect with respect to sensitivity to freezing temperatures. Wheat blast disease develops in Rio Grande do Sul, but never gets to 66
80 outbreak levels. The reasons behind this phenomenon as well as the effects of low temperatures and freeze-thaw cycles on MoT survival need to be determined. Figure A logistic distribution of hypothetical thresholds for the probability of Magnaporthe oryzae (Triticum pathotype) (MoT) establishment. Threshold values need to be determined for the number of infected/infested kernels necessary for MoT establishment at a probability greater than zero (x), a probability of 0.5 (y), the inflection point, and a probability of 1.0 (z), the maximum. It is not known where on this curve the 31.3 billion imported kernels infected/infested with MoT would lie. 67
81 Currently there is a lack of detailed scientific evidence describing wheat blast outbreak patterns in Brazil. Consensus opinion is that outbreaks occur with higher frequency at latitudes less than 24 S due to the reduced occurrence of frost in those areas. Our results suggest that there is a transition between frost and no frost areas in Paraná; however, this transition is neither uniform nor parallel to latitude 24 S (Appendix D). In order to corroborate these findings, it will be important to analyze climatic data and to monitor pathogen populations in areas such as Paraná and Rio Grande do Sul. Studies need to be conducted to determine if low temperature tolerance varies among MoT populations from northern Paraná, southern Paraná, and Rio Grande do Sul. Another basic aspect of wheat blast epidemiology that needs to be determined is the dynamics of MoT inoculum build-up that support widespread epidemics. The most visible symptom in the field seems to be restricted to head blast (Igarashi, 1990). Questions remain as to the source of the spore inoculum required for the almost synchronous infection of wheat heads in entire fields. Proposed sources of spore inoculum include infected seeds/kernels, crop residue, and secondary hosts (Bruno and Urashima, 2001; Goulart and Paiva, 1990; Prabhu, 1992). Our pathway analyses using P BR-US and P BR-NC models were limited to winter wheat as a host in the U.S., and assumed that all winter wheat cultivars were susceptible to MoT pathogens. However, studies have shown that among winter wheat cultivars, wheat blast severity values fall into a continuum from highly resistant to highly susceptible (Cruz et al., 2012). More refined models need to consider a greater host range and include proportions of identified vulnerabilities among hosts. Natural plant populations/species in addition to wheat should also be included as potential hosts. The validation of a scientific theory is subject to philosophical debate (Beck et al., 1997; Bredehoeft and Konikow, 1993; Saltelli et al., 2000). Demonstrating the scientific validity of risk assessments is a big challenge (Beck et al, 1997; Yang, 2003). The problems with model validation are complex (Beck et al., 1997) and lack of validation in risk assessments has been subject to strong criticism in the past (Yang, 2003). Several authors have argued that perhaps the use of the word validation is incorrect (Beck et al., 1997; Bredehoeft and Konikow, 1993; Saltelli et al., 2000), and that the use of this term has been used too loose in the past (McCombie and McKinley, 1993; Saltelli et al., 2000). Validation, in the strict sense of matching a set of 68
82 observed data with model performance, is difficult due to the complexity of risk assessment models (Beck and Chen, 2000). Different approaches have been proposed to assure the quality of models (Beck and Chen, 2000; Vose, 2008). To assess the quality and predictive capabilities of models P BR-US and P BR-NC, various methods were used (Vose, 2008). Spreadsheets were checked for syntax, mechanical, logical, application, and administrative errors (Vose, 2008). Models were also subject to internal auditing. Model behavior was assessed through running random scenarios, compared with known answers (i.e. setting rates to zero), stressing parameter values (i.e. setting parameter values to extreme), and analyzing outputs (Vose, 2008). In conclusion, wheat blast stakeholders should objectively assess the information provided in these pathway analyses. It is important to remember that information can be intentionally or unintentionally misrepresented (Wintle and Cleeland, 2012). Even though there is considerable evidence that indicate a significant risk for MoT establishment in winter wheat production areas, in approximately 60% of the winter wheat production areas in the coterminous U.S. the risk of MoT establishment is zero. With the threshold levels selected we concluded that the climate is adequate for maintaining MoT populations in some areas of the U.S. but not suitable to support outbreaks in most of the country. With respect to winter wheat growing areas in the U.S., conditions for MoT establishment and wheat blast outbreak occur only in small, restricted geographic areas. In about 55% of the North Carolina corridor, conditions for MoT establishment exist seven out of ten years. With our corridor approach, we cannot conclude that MoT populations from South America are already resident in the U.S. although the probability exists that introductions in 2010 and 2011 have occurred. However, the corridor approach taken in this study can offer a strategy for establishing a sentinel plot network or executing a targeted surveillance system to support forward and backward epidemiological analyses. In spite of all the limitations, these two quantitative pathway analyses should be of value to the development of more advanced models in the future and to preliminary considerations of phytosanitary options to minimize the risk of MoT spread beyond South America. The results from this study will open avenues for future surveillance and research endeavors. The accuracy and predictive ability of models P BR-US and P BR-NC should be improved and the uncertainty associated with specific parameters reduced as we gain a more complete understanding of the biology of the pathogen and the epidemiology of the disease that it causes. 69
83 References Alves, K., and Fernandes, J Influência da Temperatura e da Umidade Relativa do Ar na Esporulação de Magnaporthe grisea em Trigo. Fitopatologia Brasileira 31: Amerah, A., Péron, A., Zaefarian, F., and Ravindran, V Influence of whole wheat inclusion and a blend of essential oils on the performance, nutrient utilisation, digestive tract development and ileal microbiota profile of broiler chickens. British Poultry Science 52: Anderson, A., Henry, B., and Tullis, E Factors affecting infectivity, spread and persistence of Pyricularia oryzae Cav. Phytopathology 37: Anonymous. 2012a. Preserving and Protecting Freight Infrastructure and Routes. National Cooperative Freight Research Program (NCFRP)Report 16. Online at Anonymous. 2012b. The Transportation of Grain. National Cooperative Freight Research Program (NCFRP)Report 16. Online at Anonymous. 2012c. Railroads and Grain. Association of American Railroads Policy and Economics Department. Available online at Antunes da Cruz, M Caracterização do padrão molecular e de virulência de isolados de Pyricularia grisea do trigo. Disertacão. Universidade de Passo Fundo. Aono M, Seiji W, Masato N, Nobuyoshi N, Masanori T, et al. (2006) Detection of feral transgenic oilseed rape with multiple-herbicide resistance in Japan. Environmental Biosafety Research 5: Beck, M. Ravetz, J., Mulkey, L., ans Barnwell, T On the problem of model validation for predictive exposure assessments. Stochastic Hydrol. Hydraulics, 11: Beck, M., and Chen, J Assuring the Quality of Models Designed for Predictive Tasks. In: Saltelli, A., K. Chan, and E.M. Scott Sensitivity Analysis. John Wiley and Sons, Ltd.: West Sussex, England Bem Paraná Online Blair, R. and Paulson, S Wheat as a Replacement for Corn in Pultry diets. Poultry Factsheet No The University of British Columbia Faculty of Agricultural Sciences Department of Animal Science Boratynsky, T Karnal Bunt infection rates in Mexican rail cars. 70
84 Borchert, D. Magarey, R., and Chaneli, C A Guide to the Use of NAPPFAST. USDA- APHIS-PPQ-CPHST-PERAL, Raleigh, North Carolina. Braiser, C The biosecurity threat to the UK and global environment from international trade in plants. Plant Pathology 57: Bredehoeft, J., and Konikow, L Ground-water models: validate or invalidate. Ground Water, 31: Chang, K., Introduction to Geographic Information Systems 2 nd Edition. McGraw-Hill, New York, USA. Companhia Nacional de Abastecimento CONAB. 2010a. Acompanhamento da Safra Brasileira: Graõs Safra 2009/2010 Quarto Levantamento. Online: Companhia Nacional de Abastecimento CONAB. 2010b. TRIGO BRASIL: Série Histórica de Produtividade Safras 1976/77 a 2010/11. Online: t..xls). Crawley MJ, Brown SL (1995) Seed limitation and the dynamics of feral oilseed rape on the M25 motorway. Proceedings of the Royal Society of London Series B-Biological Sciences 259: Crawley, M., and Brown, S Spatially structured population dynamics in feral oilseed rape. Prceedings of the Royal Society of London Series B: Biological Sciences 271: Cruz, C., Bockus, W., Stack, J., Tang, X., Valent, B., Pedley, K., and Peterson, G Preliminary assessment of resistance among U.S. wheat cultivars to the Triticum pathotype of Magnaporthe oryzae. Plant Dis. 96: de Andrade Cardoso C., Reis E., and Moreira, E Development of a warning system for wheat blast caused by Pyricularia grisea. Summa Phytopathol. 34: Desai, B Seeds Handbook: Biology, Production, Processing, and Storage. 2 nd ed. Marcel Dekker Ltd., New York, USA. Devorshak, C Uncertainty in Pest Risk Analysis. In: Plant Pest Risk Analysis: Concepts and Applications. Ed.: Devorshak, C. CAB International, Oxford, UK EFSA Panel on Plant Health (PLH) Scientific opinion on a quantitative pathway analysis of the likelihood of Tilletia indica M. introduction into EU with importation of US wheat. EFSA Journal 8(6):1621. doi: /j.efsa Available online: Elmer, W Seeds as vehicles for pathogen importation. Biological Invasions 3:
85 Empresa Brasileria de Pesquisa Agropecuaria EMBRAPA Chuvas Excessivas no Paraná Prejudicam as Lavouras de Trigo. Online: Evans, G., Clark, A., Love, J., Cannon, R. and McLean, G Quarantine risk associated with the importation of bulk grain: a retrospective analysis. Bureau of Resource Sciences: Canberra. Fletcher, J., Bender, C., Budowle, B., Cobb, W., Gold, S., Ishimaru, C., Luster, D., Melcher, U., Murch, R., Scherm, H., Seem, R., Sherwood, J., Sobral, B., and Tolin, S Microbiology and Molecular Biology Reviews, 70(2); doi: /mmbr Fernandes, M., Medeiros, M., Jacobsen, C., Lima, N., and Rossetto, E Qualidade sanitária de sementes de trigo (Triticum aestivum) no Estado de Rio Grande do Sul: safras 2004 e R. Bras. Agrociência 14: Fernandes, J., Torres, G., Santana, F., So E Silva, M Head Blighters And Blasters Of Wheat: Are We Ready? In: National Fusarium Head Blight Forum, 2009, Orlando. Proceeedings... Lexington: University Of Kentucky, Session 2: Fhb Management, P Fowler, G., and Takeuchi, Y Mapping, Climate and Geographic Information for Risk Analysis. In: Plant Pest Risk Analysis: Concepts and Applications. Ed.: Devorshak, C. CAB International, Oxford, UK Gamliel, A., Gullino, M., and Stack, J Crop Biosecurity: global, national, regional, and global perspectives. Pages In: Crop Biosecurity: assuring our global food supply. Eds: Gullino M.L., Fletcher J., Gamliel A., Stack P.J. Springer, The Netherlands. 148 pp Goulart, A Incidence of Pyricularia grisea on wheat seeds and its control with fungicides. Informativo ABRATES, Londrina 10(1-3):25-30 Goulart, A., and Paiva, F Transmissão de Pyricularia oryzae através de sementes de trigo (Triticum aestivum L.). Fitopatol. bras. 15: Goulart, A., and Paiva, F Sobrevivência de Pyricularia Oryzae Cav. em sementes de trigo (Triticum Aestivum L.) armazenadas em diferentes ambientes. Revista Brasileira de Sementes 15: Goulart, A., Paiva, F., and Andrade, P Relação entre a incidência da brusone em espigas de trigo e a presença de Pyricularia grisea nas sementes colhidas. Fitopatologia Brasileira, 20: Great Export Import Wilmington Bulk LLC. Online 72
86 Griffin, R Uncertainty in Pest Risk Analysis. In: Plant Pest Risk Analysis: Concepts and Applications. Ed.: Devorshak, C. CAB International, Oxford, UK Harmon, P., and Latin, R Gray leaf spot of perennial ryegrass. Online. Plant Health Progress doi: /php dg. Harmon, P., and Latin, R Winter survival of the perennial ryegrass pathogen Magnaporthe oryzae in north central Indiana. Plant Dis. 89: Harris, K., and Lindblad, C Postharvest Grain Loss Assessment Methods: A Manual of Methods for the Evaluation of Postharvest losses. American Association of Cereal Chemists, St. Paul, Minnesota, 193 pp. Hall, R., and Nleya, T Winter and Spring Wheat Growing Stages. In: igrow Wheat Best Management Practices for Wheat Production. Clay, D., Carlson, C., and Dalsted, K. (Eds). South Dakota State University, Brookings, SD. Igarashi, S Brusone no trigo- histórico e distribuição geográfica no Paraná. In: Reunião nacional de pesquisa de trigo, 15. Embrapa, Passo Fundo. Resumos pp Igarashi, S Update on wheat blast (Pyricularia oryzae) in Brazil. Pages In: Proc. Int. Conf.-Wheat Nontraditional Warm Areas. D. Saunders, ed. Mexico, D.F. Igarashi, S., Utimada, C., Igarashi, L., Kazuma, A., and Lopes, R Pyricularia sp. em trigo. I. Ocorrência de Pyricularia sp. no Estado do Paranà. Fitopatol. Bras. 11: International Plant Protection Convention ISPM No. 11: Pest risk analysis for quarantine pests including analysis of environmental risks and living modified organisms. International standards for phytosanitary measures. Online. Available at [Accessed on March, 2010]. International Plant Protection Convention International Standards For Phytosanitary Measures ISPM No. 2 Framework For Pest Risk Analysis. Secretariat of the International Plant Protection Convention (IPPC), Food and Agriculture Organization of the United Nations, Rome. Instituto Agronômico do Paraná IAPAR Excesso Causa Perdas Na Safra de Trigo: Nota técnica. Available from: Kahn, R Exclusion ad a Plant Disease Control Strategy. Annu. Rev. Phytopathol, 29: Knispel A., and McLachlan, S Landscape-scale distribution and persistence of genetically modified oilseed rape (Brassica napus) in Manitoba, Canada. Environmental Science and Pollution Research 17:
87 Kochhann, R Fertilizer Requirements and Management Issues for Acid Soils in Nonirrigated Areas. In: Wheat production constraints in tropical environments. Ed: Klatt, A. Mexico, D.F. 410 pp Koo, W., and Kennedy, P International Trade and Agriculture. Blackwell Publishing, Malden, MA. Landschoot, P., and Hoyland, B Gray leaf spot of perennial ryegrass turf in Pennsylvania. Plant Dis. 76: Large, E. C Growth stages in cereals illustration of the feekes scale. Plant Pathology 3(4): doi: /j tb00716.x Latin, R., and Harmon, P Managing gray leaf spot in the Midwest. Golf Course Management 72:10: Lockwood, J., Cassey, P., and Blackburn, T The role of propagule pressure in explaining species invasions. Trends in Ecology and Evolution 20: Luce, W. G., Feeding wheat to hogs. Oklahoma Cooperative Extension Service, ANSI MacCombie, C., and McKinley, I Validation Another Perspective. Ground Water 31: Magarey, R.D. and Sutton, T.B How to create and deploy infection models for plant pathogens. In: A. Ciancio and K. G. Mukerji (Eds). Integrated management of plant pests and diseases. Vol: I General concepts in integrated pest and disease management. Springer, NY. Magarey, R., Fowler, G., Borchert, D., Sutton, T., Colunga-Garcia, M., and Simpson, J NAPPFAST: An Internet System for the Weather-Based Mapping of Plant Pathogens. Plant Disease 91: Magarey, R., Borchert, D., Engle, J., Colunga-Garcia, M., Koch, F., and Yemshanov, D Risk maps for targeting exotic plant pest detection programs in the United States. OEPP/EPPO Bulletin 41, Magarey, R., Sutton, T., and Thayer, C A simple generic infection model for foliar fungal plant pathogens. Phytopathology 95: MAPA (Ministerio da Agricultura, Pecuaria e Abastecimento). 2009a. Aviso de Leilão de Prêmio para o Escoamento de Trigo em Grãos PEP No. 001/09. Online MAPA (Ministerio da Agricultura, Pecuaria e Abastecimento ). 2009b. Aviso de Leilão de Prêmio para o Escoamento de Trigo em Grãos PEP No. 007/09. Online 74
88 MAPA (Ministerio da Agricultura, Pecuaria e Abastecimento ). 2009c. Aviso de Leilão de Prêmio para o Escoamento de Trigo em Grãos PEP No. 011/09. Online MAPA (Ministerio da Agricultura, Pecuaria e Abastecimento ). 2009d. Aviso de Leilão de Prêmio para o Escoamento de Trigo em Grãos PEP No. 232/09. Online MAPA (Ministerio da Agricultura, Pecuaria e Abastecimento ). 2009e. Aviso de Leilão de Prêmio para o Escoamento de Trigo em Grãos PEP No. 347/09. Online MAPA (Ministerio da Agricultura, Pecuaria e Abastecimento ). 2010a. Aviso de Leilão de Prêmio para o Escoamento de Trigo em Grãos PEP No. 001/10. Online MAPA (Ministerio da Agricultura, Pecuaria e Abastecimento ). 2010b. Aviso de Leilão de Prêmio para o Escoamento de Trigo em Grãos PEP No. 002/10. Online MAPA (Ministerio da Agricultura, Pecuaria e Abastecimento ). 2010c. Aviso de Leilão de Prêmio para o Escoamento de Trigo em Grãos PEP No. 373/10. Online McMichael, A., Campbell-Lendrum, D., Corvalán, C., Ebi, K., Githeko, A., Scheraga, J., Woodward, A Climate change and human health risk and responses. World Health Organization. Geneva, Switzerland. Moss, M., and Trevathan, L Environmental Conditions Conducive to Infection of Ryegrass by Pyricularia grisea. Phytopathology 77: National Research Council Science and Judgment in Risk Assessment. National Academy Press. Washington, D.C. National Research Council Predicting invasions of nonindigenous plants and plant pests. National Academy Press. Washington, D.C. National Research Council, Science and Decisions: Advancing Risk Assessment. The National Academies Press. Washington, D.C. NCDC NOAA (National Climatic Data Center / National Oceanic and Atmospheric Administration Last 32-Degree F Temperature in Spring. Accessed May 15, Available online at lay North Carolina Department of Agriculture & Consumer Services. Accessed January 1, Available online at Palisade Corporation Risk Analysis and Simulation Add-In for Microsoft Excel. Palisade Corporation, Ithaca, NY. Paulsen, G Growth and Development. In: Wheat Production Handbook. Publication C Kansas State Univ. Coop. Ext. Serv., Manhattan, KS. 75
89 Pedersen, D. K., Kane, R. T., Wilkinson, H. T First report of gray leaf spot caused by Pyricularia grisea on Lolium perenne in Illinois. Plant Dis. 84:1151. Picinini, E., and Fernandes, J Ocorrência da brusone (Pyricularia oryzae) em lavouras comerciais de trigo (Triticum aestuvum) no Estado do Rio Grande do Sul. Fitopatol. Bras. 15: Piggott, N Agricultural Economic and Policy Outlook. Presentation to: 8 th Annual Ag Development Forum. Governor Holshouer Building, Raleigh. Pivard, S., Adamczyk, K., Lecomte. J., Lavigne, C., Bouvier, A., et al Where do the feral oilseed rape populations come from? A large-scale study of their possible origin in a farmland area. Journal of Applied Ecology 45: Pontes, M Giberela ou brusone? Orientações para a identificação correta dessas enfermidades em trigo e em cevada. Embrapa Trigo Documentos online Promar International Southeast US Feedstuff Imports: Causal Factors and Recommended Response. Prepared for American Farm Bureau Federation, American Soybean Association, National Corn Growers Association, United Soybean Board. Available online at Rafoss, T Spatial Stochastic Simulation Offers Potential as a Quantitative Method for Pest Risk Analysis. Risk Analysis 23:4: Reed, M Technical Barriers to Trade. Pages In International Trade in Agricultural Products. Prentice Hall. Upper Saddle River, New Jersey. Rose, S The use of whole wheat in poultry diets. World s Poultry Science Journal 52:59-60 Royer, T. (Ed.) Pest Management Strategic Plan for Winter Wheat in the Southern Great Plains. USD Grazinglands Research Center, El Reno, Oklahoma. Saha, S., Nadiga, S., Thiaw, C., Wang, J., Wang, W., Zhang, Q., Van Den Dool, H., Pan, H.-L., Moorthi, S., Behringer, D., Stokes, D., Peña, M., Lord, S., White, G., Ebisuzaki, W., Peng, P., and Xie, P The NCEP Climate Forecast System. J. Climate 19: Saji H, Nobuyoshi N, Mitsuko A, Masanori T, Akihiro K, et al. (2005) Monitoring the escape of transgenic oilseed rape around Japanese ports and roadsides. Environmental Biosafety Research 4: Saltelli, A., K. Chan, and E.M. Scott Sensitivity Analysis. John Wiley and Sons, Ltd.: West Sussex, England. 76
90 Schumann, G., and Jackson, N First Report of Gray Leaf Spot (Pyricularia grisea) on Perennial Ryegrass (Lolium perenne) in New England. Plant Dis. 83:11:1,073.2 Secretaria de Estado de Agricultura, Pecuária e Abastecimento de Minas Gerais SEAPA Conab Confirma Sinais de Queda na Area de Trigo. In: Informativo COMTRIGO No Online: 124% pdf Stack, J Challenges to crop biosecurity. Page In: Crop Biosecurity: assuring our global food supply. Eds: Gullino M.L., Fletcher J., Gamliel A., Stack P.J. Springer, The Netherlands. 148 pp Sullivan, Z., Honeyman, M., Gibson, L., McGuire, J., and Nelson, M Feeding Small Grains to Swine. Iowa State University University Extension. Online: Sutherst, R., Maywald, G., Kriticos, D Climex User s Guide Version 3. CSIRO, Melbourne, Australia. Tamis, W., and de Jong, T Transport chains and seed spillage of potential GM crops with wild relatives in the Netherlands. COGEM report: CGM , Online: Theoharides, K., and Dukes, J Plant invasion across space and time: factors affecting nonindigenous species success during four stages of invasion. New Phytologist 176: Torres, G., Santana, F., Fernandes, J., and Só e Silva, M Doenças da espiga causam perda de rendimento em trigo nos estados do Paraná, São Paulo e Mato Grosso do Sul, em Embrapa Trigo. Available online at: Uddin, W., Soika, M. D., Moorman, F. E., and Viji, G A serious outbreak of blast disease (gray leaf spot) of perennial ryegrass in golf course fairways in Pennsylvania. Plant Dis. 83:783. Urashima, A Blast. In: Compendium of wheat diseases and pests, third edition. Eds: Bockus, W., Bowden, R., Hunger, R., Morril, W., Murray, T., Smiley, R. APS Press, St. Paul, Minnesota Urashima, A., Leite, S., and Galbieri, R Eficiencia da disseminacão aérea em Pyricularia grisea. Summa Phytopathologica 33: USDA (United States Department of Agriculture) Field Crops Usual Planting and Harvesting Dates. Agricultural Handbook Number
91 USDA (United States Department of Agriculture) Transportation of U.S. Grains A Modal Share Analysis Available online at zoom=auto,0,800 USDA (United States Department of Agriculture) United States: Winter Wheat. Online at Accessed on May 21, 2013 USDA APHIS (United States Department of Agriculture Animal and Plant Health Inspection Service) Quantitative pathway analysis: likelihood of karnal bunt, (Tilletia indica M.), introduction as a result of the importation of United States wheat for Grain into the European Union and Desert durum wheat for grain into Italy. United States Department of Agriculture- Animal and Plant Health Inspection Service, 105 pp. USDA APHIS PPQ (United States Department of Agriculture Animal and Plant Health Inspection Service Plant Protection and Quarantine). 2012a. Seeds Not for Planting. Online: _planting.pdf USDA APHIS PPQ (United States Department of Agriculture Animal and Plant Health Inspection Service Plant Protection and Quarantine). 2012b. Treatment Manual. Online: USDA FAS (United States Department of Agriculture Foreign and Agricultural Service) Brazilian Grain and Feed Annual Report BR Online. Accessed January 01, USDA FAS (United States Department of Agriculture Foreign and Agricultural Service) Brazilian Grain and Feed Annual Report BR Online. Accessed January 01, USDA FAS (United States Department of Agriculture Foreign and Agricultural Service). Accessed January 01, USDA GIPSA (Grain Inspection, Packers & Stockyards Administration) Weighing Handbook. Online, available at [Accessed on June, 2013]. USDA NASS (United States Department of Agriculture National Agricultural Statistics Service). Accessed November 15, USDA NASS (United States Department of Agriculture National Agricultural Statistics Service). Accesses February 12,
92 von der Lippe M, Kowarik I (2007) Crop seed spillage along roads: a factor of uncertainty in the containment of GMO. Ecography 30: Vose, D Risk Analysis: A Quantitative Guide, 3rd Edition. West Sussex, England: John Wiley & Sons, Ltd. Wang, Y., Li, J., Liu, Y., Jin, C., Liu, J., Jia, B., Zhao, W., Pan, H., and Zhang, S Effects of extreme low temperature on the biological and biochemical activities of Magnaporthe oryzae. Acta Phytopathologica Sinica 42(3): Williamson, M Invaders, weeds and the risk from genetically modified organisms. Experientia 49: Williamson, M., and Brown, C The analysis and modeling of British invasions. Philosophical Transactions of the Royal Society B314: Williamson, M., and Fitter, A The varying success of invaders. Ecology 77: Wintle, B., and Cleeland, B Interpreting risk in international trade. Journal of Risk Research. 15: Wong, F Gray leaf spot in the West: A new disease of perennial ryegrass and kikuyugrass has become established in California and Nevada. Golf Course Management 74(5): Yang, X Risk assessment: concepts, development and future opportunities. Plant Health Progress. Online Yoshimura, Y., Beckie, H., and Matsuo, K Transgenic oilseed rape along transportation routes and port of Vancouver in western Canada. Environmental Biosafety Research 5:
93 Chapter 3 - Preliminary Assessment of Resistance Among U.S. Wheat Cultivars to the Triticum Pathotype of Magnaporthe oryzae Abstract Magnaporthe oryzae is the causal agent of blast disease on several graminaceous plants. The M. oryzae population causing wheat blast has not been officially reported outside South America. Wheat production in the United States is at risk to this pathogen if it is introduced and established. Proactive testing of U.S. wheat cultivars for their reaction to blast and identification of resistance resources is crucial due to the national and global importance of the U.S. wheat industry. In this preliminary study, the phenotypic reaction of 85 U.S. wheat cultivars to M. oryzae (Triticum pathotype) was determined. Although there was a significant correlation in the reaction to blast at the seedling and adult plant stages, only 57% of the head reaction was explained by the seedling reaction. Because of the importance of disease development at the head stage in the field, assessment of all 85 cultivars occurred at the head stage. Among cultivars tested, a continuum in severity to head blast was observed; cultivars Everest and Karl 92 were highly susceptible with more than 90% disease severity, while cultivars Postrock, JackPot, Overley, Jagalene, Jagger, and Santa Fe showed less than 3% infection. No evidence of the presence of physiological races among isolates T-7, T-12, T-22, and T-25 was found. Introduction Magnaporthe oryzae B.C. Couch & L.M. Kohn (anamorph, Pyricularia oryzae) is a fungal pathogen with a high degree of host specificity (5). It is the causal agent of blast disease on several graminaceous plants, including wheat (Triticum aestivum L.). Blast disease was reported for the first time on wheat in 1985 (14) in the Paraná State of Brazil, where it had caused severe damage to the local wheat cultivars. Although the disease occurs sporadically, it is now considered a major threat to wheat production in Brazil (19). Since its first report in Paraná, the disease has been detected in the important wheat-producing regions of the country (7,10,11,13,17). In 1996, it was reported for the first time in the Santa Cruz Department of Bolivia (2). In 2002, it was reported in the Itapúa and Alto Paraná Departments of Paraguay (24). Finally, in 2007, it was reported for the first time in the province of Formosa, northeastern Argentina (4). It has been suggested that wheat blast populations possess a high degree of 80
94 variation among isolates (22,23). Sexual and/or parasexual recombination may be responsible for the genetic variation observed in this pathogen (3,20). The Triticum pathotype of M. oryzae can reduce both yield and quality (8,19). Grains from blast-infected heads from highly susceptible cultivars are usually small, wrinkled, deformed, and have low-test weight (8). The highest yield losses occur when head infections start during flowering or early grain formation (8). Reported yield losses in Brazil on susceptible cultivars vary from 10.5 up to 100% (10,12,15). An analogous head disease with similar symptoms, Fusarium head blight, has had similar impacts on wheat production in the United States (16). Wheat blast may have similar epidemiology to Fusarium head blight because it also affects the heads soon after emergence. Therefore, the search for genetic resistance to wheat blast in the United States is important. In South America, there has been an intense search for sources of resistance to wheat blast since it was discovered in Brazil (1,9,13,18,21,23). However, no sources of durable resistance have been found (23). Urashima et al. (23) tested 20 commercial wheat cultivars for resistance to 72 isolates of the Triticum pathotype of M. oryzae. Although BR18 had the best performance, no promising resistant cultivar was identified in their study. Prestes et al. (18) evaluated 100 Brazilian wheat genotypes for resistance to head blast. Eighteen genotypes among commercial cultivars and advanced breeding lines showed moderate resistance; however, no genotype with complete resistance was reported. Cruz et al. (6) tested 50 Brazilian commercial cultivars and 20 synthetic wheat genotypes from crosses between Triticum durum and Aegilops tauschii for resistance to 18 isolates of the Triticum pathotype of M. oryzae. In general, synthetic wheat genotypes showed less area affected at the adult plant stage and were considered promising sources of resistance to wheat blast. Since no resistant cultivars have been found within the local South American wheat population, where the disease has been particularly severe, cultivars grown in other areas and wild relative species should be tested to identify all possible sources of resistance. The availability of wheat cultivars with genetic resistance to M. oryzae would provide an advantage for U.S. wheat producers to strengthen preparedness in the event of a wheat blast outbreak. Phenotyping of U.S. cultivars for their reaction to wheat blast pathogens and identification of resistance resources is crucial due to the national and global importance of the U.S. wheat 81
95 industry. In this study, we provide a phenotypic characterization of 85 U.S. hard winter wheat cultivars for reaction to head blast. Materials and Methods Phenotyping of cultivars was performed in a biosecurity level-3 laboratory at the Biosecurity Research Institute (BRI) on the campus of Kansas State University in Manhattan. This laboratory is in a facility designed to provide a safe and secure location to study exotic and high-consequence pathogens. Biocontainment enhancements include individual security PIN code access control, hallway security cameras, interlocked anteroom doors, centralized shower out block, HEPA filtration of exhaust air, gastight dampers to isolate the laboratory, liquid effluent decontamination, and stand-by power generation. Two plant growth chambers (Conviron, Winnipeg, Canada) were used to provide precise control of temperature, photoperiod, and light intensity. USDA Animal and Plant Health Inspection Service inspected and approved the laboratory, and a permit (No. P526P ) was granted to work with M. oryzae in this facility. Wheat cultivars were grown and vernalized at the KSU Department of Plant Pathology facilities (outside of containment) and then transferred into containment prior to inoculation. Seeds were germinated in cm plastic tubes (Stuewe & Sons, Tangent, OR) and grown for 2 weeks in a greenhouse (25:15 C, day:night and 14:10 h, light:dark). The seedlings were vernalized during 8 weeks in a cold room (4 C and 9:15 h, light:dark) and then transplanted and grown in the greenhouse to the heading stage in 15- cm-diameter pots. They started producing heads approximately 6 to 7 weeks after transplanting. The monosporic Brazilian M. oryzae (Triticum pathotype) isolate T-25 was used for evaluating several hard winter wheat cultivars adapted to the Great Plains. Seiji Igarashi originally collected this isolate from the cultivar Tapejara at São Jorge do Ivaí, Paraná, in January Inoculum was produced from cultures grown on V8 agar (150 ml of V8 juice, 3 g of CaCO3, and 15 g of agar in 1 liter of deionized water) and incubated at 23 to 25 C under continuous fluorescent illumination (25 µmoles/m2/s). Five- to seven-day-old colonies were flooded with sterile deionized water containing 0.42% gelatin and 0.01% Tween 20 and gently scraped with a disposable inoculation loop to dislodge conidia from conidiophores. The spore 82
96 suspension was then filtered through two layers of cheesecloth and adjusted to conidia/ml in a solution of deionized water, gelatin, and Tween 20. Disease phenotyping consisted of eight completely randomized design experiments, with three replications (pots) per cultivar, 5 to 10 heads per replicate, and a maximum of 20 cultivars per experiment. The highly susceptible cultivar Everest served as a control in all experiments. Heads were tagged and sprayed (1.2 ml/head with spores/ml) within 3 days of full head emergence (beginning of anthesis) and then individually covered with a black, cm bag with a zipper closure (Uline, Coppell, TX). The bag had been moistened with water on the inside to maintain high humidity conditions. Bags were removed 48 h after inoculation, and plants remained inside the growth chamber until 14 days after inoculation when heads were rated for disease symptoms. For each wheat head, the number of diseased spikelets was determined and expressed as a percentage of the total number of spikelets on that head: disease = (number of diseased spikelets/total spikelets) 100. In order to comply with biocontainment regulations, infected plants were properly bagged and autoclaved prior to disposal. The reproducibility of disease phenotyping was evaluated in two independent experiments by comparing visual assessments of the percentage of wheat spikelets affected by blast. Twelve winter wheat cultivars (Jagalene, JackPot, Tomahawk, Postrock, Aspen, Santa Fe, Hitch, Fuller, TAM 107, Armour, Karl 92, and Everest) that showed a continuum of reaction to wheat blast isolate T-25 were used in each of these experiments. Disease phenotype assessments at the seedling stage were compared with disease phenotype assessments at the head stage on the same cultivars to determine any correlation between seedling and adult plant resistance. The 12 cultivars mentioned above, showing a continuum of reaction to isolate T-25, were used. Seedling disease phenotyping consisted of a randomized complete block design with four replications (blocks), conducted two times. Seedlings were grown in soil in flats in the greenhouse to the three-leaf stage and then moved to the biocontainment laboratory for inoculations. Seedlings in each flat were sprayed with 25 ml of a spore suspension ( spores/ml) and covered with a black 170-liter garbage bag to maintain high humidity. Bags were removed 48 h after inoculation. Seedlings remained inside the growth chamber in containment until 7 days after inoculation, when leaves were rated for disease symptoms. Disease ratings consisted of visual assessments of the percentage of the 83
97 second leaf affected by wheat blast, and mean severity scores were based upon the reaction of 10 plants per replication. Differences in pathogenicity among four Triticum isolates of M. oryzae (T-7, T-12, T-22, and T-25) were determined. Phenotypes obtained with the first three isolates were compared among themselves and with those obtained with isolate T-25. Evidence of the presence of physiological races among these isolates, as well as the level of statistical interaction between cultivars and isolates, were also considered. A standard set of differential cultivars has not been established for race identification of the Triticum pathotype of M. oryzae (23). However, a set of red winter wheat cultivars (Jagalene, Overley, Santa Fe, JackPot, Fuller, and Everest) that showed a continuum of reaction to blast isolate T-25 was used. All of these M. oryzae isolates were originally collected in 1988 in the Paraná State of Brazil from different wheat varieties (IAPAR 17, Anahuac, Anahuac, and Tapejara, respectively) and at different locations (Cianorte, Floresta, Pallaro Farm, and São Jorge de Ivaí, respectively). Data analysis The Pearson s correlation coefficient was used to measure the strength of association (reproducibility) between two independent wheat blast phenotyping experiments. The highly susceptible cultivar Everest, which was included as a susceptible control in all experiments, was analyzed alone in order to determine the consistency of its reaction over experiments. Analyses of variance of the percentage of wheat spikelets affected by wheat blast were determined using PROC GLM in SAS 9.2 (SAS Institute, Cary, NC, USA). Values used on head resistance, obtained from a set of 12 cultivars showing a continuum of reaction to wheat blast, were pooled from different experiments. The relation-ship between seedling resistance and head resistance was determined by linear regression using PROC REG in SAS 9.2. Results There was a highly significant positive correlation (P < ) between the two independent experiments aimed to determine the reproducibility of disease phenotyping on adult plants. The Pearson s correlation coefficient indicated that the strength of association between these experiments was very high (r = 0.96). About 93% of the reaction in experiment 2 was explained by the reaction in experiment 1 (Fig. 1). 84
98 Figure 3-1. Wheat blast severity values (percent affected spikelets) for 12 artificially infected cultivars from two independent experiments. Pearson's correlation between experiments was r=0.96, N=12, p< To quantify the variability due to random effects across experiments, cultivar Everest was used as a susceptible control in all experiments. Analyzed alone, Everest was not significantly different (P > 0.05) for wheat blast infection in any of the phenotyping experiments; therefore, disease severity data were pooled accordingly across experiments. To date, a total of 85 cultivars have been tested for susceptibility to wheat blast at least one time, but many were tested more than once. Disease severity values fell into a continuum from highly susceptible to highly resistant cultivars to the single Brazilian isolate T-25 (Table 1). This continuum (Table 1) consisted of 80 cultivars with less than 75% disease severity and 5 cultivars with ratings greater than 75% disease severity. Among entries tested at least twice, cultivars Everest and Karl 92 were classified as highly susceptible with more than 90% disease severity, and cultivars Postrock, JackPot, Overley, Jagalene, Jagger, and Santa Fe were classified as resistant and showed less than 3% infection. 85
99 Table 3-1. Disease severity and resistance rating to wheat blast for 85 U.S. hard winter wheat cultivars. Plants were inoculated, held in a controlled environment chamber, and assessed after 14 days. a Percent spikelets affected by blast. No. Cultivar Disease severity a 1 RonL CO GA E Santa Fe Jagger Jagalene SY Gold Overland Overley Protection CL HV9W03-539R Jackpot Shocker CO KS05HW Postrock Danby CO Hawken NuDakota Greer CJ GA E WB-Stout OK Bullet CO Tiger Ripper
100 No. Cultivar Disease severity a 30 T Infinity CL GA E CO T Keota Truman R Endurance R Millenium WB-Cedar HV9W R Tomahawk R McGill TAM Fuller Robidoux HV9W03-696R Centerfield Camelot Heyne CO Settler CL TAM TAM T Triumph Aspen
101 No. Cultivar Disease severity a 62 CO T Hitch TAM Armour CO T Above CL Hondo CO CO Billings Duster Ike CO KS04WGRC Oakes BO KS Winterhawk Karl Wesley Everest There was a significant positive linear relationship (P < 0.05) between seedling and head resistance (Fig. 2). The estimated linear regression slope was 1.6% disease severity. The value for the coefficient of determination (R 2 ) indicates that seedling infection explained 57% of the variation in head infection. At the seedling stage, cultivars JackPot, Jagalene, Postrock, Santa Fe, Aspen, and TAM107 were placed in the resistant category; Tomahawk, Armour, Hitch, and Fuller were moderately resistant; and Karl 92 and Everest were moderately susceptible. At the head stage, cultivars JackPot, Jagalene, Postrock, and Santa Fe were placed into the resistant 88

102 category; Tomahawk and Fuller were moderately resistant; TAM107, Aspen, Hitch, and Armour were moderately susceptible; whereas cultivars Karl 92 and Everest were in the susceptible category with at least 95% disease severity. Six of the 12 cultivars were scored with the same disease phenotype on both seedling leaves and heads, while six showed variation. When comparing the disease phenotypes for isolates T-7, T-12, T-22, and T-25 on six cultivars, analysis of variance showed that there were significant (P < ) differences among cultivars, and among pathogen isolates (P < 0.05). Cultivars Jagalene, Overley, Santa Fe, and Jackpot showed high levels of resistance to all isolates, while Fuller was moderately resistant and Everest was highly susceptible to all isolates. A significant isolate-by-cultivar interaction was observed (P < ). Figure 3-2. Linear regression analysis between percent tissue affected by blast on wheat seedling leaves versus wheat heads. Relationship between leaf severity (LS) and head severity (HS) was: HS= *LS, N=12, R2=0.57, P=
103 Discussion Variation in the reaction of cultivars to artificial inoculations can occur over time among experiments. This variation can be accounted for in terms of random effects that can also affect the reproducibility of experiments. Random-effects differences can occur as a result of the vigor of the pathogen inoculum, inoculation technique, environmental conditions, and consistency of disease assessments over time. Based on our results, no significant differences in the reaction of the highly susceptible cultivar Everest to isolate T-25 were observed across experiments. Therefore, the variability from these random effects was minimal and results presented here are assumed to be accurate. In addition, our correlation analyses showed that disease-rating correlations between repetitions were extremely high between independent experiments (Fig. 1). As a result, high levels of reproducibility were present in these phenotyping experiments. There was a positive correlation between the disease phenotypes obtained with seedling and head inoculations (Fig. 2). The two most susceptible cultivars at the head stage, Karl 92 and Everest, showed the highest levels of severity at the seedling stage. Additionally, there was no evidence for the presence of susceptible cultivars at the seedling stage that showed resistance at the head stage. These results are concordant with observations of Arruda et al. (1). All cultivars that were resistant at the head stage (JackPot, Jagalene, Postrock, and Santa Fe) were also resistant at the seedling stage. However, two resistant cultivars at the seedling stage, Aspen and TAM107, were moderately susceptible at the head stage. Leaf resistance in the seedling stage is not a good predictor of head resistance in mature plants. Thus, relying on disease phenotypes from seedlings could lead to incorrectly identifying wheat genotypes as resistant when they are susceptible. In addition, because wheat blast in the field is primarily a head disease, phenotyping at the head stage is more relevant than at the seedling stage to accurately identify resistance. These findings are important to consider while testing cultivars under artificial epidemic conditions and before releasing lines as resources of resistance. Zhuang et al. (25) provided evidence that, in rice, there is a genetic basis for the difference in response to leaf and neck blast resistance. In their study, they concluded that different blast resistance genes might be effective at different developmental stages. It remains to be determined whether the reaction of wheat at the leaf and head stages is under separate genetic control. Although there was a significant (P < ) cultivar-by-isolate interaction, there was no evidence for the presence of physiological races among isolates T-7, T-12, T22, and T-25 (Fig. 90
104 3). Disease phenotypes across cultivars were not isolate specific. The significant interaction was due to small quantitative differences among isolates on certain cultivars. For the purpose of this study, those small differences were deemed of little practical importance. For example, when inoculated with isolate T-12, there was no statistical difference in disease ratings for cultivars Fuller and JackPot; however, when inoculated with isolates T-7, T-22, and T-25, disease ratings for Fuller were statistically higher than those for JackPot. Small variations such as this among cultivars in their individual reaction to different isolates resulted in a significant isolate-bycultivar interaction. Minor variations among isolates in phenotypes for intermediate cultivars such as Fuller are often observed for other pathogens (W. W. Bockus, unpublished). However, the overall resistance of this cultivar relative to susceptible Everest was expressed after inoculations with all four isolates. In conclusion, in no case did a cultivar display high levels of resistance to one isolate and high levels of susceptibility to another isolate or vice versa. Figure 3-3. Reaction of six selected wheat cultivars to four isolates (T-7, T-12, T-22, and T- 25) of the Triticum pathotype of Magnaporthe oryzae. Values within an isolate, when followed by a common letter, are not significantly different (P=0.05) Cultivars Postrock, JackPot, Overley, Jagalene, Jagger, and Santa Fe showed high levels of resistance to the four isolates used in these experiments. However, it is important to determine 91
105 whether resistance in these cultivars is manifested when tested against more recent isolates as well as under natural epidemic conditions. This is especially important because high levels of virulence diversity have been reported in recent Brazilian wheat blast populations (20). Studies (22,23) suggest that many physiological races are present in South America 14 years after the emergence of this disease (14). It is unknown if the recent wheat blast populations in South America differ in virulence or aggressiveness compared with the isolates associated with the original epidemics; the four isolates we had available for these experiments were collected in Brazil soon after the emergence of wheat blast in Consequently, the U.S. cultivars identified as resistant in this study need to be tested with recently collected isolates and validated under natural epidemic conditions. Nevertheless, this is the first report of the reaction of U.S. winter wheat cultivars to the Triticum pathotype of M. oryzae. The data reported here should be of value to the development of mitigation strategies in anticipation of the possible introduction of wheat blast into the United States. 92
106 References 1. Arruda, M., Bueno, C., Zamprogno, K., Lavorenti, N., and Urashima, A Reação do trigo à Magnaporthe grisea nos diferentes estádios de desenvolvimento. Fitopatol. Bras. 30: Barea, G., and Toledo, J Identificación y zonificación de Pyricularia o brusone (Pyricularia oryzae) en el cutivo de trigo en el departamento de Santa Cruz. Pages in: Centro de Investigación Agrícola Tropical. Informe Tecnico. Proyecto de Investigacion Trigo. Santa Cruz de la Sierra, Bolivia. 3. Busso, C., Nobuyoshi E., Franco, F., and Avezum, M Genetic and molecular characterization of pathogenic isolates of Pyricularia grisea from wheat (Triticum aestivum Lam.) and triticale ( Triticosecale Wittmack) in the state of Paraná, Brazil. Rev. Iberoam Micol. 24: Cabrera, M., and Gutiérrez, S Primer registro de Pyricularia grisea en cultivos de trigo del NE de Argentina. Depto. Protección Vegetal, Facultad de Ciencias Agrarias, UNNE. Available online at: agr.unne.edu.ar/ Extension/Res2007/SanVegetal/SanVegetal_06.pdf 5. Couch, B., Fudal, I., Lebrun, M., Tharreau, D., Valent, B., Van Kim, P., Not- téghem, J., and Kohn, L Origins of host-specific populations of the blast pathogen Magnaporthe oryzae in crop domestication with subsequent ex- pansion of pandemic clones on rice and weeds of rice. Genetics 170: Cruz, M., Prestes, A., Maciel, J., and Scheeren, P Resistencia parcial à brusone de genótipos de trigo comum e sintético nos estádios de planta jovem e de planta adulta. Trop. Plant Pathol. 35:1: Dos Anjos, J., Da Silva, D., Charchar, M., and Rodrigues, G Ocorrência de brusone (Pyricularia grisea) em trigo e centeio na região dos cerrados do Brasil Central. Pesquisa Agropecuaria Bras. 31: Goulart, A Perdas em trigo causadas pela brusone. Pages in: Workshop de Epidemiologia de Doenças de Plantas. Viçosa, M. Quantificação de perdas no manejo de doenças de plantas: anais. Viçosa, M: Universidade Federal de Viçosa, 2004b. 9. Goulart, A., and Paiva, F Incidência da brusone (Pyricularia oryzae) em diferentes cultivares de trigo (Triticum aestivum) em condições de campo. Fitopatol. Bras. 17: Goulart, A., and Paiva, F Perdas no rendimiento de grãos de trigo causada por Pyricularia grisea, nos anos de 1991 e 1992, no Mato Grosso do Sul. Sum. Phytopathol. 26: Goulart, A., Paiva, F., and Mesquita, A Ocorrência da brusone (Pyricularia oryzae) do trigo (Triticum aestivum) em Matto Grosso do Sul. Fitopatol. Bras. 15:
107 12. Goulart, A., Paiva, F., and Mesquita, N Perdas en trigo (Triticum aestivum) causadas por Pyricularia oryzae. Fitopatol. Bras. 17: Igarashi, S Update on wheat blast (Pyricularia oryzae) in Brazil. Pages in: Proc. Int. Conf.-Wheat Nontraditional Warm Areas. D. Saunders, ed. Mexico, D.F. 14. Igarashi, S., Utimada, C., Igarashi, L., Kazuma, A., and Lopes, R Pyricularia sp. em trigo. I. Ocorrência de Pyricularia sp. no Estado do Paranà. Fitopatol. Bras. 11: Kohli, M., Mehta, Y., Guzman, E., Viedma, L., and Cubilla, L Pyricularia blast A threat to wheat cultivation. Czech J. Genet. Plant Breed. 47:S McMullen, M., Jones, R., and Gallenberg, D Scab of wheat and barley: A re-emerging disease of devastating impact. Plant Dis. 81:12: Picinini, E., and Fernandes, J Ocorrência da brusone (Pyricularia oryzae) em lavouras comerciais de trigo (Triticum aestuvum) no Estado do Rio Grande do Sul. Fitopatol. Bras. 15: Prestes, A., Arendt, P., Fernandes, M., and Scheeren, P Resistance to Magnaporthe grisea among Brazilian wheat genotypes. Pages in: Wheat Production in Stressed Environments. Back et al., eds. Springer. 19. Urashima, A., Grosso, C., Stabili, A., Freitas, E., Silva, D., Netto, D., Franco, I., and Merola Bottan, J Effect of Magnaporthe grisea on seed germination, yield and quality of wheat. Page 267 in: Advances in Genetic, Genomics and Control of Rice Blast Disease. G. Wang and B. Valent, eds. Springer, Netherlands. 20. Urashima, A., Hashimoto, Y., Don, L., Kusaba, M., Tosa, Y., Nakayashiki, H., and Mayama, S Molecular analysis of the wheat blast population in Brazil with a homologue of retrotransposon MGR583. Ann. Phytopathol. Soc. Jpn. 65: Urashima, A., Igarashi, S., and Kato, H Host range, mating type and fertility of Pyricularia grisea from wheat in Brazil. Plant Dis. 77: Urashima, A., and Kato, H Varietal Resistance and Chemical Control of Wheat Blast Fungus. Sum. Phytopathol. 20: Urashima, A., Lavorenti, N., Goulart, A., and Mehta, Y Resistance spectra of wheat cultivars and virulence diversity of Magnaporthe grisea isolates in Brazil. Fitopatol. Bras. 29: Viedma, L Wheat blast occurrence in Paraguay. Phytopathology (Abstr.) 95:S Zhuang, J., Ma, W., Wu, J., Chai, R., Lu, J., Fan, Y., Jin, M., Leung, H., and Zheng, K Mapping of leaf and neck blast resistance genes with resistance gene analog, RAPD and RFLP in rice. Euphytica 128:
108 Appendix A - General Pathway Model Assumptions B R A Z I L U. S. Step Step definition Assumption 1 tonnes of wheat grain exported to U.S. from Brazil The U.S. imports feed wheat from Brazil (USDA FAS, 2013). A consortium of corporate hog and poultry producers has imported wheat in bulk from Brazil. 2 kilograms per tonne conversion Calculation 3 kilograms of wheat grain exported to U.S. from Brazil Calculation 4 kernels per kilogram conversion 1kg=18,160 kernels (Boratynsky, personal communication to G. Fowler. November, 2009) 5 kernels exported to U.S. from Brazil Calculation 6 kernels from Paraná for export More than 93% of the wheat exported from Brazil through PEP is produced in the states of Paraná and Rio Grande do Sul (MAPA. 2009a; MAPA, 2009b; MAPA, 2009c; MAPA, 2009d; MAPA, 2009e; MAPA, 2010a; MAPA, 2010b; MAPA, 2010c) 7 kernels from Rio Grande do Sul for export 8 p(wheat blast outbreak in Parana) The probability of wheat blast outbreak occurrence in Paraná is one every five years (20%) 9 p(wheat blast development in Rio Grande do Sul) 10 p(kernels from infested field in Parana) 11 p(kernels from infested field in Rio Grande do Sul) No outbreak has ever been reported in Rio Grande do Sul. However, the pathogen is endemic in that state (Picinini, E., and Fernandes, J. 1990). Used Min and Max values reported by EMBRAPA (2009). Max was half the value of the proportion of area affected by excess of rain. The mean between Min and Max was used as most likely value. Min corresponds to non-infested fields, and the most likely and Max values are both factors of ten less than what was used for Paraná. 12 number of kernels from infested field in Parana during outbreak year Calculation 13 number of kernels from infested field in Rio Grande do Sul during wheat blast development year Calculation 14 p(infected/infested kernels from Parana) High levels of kernel infection/infestation are common during outbreak years in Paraná (Goulart et al., 1995). 15 p(infected/infested kernels from Rio Grande do Sul) Low levels of kernel infection/infestation are common in Rio Grande do Sul at any time (Brancão et al, 2008) 16 number of infected/infested kernels from Parana Calculation 17 number of infected/infested kernels from Rio Grande do Sul Calculation 18 Total number of infected/infested kernels exported from Paraná and Rio Grande do Sul 19 p(kernels spilled between ports and feed mills) 20 number of infected/infested kernels spilled between ports and feed mills Calculation. MoT mycelia will remain viable in wheat kernels long enough to be a source of primary inoculum after entry into the U.S. (Goulart and Paiva, 1993; Reis et al, 1995; National Research Council, 2002) Grain loss through spillage is unavoidable during truck transportation (Desai, 2004; Harris and Lindblad, 1978; Reed, personal communication; EFSA Panel on Plant Health, 2010). Calculation 95
109 p(kernels spilled within winter wheat production areas in the coterminous U.S. or the North Carolina corridor) number of infected/infested kernels spilled in winter wheat production areas in the coterminous U.S. or the North Carolina corridor climate suitable for MoT establishment in the coterminous U.S. or the North Carolina corridor 24 p(wheat blast would occur in U.S. wheat field) 25 number of infected/infested kernels spilled in or near field where wheat blast would occur 26 p(infected volunteer plant from infected/infested kernel) 27 number of infected volunteer plants from spilled infected/infested kernels in or near field where wheat blast would occur 28 p(inoculum from volunteer plant results in establishment) P BR-US assumes equally spatial risk of spillage in any wheat field in the U.S. P BR-NC assumes equally spatial risk of spillage through a network of roads (corridor) that initiate from port of Wilmington and run through ten counties in North Carolina. 96 Calculation P BR-US uses U.S. climate, while P BR-NC uses North Carolina climate information. MoT colonists would be exposed to a range of climatic conditions that could determine whether enough MoT propagules are produced to infect a susceptible host and survive from season to season (Alves and Fernandes, 2006; Anderson et al 1948; Moss and Treventhan, de Andrade Cardoso et al. 2008; Latin and Harmon, 2004; Harmon and Latin, 2005; Farman, 2002). Suitability for MoT infection at the field level would differ from location to location. In the absence of information, the same distribution and parameters to calculate the probability of kernels coming from infested fields in Paraná were used to estimate the probability. Calculation MoT infected/infested spilled kernels would germinate and produce MoT infected volunteer plants along roadside verges (Goulart and Paiva, 1990) Calculation Most inoculum will not be effective because will not be able to reach the infection court in a timely manner and will not find adequate conditions for establishment. The tens rule of release and establishment was assumed (Williamson and Fitter, 1996) 29 number of initial infections from volunteer plant inoculum Calculation 30 total number of establishments from volunteer plant inoculum 31 number of ungerminated infected/infested kernels spilled in or near field where wheat blast would occur 32 p(inoculum from infected/infested kernels result in establishment) The central limit theorem allowed to model variation in the number of establishments that an initial establishment from volunteer plant inoculum will produce. The number of infected/infested kernels spilled that germinated and became volunteer plants was subtracted from the number of infected kernels spilled in or near field where wheat blast would occur Most inoculum will not be effective because will not be able to reach the infection court in a timely manner and will not find adequate conditions for establishment. The tens rule of release and establishment was assumed (Williamson and Fitter, 1996) 33 number of initial infections from infected/infested kernels Calculation 34 total number of establishments from infected/infested kernels total number of establishments in the coterminous U.S. or the North Carolina corridor 1 MoT establishment in the coterminous U.S. or the North Carolina corridor years until first establishment in the coterminous U.S. or the North Carolina corridor The central limit theorem allowed to model variation in the number of establishments that an initial establishment from infected/infested kernel inoculum will produce (Cruz et al., unpublished) Calculation Probability calculated based on the number of establishment successes and failures after running 10,000 iterations. A negative binomial distribution (Vose, 2008) was used considering that each trial may or may not become a success according to previous random processes (Vose, 2008).
110 Appendix B - U.S. Model P BR-US Step definition Units at Step Function/ Operation Parameter values Step A B C D E F G H 1 tonnes of wheat grain exported to U.S. from Brazil t/yr RiskPert(D1,E1,F1) 126, , , kilograms per tonne conversion kg/t 1,000 1 t=1,000 kg kilograms of wheat grain exported to U.S. from Brazil kg C1*C kernels per kilogram conversion Kernels/kg 18,160 1kg=18,160 kernels kernels exported to U.S. from Brazil Kernels ROUND(C3*C4,0) kernels from Paraná for export Kernels ROUND($C$5*D6,0) kernels from Rio Grande do Sul for export Kernels ROUND($C$5*D7,0) p(wheat blast outbreak in Parana) Probability RiskBinomial (1,D8) p(wheat blast development in Rio Grande do Sul) Probability RiskBinomial (1,D9) p(kernels from infested field in Parana) Probability RiskPert(D10,E10,F10) p(kernels from infested field in Rio Grande do Sul) Probability RiskPert(D11,E11,F11) number of kernels from infested field in Parana during outbreak year Kernels 13 number of kernels from infested field in Rio Grande do Sul during wheat blast development year Kernels IF(C8=0,0,ROUND(RiskNormal(C6*$C$10,SQRT(C6*$C$10* (1-$C$10)),RiskTruncate(0,)),0)) IF(C9=0,0,ROUND(RiskNormal(C7*$C$11,SQRT(C7*$C$11* (1-$C$11)),RiskTruncate(0,),RiskName(A14)),0)) 14 p(infected/infested kernels from Parana) Probability RiskPert(D14,E14,F14) p(infected/infested kernels from Rio Grande do Sul) Probability RiskLognorm(D15,E15) number of infected/infested kernels from Parana Kernels 17 number of infected/infested kernels from Rio Grande do Sul Kernels ROUND(RiskNormal(C12*C14,SQRT(C12*C14*(1- C14)),RiskTruncate(0,)),) ROUND(RiskNormal(C13*C15,SQRT(C13*C15*(1- C15)),RiskTruncate(0,)),0).. 97
111 18 Total number of infected/infested kernels exported from Paraná and Rio Grande do Sul Kernels SUM(C16:C17) p(kernels spilled between ports and feed mills) Probability RiskPert(D19,E19,F19) number of infected/infested kernels spilled between ports and feed mills p(kernels spilled within winter wheat production areas in the coterminous U.S. or the North Carolina corridor) number of infected/infested kernels spilled in winter wheat production areas in the coterminous U.S. or the North Carolina corridor climate suitable for MoT establishment in the coterminous U.S. or the North Carolina corridor Kernels Probability IF(C18=0,0,ROUND(RiskNormal(C18*C19,SQRT(C18*C19*( 1-C19)),RiskTruncate(0,)),0)) =(E21/F21) =RiskPe rt(h20,h 21,H22) Kernels IF(C20=0,0,RiskBinomial(C20,C21)... Probability RiskBinomial(1,D23) RiskDiscrete(F 24:F34,H24:H 34). Rank 24 p(wheat blast would occur in U.S. wheat field) Probability RiskPert(D10,E10,F10) number of infected/infested kernels spilled in or near field where wheat blast would occur Kernels IF(C23=0,0,RiskBinomial(C22,C24,RiskName(A25))) p(infected volunteer plant from infected/infested kernel) Probability RiskBeta(D26+1,E26-D26+1) number of infected volunteer plants from spilled infected/infested kernels in or near field where wheat blast would occur Volunteer plants. Cell Count IF(C25=0,0,RiskBinomial(C25,C26,RiskName(A27))) p(inoculum from volunteer plant results in establishment) Probability number of initial infections from volunteer plant inoculum Infections IF(C27=0,0,RiskBinomial(C27,C28,RiskName(A29))) total number of establishments from volunteer plant inoculum Establishments 31 number of ungerminated infected/infested kernels spilled in or near field where wheat blast would occur Ungerminated kernels RiskOutput(A30)+IF(C29=0,0,ROUND(RiskNormal(C29*D30, SQRT(C29)*E30,RiskTruncate(0,),RiskName(A30)),0)) C25-C p(inoculum from infected/infested kernels result in establishment) Probability number of initial infections from infected/infested kernels Infections IF(C31=0,0,RiskBinomial(C31,C32,RiskName(A33))) total number of establishments from infected/infested kernels Establishments total number of establishments in the coterminous U.S. or the North Carolina corridor 1 MoT establishment in the coterminous U.S. or the North Carolina corridor years until first establishment in the coterminous U.S. or the North Carolina corridor RiskOutput(A34)+IF(C33=0,0,ROUND(RiskNormal(C33*D34, SQRT(C33)*E34,RiskTruncate(0,),RiskName(A34)),0)) Establishments RiskOutput(A35)+C30+C34.. SUM calculation RiskOutput(A36) + IF(C35=0,0,1).... years RiskOutput(A37) + 1+RiskNegbin(1,E37) p 98
112 Appendix C - North Carolina Model P BR-NC Step Units at Step Function/ Operation Parameter values Step A B C D E F G H 1 tonnes of wheat grain exported to U.S. from Brazil t/yr RiskPert(A1,A2,A3) 126, , , kilograms per tonne conversion kg/t 1,000 1 t=1,000 kg kilograms of wheat grain exported to U.S. from Brazil kg C2*C kernels per kilogram conversion Kernels/kg 18,160 1kg=18,160 kernels kernels exported to U.S. from Brazil Kernels ROUND(C3*C4,0) kernels from Paraná for export Kernels ROUND($C$5*D6,0) kernels from Rio Grande do Sul for export Kernels ROUND($C$5*D7,0) p(wheat blast outbreak in Parana) Probability RiskBinomial (1,D8) p(wheat blast development in Rio Grande do Sul) Probability RiskBinomial (1,D9) p(kernels from infested field in Parana) Probability RiskPert(D10,E10,F10) p(kernels from infested field in Rio Grande do Sul) Probability RiskPert(D11,E11,F11) number of kernels from infested field in Parana during outbreak year Kernels 13 number of kernels from infested field in Rio Grande do Sul during wheat blast development year Kernels IF(C8=0,0,ROUND(RiskNormal(C6*$C$10,SQRT(C6*$C$10 *(1-$C$10)),RiskTruncate(0,)),0)) IF(C9=0,0,ROUND(RiskNormal(C7*$C$11,SQRT(C7*$C$11 *(1-$C$11)),RiskTruncate(0,),RiskName(A14)),0)) p(infected/infested kernels from Parana) Probability RiskPert(D14,E14,F14) p(infected/infested kernels from Rio Grande do Sul) Probability RiskLognorm(D15,E15) number of infected/infested kernels from Parana Kernels 17 number of infected/infested kernels from Rio Grande do Sul Kernels ROUND(RiskNormal(C12*C14,SQRT(C12*C14*(1- C14)),RiskTruncate(0,)),) ROUND(RiskNormal(C13*C15,SQRT(C13*C15*(1- C15)),RiskTruncate(0,)),0)
113 18 Total number of infected/infested kernels exported from Paraná and Rio Grande do Sul Kernels SUM(C16:C17) p(kernels spilled between ports and feed mills) Probability RiskPert(D19,E19,F19) number of infected/infested kernels spilled between ports and feed mills p(kernels spilled within winter wheat production areas in the coterminous U.S. or the North Carolina corridor) number of infected/infested kernels spilled in winter wheat production areas in the coterminous U.S. or the North Carolina corridor climate suitable for MoT establishment in the coterminous U.S. or the North Carolina corridor Kernels IF(C18=0,0,ROUND(RiskNormal(C18*C19,SQRT(C18*C19*( 1-C19)),RiskTruncate(0,)),0))..... Probability D Kernels IF(C20=0,0,RiskBinomial(C20,C21)..... Probability RiskBinomial(1,D23) RiskDiscrete(F 24:F34,H24:H3 4) 24 p(wheat blast would occur in U.S. wheat field) Probability RiskPert(D10,E10,F10) number of infected/infested kernels spilled in or near field where wheat blast would occur Kernels IF(C23=0,0,RiskBinomial(C22,C24,RiskName(A25))) p(infected volunteer plant from infected/infested kernel) Probability RiskBeta(D26+1,E26-D26+1) number of infected volunteer plants from spilled infected/infested kernels in or near field where wheat blast would occur Volunteer plants. Rank Cell Count IF(C25=0,0,RiskBinomial(C25,C26,RiskName(A27))) p(inoculum from volunteer plant results in establishment) Probability number of initial infections from volunteer plant inoculum Infections IF(C27=0,0,RiskBinomial(C27,C28,RiskName(A29))) total number of establishments from volunteer plant inoculum Establishments 31 number of ungerminated infected/infested kernels spilled in or near field where wheat blast would occur Ungerminated kernels RiskOutput(A30)+IF(C29=0,0,ROUND(RiskNormal(C29*D30, SQRT(C29)*E30,RiskTruncate(0,),RiskName(A30)),0)) C25-C p(inoculum from infected/infested kernels result in establishment) Probability number of initial infections from infected/infested kernels Infections IF(C31=0,0,RiskBinomial(C31,C32,RiskName(A33)) total number of establishments from infected/infested kernels Establishments total number of establishments in the coterminous U.S. or the North Carolina corridor 1 MoT establishment in the coterminous U.S. or the North Carolina corridor years until first establishment in the coterminous U.S. or the North Carolina corridor RiskOutput(A34)+IF(C33=0,0,ROUND(RiskNormal(C33*D34, SQRT(C33)*E34,RiskTruncate(0,),RiskName(A34)),0)) Establishments RiskOutput(A35)+C30+C34.. SUM calculation RiskOutput(A36) + IF(C35=0,0,1)..... years RiskOutput(A37) + 1+RiskNegbin(1,E37) p 100


114 Appendix D - Wheat blast outbreak vs non-outbreak year maps Outbreak year Accumulated inoculum build-up days from planting to heading Paraná Rio Grande do Sul


115 Nonoutbreak year Accumulated inoculum build-up days from planting to heading Paraná Rio Grande do Sul


116 Outbreak year Accumulated infection days during heading Paraná Rio Grande do Sul


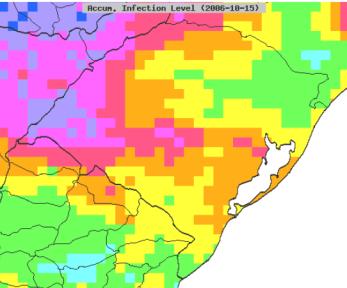


117 Nonoutbreak year Accumulated infection days during heading Paraná Rio Grande do Sul


118 Outbreak year Accumulated frost days from planting to heading Paraná Rio Grande do Sul


119 Nonoutbreak year Accumulated frost days from planting to heading Paraná Rio Grande do Sul

120 Appendix E - Climate suitability risk for wheat blast outbreak in Paraná and Rio Grande do Sul 107

121 Appendix F - Climate suitability risk maps for MoT establishment for the three major tiers that included the lower 48 U.S. states 108