Supplement to: The Genomic Sequence of the Chinese Hamster Ovary (CHO)-K1 cell line
|
|
|
- Stephany Gordon
- 5 years ago
- Views:
Transcription
1 Supplement to: The Genomic Sequence of the Chinese Hamster Ovary (CHO)-K1 cell line Table of Contents SUPPLEMENTARY TEXT:... 2 FILTERING OF RAW READS PRIOR TO ASSEMBLY:... 2 COMPARATIVE ANALYSIS... 2 IMMUNOGENIC RESPONSES DUE TO GLYCAN STRUCTURES:... 2 IDENTIFICATION OF NON- CODING RNAS... 2 ASSIGNMENT OF SCAFFOLDS TO CHROMOSOMES... 3 SUPPLEMENTARY FIGURES... 5 SUPPLEMENTARY FIGURE 1:... 5 SUPPLEMENTARY FIGURE 2:... 6 SUPPLEMENTARY FIGURE 3:... 7 SUPPLEMENTARY FIGURE SUPPLEMENTARY FIGURE 5:... 9 SUPPLEMENTARY FIGURE 6: REFERENCES:
2 Supplementary Text: Filtering of raw reads prior to assembly: We filtered the Illumina reads based on several criteria such as: Filter reads where more than 10% of the bases were degenerate (N). Quality filtering of the reads with a Q40 cutoff. Filter for contamination caused by DNA adaptor dimers. Filter reads which were PCR duplicates (Two totally identical reads). Comparative analysis Many of the predicted 24,383 genes have homologs in human (19,711), mouse (20,612) and rat (21,229). There were 3,433 mouse genes (consisting largely of transmembrane proteins and odorant receptors) without a homolog in the CHO genome. Orthologous clusters among the CHO, human, mouse and rat genomes were computed using OrthoMCL 1. We found 15,851 CHO genes grouped into 13,571 orthologous clusters, out of which 407 genes were CHO-K1 specific (i.e., not shared with either human, mouse or rat). 13,374 CHO genes have orthologs in human, mouse and rat. CHO-K1 shares 862 genes with mouse and rat, while only sharing 596 genes with human and mouse and 177 with human and rat. This result suggests that, at the genome-level, CHO-K1 more closely resembles the rodents than human (Supplementary Figure 4). Lastly, 2,428 gene clusters contained human, mouse and rat genes but no CHO-K1 genes. These clusters are enriched for genes involved in defense and immune response (Supplementary Table 12). Immunogenic responses due to glycan structures: Variations in glycan structure between individuals can also result from the common ABO blood group system. These glycans include the H blood group structure (O blood type), and the A and B structures that result from different alleles of the ABO gene. In addition to ABO, the H and Secretor loci encode additional glycosyltransferases that are responsible for the various glycan structures. In the synthesis of the ABO antigens, a precursor glycan is modified by α1 2 fucosyltransferases, encoded by the H or Secretor genes (FUT1 and FUT2). These enzymes form a disaccharide unit of Fucα1 2Galβ1-, which is the H structure. This structure can be further modified by the glycosyltransferase encoded by the ABO gene. It has been shown that the H and Secretor gene products have no detectable activity in CHO cells 2. Moreover, while we find homologs for these genes in the CHO-K1 genome, there are no detectable levels of expression for either of these genes as well as the ABO gene. This further limits the production of proteins with potential immunogenic responses in humans. Identification of non- coding RNAs Non-coding RNAs: Non-coding transcripts do not create protein products; while many remain functionally uncharacterized, some of which may have novel functions. Sequenced transcripts from a pooled CHO sample were compared to the frnadb database of non-coding RNAs 3 using BLAST. Although the entire frnadb consists of sequences from multiple species (mainly human, mouse, rat and zebra fish), most of the top alignment hits for long ncrnas were those of mouse, corroborating pervious results demonstrating the similarities between CHO and mouse genomes (see Supplementary Table 7 for the ncrnas). 2
3 A breakdown of high scoring sequences into different ncrna classes was examined; particularly pre-mirnas which are the precursors of single-stranded (ss) mirnas whose expression in animals and plants are known to affect the translation or stability of target mrnas. Most of these pre-mirnas that CHO transcripts aligned originated mainly from mouse and rat (see Supplementary Table 8). snornas are a class of small RNA molecules that primarily guide chemical modifications of other RNAs. The majority of snornas to which CHO sequences align belong to a particular class of Small Cajal body-specific RNAs (scarnas) from mouse and human. scarnas localize to Cajal bodies, which are sub-organelles typically found in the nucleus of proliferative and metabolically active cells like embryonic or tumor cells. See Supplementary Table 9 for identified snornas. Assignment of scaffolds to chromosomes Reads from each of the chromosome preparation were aligned to the draft genome reference using the BWA 4 package. Subsequently, SAMtools 5 were used to filter for high quality mapping of reads with score of greater than 30. Read alignment files were then parsed using BEDtools 6 to get the number of reads that are associated with each of the scaffolds. The number of reads associated with each scaffold from a particular chromosome preparation were arranged in the following data format. In each cell the number of reads associated with the scaffold and preparation is normalised by the total number of reads across each column so that a valid comparison can be made across each preparation. Normalisation is performed across the column by dividing each entry by the total number of reads of the column. Names of Scaffold Chromosome Preparation 1 Chromosome Preparation n scaffold 1 Number of reads associated with the scaffold and preparation Scaffold n To determine the assignment of the scaffold to a particular chromosome preparation, two measures were used. First, the maximum number of normalized reads associated with each scaffold is divided by the sum of the normalized reads across the row i.!! =!"#! (!"#!)!"#$%!!"!"#!!"#! Second, the second largest number of the normalized reads associated with each scaffold is divided by the sum of the normalized reads across the row i.!!! = 2!"!"#!(!"#!)!"#!!"#$%!!"!"#! For each of the scaffolds, the associated x and y values are plotted. The values of x and y are mathematically bounded by the following inequalities: x>y (red line); x+y<1 (blue line) ; 0<x<1 ; 0<y<1 (Supplementary Figure 5). To assign the chromosome with high stringency, a quantitative measure is calculated (i.e., fold change of the value x over the value y). This measure can be interpreted as fold change of the maximum normalized score for each scaffold against the second 3
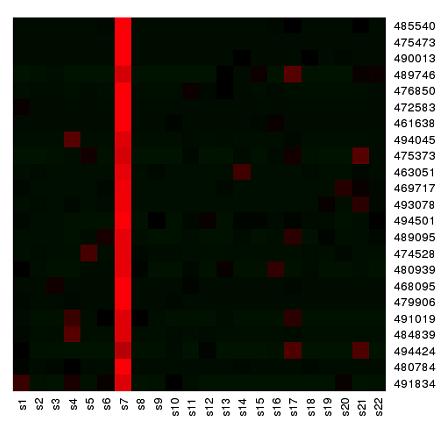
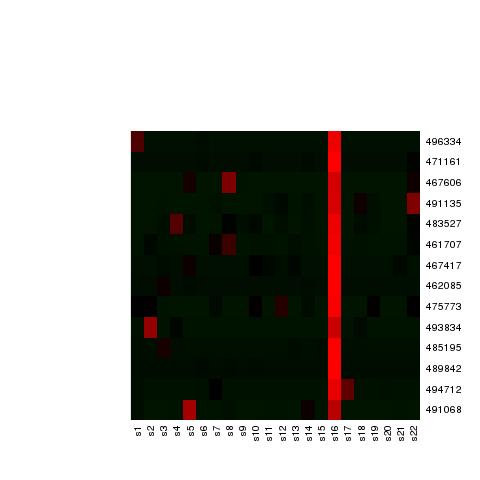
4 maximum score. A high fold change value will indicate a strong confidence that the scaffold belongs almost uniquely to a particular chromosome preparation and will be assigned the respective chromosome preparation label. See Supplementary Table 19 for the values corresponding to the N50 scaffold in each of the chromosomal preparations. The heatmap of the correlation matrix generated between all the N50 scaffolds suggested 21 clusters of highly correlated scaffolds. To gain further insight into the number of read associated with each scaffold across different sample preparations, K-means clustering was performed on the same matrix to label and separate the scaffolds into different groups. Individual heatmaps for each group were generated (Supplementary Figure 6). The X-axis is the samples label from S1 to S22 and the Y axis are the names of the scaffolds belonging to the group as determined from the clustering step. We obtained 21 group labels for the scaffolds, where a clear red vertical line indicates that a large number of sequenced reads mapping to those scaffolds originates from a particular single sample preparation (Supplementary Table 20). 4
5 Supplementary Figures Supplementary Figure 1: Illumina 17-mer volume histograms of CHO-K1. The volume of K-mers (Y axis) is plotted against their frequency. The truncated peak at low frequency represents K-mers containing random sequencing errors. The volume peak is at 20 and the total K-mer number is 52,036,421,291. The estimated genome size (total K-mer number/volume peak) thus is 2.6 Gb. 5
6 Supplementary Figure 2: Sequencing depth distribution. Average sequencing depth is and peak depth is 63. 6
7 Supplementary Figure 3: GC content distribution among CHO, mouse, rat and human. The X-axis is the GC percentage in the 500bp window and the Y-axis is the percentage of window with certain GC percentage (number of windows with certain GC percentage/total windows). 7

8 Supplementary Figure 4 Orthologous clusters between the CHO, human, mouse and rat genomes show a high overlap of gene content between the organisms. A total of 15,851 CHO genes form orthologous clusters with human, mouse and rat genes. Only the number of CHO genes in each category is shown. The clusters without a CHO gene are not shown. 8
9 Supplementary Figure 5: A scatter plot of the top two relative frequencies was used to identify scaffolds clearly corresponding to unique chromosome amplification. The red and blue lines represent the mathematical boundaries originating from the method of counting the frequency. Each point on the plot represents a scaffold from the set of N50 scaffolds, and each scaffold point is defined by two values, the maximum and the second largest fraction of the scaffold covered by an individual chromosome lane preparation. Points that are indicated in light blue represent a threshold that requires the maximum to be more than twice than that of the second largest value. 9
10 10
. 11")
11 Supplementary Figure 6: Collection of 17 groups of heatmaps from the K-means clustering analysis, which show the presence of 21 distinct chromosome groups (vertical lines). 11
12 References: 1. Chen, F., Mackey, A.J., Stoeckert, C.J., Jr. & Roos, D.S. OrthoMCL- DB: querying a comprehensive multi- species collection of ortholog groups. Nucleic Acids Res 34, D (2006). 2. Prieto, P.A. et al. Expression of human H- type alpha1,2- fucosyltransferase encoding for blood group H(O) antigen in Chinese hamster ovary cells. Evidence for preferential fucosylation and truncation of polylactosamine sequences. J Biol Chem 272, (1997). 3. Kin, T. et al. frnadb: a platform for mining/annotating functional RNA candidates from non- coding RNA sequences. Nucleic Acids Res 35, D (2007). 4. Li, H. & Durbin, R. Fast and accurate short read alignment with Burrows- Wheeler transform. Bioinformatics 25, (2009). 5. Li, H. et al. The Sequence Alignment/Map format and SAMtools. Bioinformatics 25, (2009). 6. Quinlan, A.R. & Hall, I.M. BEDTools: a flexible suite of utilities for comparing genomic features. Bioinformatics 26, (2010). 12