QTL mapping of Sclerotinia basal stalk rot (BSR) resistance in sunflower using genotyping-bysequencing
|
|
|
- Hilary Robbins
- 5 years ago
- Views:
Transcription


1 QTL mapping of Sclerotinia basal stalk rot (BSR) resistance in sunflower using genotyping-bysequencing (GBS) approach Zahirul Talukder 1, Gerald Seiler 2, Qijian Song 3, Guojia Ma 4, Lili Qi 2 1 Department of Plant Sciences, North Dakota State University, Fargo, ND 2 USDA-ARS, Northern Crop Science Laboratory, Fargo, ND 3 USDA-ARS, Soybean Genomics and Improvement Lab, Beltsville, MD 4 Department of Plant Pathology, North Dakota State University, Fargo, ND
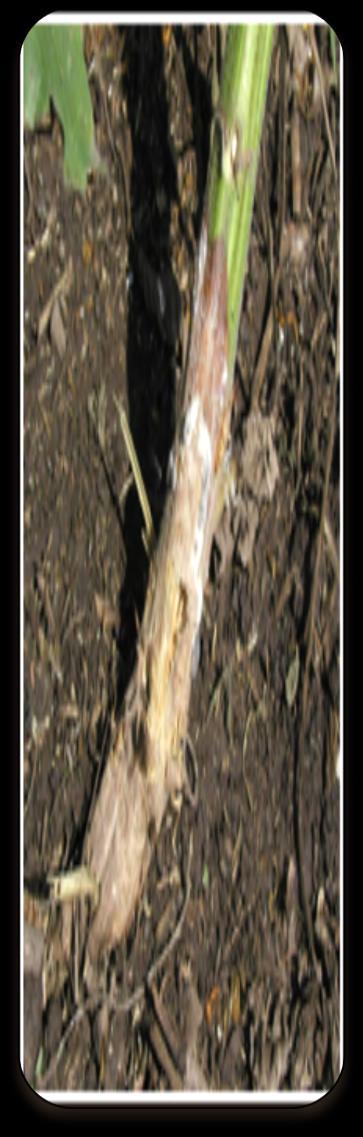
2 INTRODUCTION


3 GOAL OF THE PROJECT Overall objective To improve Sclerotinia disease resistance in the cultivated sunflower
 developed through Single Seed Descent (SSD) method from the cross HA 441/RHA 439 Genotype-by-sequencing (GBS)")

4 Genotyping Plant Materials MATERIALS & METHODS Parents HA 441 (a maintainer line) and RHA 439 (a restorer line) Mapping population 106 F 7 -derived Recombinant Inbred Lines (RIL) developed through Single Seed Descent (SSD) method from the cross HA 441/RHA 439 Genotype-by-sequencing (GBS) technology was used for simultaneous discovery and genotyping of large numbers of single nucleotide polymorphism (SNP) markers GBS was conducted at the Genomic Diversity facility of Cornell University A total of 1,236 good quality polymorphic SNP markers were obtained from the GBS protocol for linkage mapping
 Environments 2012: Carrington, ND and Crookston, MN 2013: Crookston, MN 2014: Carrington, ND and Grandin, ND Field design")

5 Stalk rot evaluation MATERIALS & METHODS (CONT.) Environments 2012: Carrington, ND and Crookston, MN 2013: Crookston, MN 2014: Carrington, ND and Grandin, ND Field design Randomized complete block design (RCBD) Two replications each for 2012 and 2013 field trials Four replications each for 2014 field trials Field inoculation S. sclerotiorum mycelia grown on millet and 80 gm of inoculums deposited in furrows next to the rows of sunflower lines at V-6 growth stage Disease incidence (DI) scoring Percent of plants showing BSR lesion
")


6 QTL mapping Linkage Mapping MATERIALS & METHODS (CONT.) JoinMap 4.1 software was used for linkage analysis Maximum likelihood (ML) algorithm was used to determine marker order Final genetic map was constructed with 1,049 SNP markers placed on 17 linkage groups of sunflower genome QTL analysis was conducted separately for each environment and also using integrated data across environments Composite interval mapping (CIM) option of WinQTL Cartographer v2.5 was used for QTL mapping QTL analysis results were confirmed using PLABQTL v1.2
7 RESULTS Table 1. Analysis of variance (ANOVA) of BSR disease incidence (DI) for HA441/RHA 439 RIL population evaluated in five environments Component df Variance estimate Confidence limit (0.05) F/Z value lower upper Pr > F/Z Env <.0001 Rep (Env) 9 σ 2 r = Genotype 107 σ 2 g = <.0001 Genotype x Env 428 σ 2 ge = <.0001 Error 963 σ 2 e = Analysis was performed across all five environments using PROC MIXED of SAS version 9.3. All factors were treated as random effects except environment
8 Number of RILs Carrington Crookston Crookston Disease incidence (%) Number of RILs Carrington Grandin 2014 Legend RHA 439 HA Disease incidence (%) Disease incidence (%) Fig. 1. Frequency distributions of BSR disease incidence (DI) in the HA441/RHA439 RIL population evaluated in five environments
9 Carrington ρ = 0.29 ** Crookston ρ = 0.55 *** ρ = 0.46 *** Crookston ρ = 0.53 *** ρ = 0.34 ** ρ = 0.46 *** Carrington ρ = 0.51 *** ρ = 0.48 *** ρ = 0.66 *** ρ = 0.57 *** Grandin Fig. 2. Spearman s rank correlation of BSR disease incidence (DI) among environments evaluated for HA 441/RHA 439 RIL population
 Left Flanking markers Right R 2 1-LOD interval Qbsr-4.1 4 32.")
10 RESULTS (CONT..) Table 2. Significant Sclerotinia BSR resistance QTL identified in the HA 441/RHA 439 RIL sunflower population QTL LG Peak position (cm) Left Flanking markers Right R 2 1-LOD interval Qbsr S4_ S4_ Qbsr S9_ S9_ Qbsr S10_ S10_ Qbsr S14_ S14_ Qbsr S16_ S16_ Qbsr S17_ S17_

11 Qbsr-4.1 Qbsr-9.1 Qbsr Qbsr-11.1 Qbsr-16.1 Qbsr-17.1 LG4 LG9 LG10 LG11 LG16 LG17 S4_ S4_ S4_ S4_ S4_ S4_ S18_ S18_ S18_ S18_ S4_ S12_ S4_ S4_ S4_ S4_ S18_ S4_ S4_ S4_ S4_ S4_ S14_ S14_ S4_ S17_ S4_ S4_ S4_ S4_ S18_ S4_ S4_ S4_ S4_ S4_ S4_ S4_ S4_ S4_ S4_ S4_ S4_ S4_ S4_ S4_ S4_ S4_ S1_ S1_ S4_ S4_ S9_ S9_ S9_ S9_ S5_ S5_ S9_ S9_ S9_ S9_ S9_ S9_ S9_ S9_ S9_ S9_ S9_ S9_ S9_ S9_ S9_ S9_ S14_ S9_ S9_ S9_ S9_ S9_ S9_ S9_ S9_ S9_ S9_ S9_ S9_ S9_ S9_ S9_ S9_ S9_ S9_ S9_ S9_ S9_ S9_ S9_ S9_ S9_ S9_ S9_ S9_ S9_ S9_ S9_ S9_ S18_ S18_ S9_ S9_ S9_ S9_ S9_ S9_ S9_ S9_ S9_ S9_ S9_ S9_ S9_ S9_ S9_ S9_ S9_ S9_ S9_ S9_ S9_ S9_ S9_ S9_ S9_ S9_ Figure 3. QTL in the linkage map S9_ S9_ S9_ S9_ S10_ S10_ S10_ S10_ S1_ S10_ S10_ S10_ S10_ S10_ S10_ S10_ S10_ S10_ S10_ S10_ S10_ S17_ S10_ S10_ S10_ S10_ S10_ S10_ S10_ S10_ S10_ S10_ S10_ S10_ S10_ S10_ S10_ S10_ S10_ S10_ S10_ S10_ S10_ S2_ S10_ S10_ S10_ S10_ S10_ S10_ S10_ S10_ S10_ S10_ S10_ S10_ S10_ S10_ S10_ S10_ S10_ S10_ S10_ S10_ S10_ S10_ S10_ S10_ S10_ S10_ S10_ S10_ S10_ S10_ S10_ S10_ S10_ S10_ S10_ S10_ S10_ S10_ S9_ S10_ S10_ S10_ S10_ S10_ S10_ S10_ S10_ S10_ S10_ S10_ S10_ S10_ S10_ S10_ S10_ S10_ S10_ S10_ S10_ S10_ S10_ S10_ S10_ S10_ S10_ S10_ S10_ S10_ S10_ S10_ S10_ S10_ S10_ S10_ S10_ S10_ S10_ S10_ S10_ S10_ S10_ S10_ S10_ S8_ S8_ S10_ S8_ S10_ S10_ S10_ S10_ S10_ S10_ S10_ S10_ S10_ S10_ S10_ S10_ S10_ S10_ S10_ S10_ S10_ S10_ S10_ S10_ S10_ S10_ S10_ S10_ S10_ S10_ S10_ S10_ S10_ S10_ S10_ S10_ S10_ S10_ S10_ S10_ S10_ S10_ S10_ S10_ S14_ S14_ S10_ S10_ S10_ S18_ S11_ S11_ S11_ S11_ S11_ S11_ S11_ S11_ S11_ S11_ S11_ S11_ S11_ S11_ S11_ S11_ S11_ S11_ S11_ S11_ S11_ S11_ S15_ S15_ S11_ S11_ S11_ S11_ S11_ S11_ S11_ S11_ S11_ S11_ S11_ S11_ S11_ S11_ S15_ S11_ S11_ S18_ S18_ S11_ S14_ S14_ S11_ S11_ S12_ S12_ S11_ S18_ S18_ S11_ S11_ S11_ S11_ S11_ S11_ S16_ S14_ S18_ S18_ S16_ S16_ S16_ S16_ S16_ S16_ S16_ S16_ S16_ S16_ S16_ S16_ S16_ S16_ S16_ S18_ S18_ S14_ S16_ S16_ S16_ S18_ S16_ S16_ S16_ S16_ S16_ S18_ S11_ S11_ S10_ S18_ S2_ S18_ S1_ S1_ S18_ S1_ S16_ S10_ S10_ S16_ S18_ S3_ S16_ S16_ S16_ S16_ S16_ S16_ S16_ S14_ S16_ S16_ S16_ S9_ S16_ S16_ S18_ S18_ S18_ S18_ S16_ S16_ S16_ S16_ S16_ S18_ S16_ S18_ S18_ S16_ S16_ S16_ S16_ S11_ S16_ S16_ S16_ S16_ S16_ S16_ S16_ S16_ S16_ S16_ S16_ S16_ S16_ S16_ S17_ S17_ S17_ S17_ S17_ S17_ S17_ S6_ S17_ S17_ S17_ S4_ S17_ S17_ S18_ S18_ S17_ S17_ S18_ S18_ Legend Environment specific QTL Carrington 2012 Carrington 2014 Crookston 2013 Crookston 2012 Grandin 2014 QTL detected in all environments QTL detected in combined analysis
12 Cargill 270 Croplan 305 HA 441 RHA 439 RIL22 RIL25 RIL61 RIL87 RIL93 RIL102 RIL03 RIL10 RIL58 RIL96 Disease Incidence (%) Susceptible check Resistant check Parents Most resistant RILs Most susceptible RILs Fig. 4. Mean BSR disease incidence (DI) of the most resistant and most susceptible RILs in seven environments during
13 Cargill 270 Croplan 305 HA 441 RHA 439 RIL22 RIL25 RIL61 RIL87 RIL93 RIL102 RIL03 RIL10 RIL58 Disease Incidence (%) RIL96 BSR QTL Susceptible check Resistant check Parents Most resistant RILs Most susceptible RILs Qbsr-10.1 a A A A A A A A a a a a Qbsr-17.1 B b B B B B B B b b b b Fig. 5. QTL allele distribution in the parents and in the RILs
14 Conversion of flanking SNPs into AS-PCR primers SNP marker: S10_ SNP marker: S10_ Fig. 6. PCR gel picture of two SNP markers linked to the BSR resistance QTL amplified using allele-specific primers designed for length polymorphism
-QTL population for BSR resistance Conduct 1 st")

15 FUTURE PLAN Conduct 2 nd year field evaluation of HA 89/H. argophyllus advanced backcross (AB)-QTL population for BSR resistance Conduct 1 st year field evaluation of HA 89/H. praecox AB-QTL population for BSR resistance Genotyping and linkage map construction of AB- QTL population derived from the cross of HA 89/H. argophyllus


16 ACKNOWLEDGEMENT Prof. Kevin McPhee Michelle Gilley Angelia Hogness Christopher Misar Megan Ramsett Dr. Tom Gulya National Sclerotinia Initiative for financial support