CEREAL STRAW TORREFACTION: RESULTS ON PILOT PLANT TEST. June 2013
|
|
|
- Tamsin Eaton
- 5 years ago
- Views:
Transcription
1 CEREAL STRAW TORREFACTION: RESULTS ON PILOT PLANT TEST June 2013

2 í n d i c e 1. Overview of CENER experience in torrefaction 2. Torrefaction process concept and reactor technology 3. Straw torrefaction 4. Torrefaction reactor modeling and up-scalling studies 5. Conclusions
3 1. Overview of CENER experience in torrefaction
4 1. Overview of CENER experience in torrefaction MILESTONES : Feasibility study biomass torrefaction for cofiring applications : Evaluation and selection of technologies. Laboratory and bench scale testing : Design and construction of pilot plant. Pilot plant commissioning. 2010: Modifications in the pilot plant. Transfer of the pilot plant from Noain to the new CB2G in Aoiz. 2011: Beech woodchips torrefaction. First pelletization tests. Torrefaction reactor model development. 2012: Torrefaction and pelltization of beech and pine woodchips. 2013: Straw torrefaction and pelletisation. New materials for testing: in the frame of SECTOR project ( Extensive testing of straw, woody energy crops (poplar, eucaliptus and paulonia), pruning from olive trees and bagasse

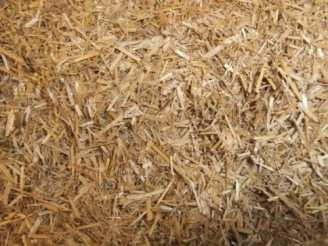
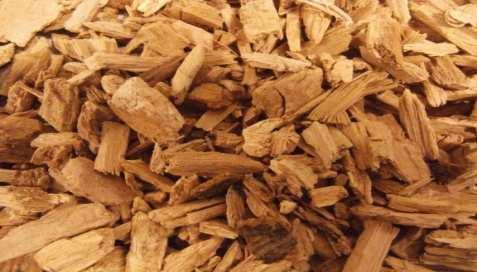

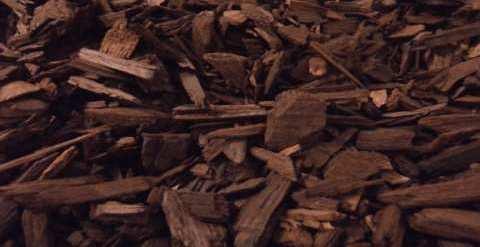

5 1. Overview of CENER experience in torrefaction MATERIALS PROCESED IN THE PILOT PLANT Beech woodchips Pine woodchips Chopped straw
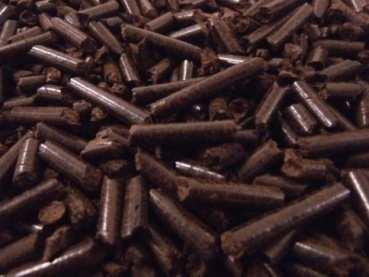
6 1. Overview of CENER experience in torrefaction TORREFIED PELLETS PROPERTIES Parameter Units Beech Pine Straw 1 Torrefaction degree % Hardgrove grindability index Bulk Density NA N.D. N.D. kg/m 3 (ar) Pellet durability % Optimization is needed and tests are ongoing with different die design to improve pellet density and durability. Moisture Content % (ar) Higher Heating Value Lower Heating Value GJ/t (daf) GJ/t (daf) C % (daf) H % (daf) ~6.0 ~ N % (daf) Ash Content % (db) Volatile matter content % (db) N.D.: Not detremined
7 1. Overview of CENER experience in torrefaction EFECT OF TORREFACTION DEGREE ON PRODUCT CHARACTERISTICS Straw (Laboratory test) LHV torrefied biomass / initial LHV (d.a.f.) Pine (Laboratory test) Pine (Small pilot plant) Beech (CB2G pilot test) Pine (CB2G pilot plant) Straw (CB2G pilot plant) 0% 5% 10% 15% 20% 25% 30% 35% 40% Torrefaction degree
8 2. Torrefaction process concept and reactor technology
9 2. Torrefaction process concept and reactor technology CENER TORREFACTION PROCESS CONCEPT WET BIOMASS DRY BIOMASS Indirectly heated reactor using thermal fluid at temperatures between 250 and 300ºC The combustible vapors are burned to heat up the thermal fluid. Previous biomass drying down to 5-15% moisture content No drying is required Flue gases from the boiler are used in the drier. Flue gases from the boiler are used air preheater. Additional fuel could be necessary, mainly for drying, depending No additional fuel is necesary on biomass moisture content and target torrefaction degree Particle size reduction below 8-40 mm depending on the feedstock


10 2. Torrefaction process concept and reactor technology TORREFACTION REACTOR The core of the process equipment is the torrefaction reactor of special design manufactured by LIST AG ( It is a cylindrical horizontal reactor with an agitator shaft and attached elements of special design procuring axial transport characteristic for all kind of biomass, radial product homogenisation inside the reactor and excellent heat transfer conditions. Reactor heating is carried out indirectly through the hot reactor walls, the actively heated shaft tube and the actively heated internal shaft elements using thermal oil as heat transfer fluid.
11 2. Torrefaction process concept and reactor technology ADVANTAGES Main advantages of this kind of Torrefaction reactor are: The technology is very flexible being able to process a very wide range of very different biomasses (particle size distributions, bulk densities and compositions, products requiring different transport mechanisms) It can process biomass with high fines content Good ratio of heat transfer surface to volume of reactor allowing shorter residence times and procuring high performance. Reactor walls, shaft tube and internal shaft elements are actively heated. Continuous and very effective product renewal / product mixing from the internal heating surface, generating higher heat transfer rates and avoiding radial temperature profiles inside the reactor The design of the shaft elements provide an axial conveying quite close to plug flow, assuring a good product residence time control (narrow residence time distribution), and at the same time an excellent mixing of the product in each section of the reactor, assuring a good product temperature control over the whole length of the reactor (avoiding temperatures differences in the product and minimizing the risk of smouldering) Large free gas and vapour space allows the flow of the torrefaction gas with minimal pressure drop keeping biomass feeding and product discharge at low pressure reducing inert gas consumption Large vapour dome cross section minimize dust entrainment with the gas Using thermal oil as heat transfer medium facilitate energy integration and process control. At the same time plant operation is more flexible and safer.
 Moisture, % 5-15% Amount of fines, % ( 3,15 mm) < 89% (1) Dust content (<250 microns) <62% (1) (1) Tested feedstock.")
12 2. Torrefaction process concept and reactor technology FEEDSTOCK FLEXIBILITY Torrefaction reactor accept a wide range of values of feedstock properties: density and fines content Parameter Dimension /nominal size, mm Reactor < 40 mm Bulk density, kg/m 3 >50 (1) Moisture, % 5-15% Amount of fines, % ( 3,15 mm) < 89% (1) Dust content (<250 microns) <62% (1) (1) Tested feedstock. Limits could depend case by case on other feedstock characteristics and process conditions % w/w Feedstock with up to 89% fines (<3.15 mm) and up to 62% dust (<250 microns) have been tested Example of feedstock: Sample code: Chipped < 30 mm ; Average particle size 8,0 mm < 3,15 3, ,531, dp (mm)
13 2. Torrefaction process concept and reactor technology PRODUCT HOMOGENEITY Wood mixing, homogeneous temperature and residence time control : to warranty product homogeneity for all size fractions Sample code Sample origin Moisture Ash Heating value HHV (MJ/kg) LHV (MJ/kg) Elemental analysis %C %H %N % w/w-"ar" % d.b. d.a.f. d.a.f ,5 1,4 22,2 21,0 55,5 5,9 0, (<8mm) 1,5 1,4 22,3 21,1 55,6 5,9 0, (16-8mm) /T04; 1,5 1,4 22,3 21,1 55,5 5,9 0, (>16mm) 1,5 1,4 22,2 21,0 55,5 5,9 0,16 Difference 0% 0% <0.1 MJ <0.1 MJ <0.1% 0% <0.01% ,0 1,3 20,7 19,4 52,0 6,1 0, (<8mm) 1,0 1,3 20,8 19,5 51,9 6,1 0, (16-8mm) /T05; 1,0 1, ,7 6,1 0, (>16mm) 1,0 1,3 20,7 19,5 51,6 6,1 0,13 Difference 0% 0% <0.1 MJ <0.1 MJ <0.4% 0% <0.03% Analysis acceptance repeatability criteria <0.2% <0.3% <0,12 MJ <0.39% <0.2% <0.03% Differences between the different particle size fractions in a sample are similar to analysis acceptance repeatability criteria


14 2. Torrefaction process concept and reactor technology PRODUCT HOMOGENEITY Easy temperature and residence time control : to warranty product homogeneity vs time on stream Differences are similar to analysis acceptance repeatability criteria
 - 40 HP Cooler and")
15 2. Torrefaction process concept and reactor technology PELLETIZATION PILOT PLANT Milling equipment Feeding hopper Harmer mill 2-12 mm Pelletization equipment Feeding hopper Mixer 2 m 3 Continuous addition of water and/or additives Pellet mill (MABRIK) - 40 HP Cooler and cleaner
16 2. Torrefaction process concept and reactor technology PELLETIZATION PILOT PLANT Regulation Biomass type Torrefaction degree Particle size Moisture content: Die characteristics Compression relation from 6 x16 to 6x46 Configuration: diameter and number of channels, etc Measurement Production rate and efficiency: kg/h per HP Pellet temperature Pellet moisture content Roller temperature Pellet durability and fines content Pellet bulk density
17 2. Torrefaction process concept and reactor technology PILOT PLANT IN OPERATION VIDEO OF THE PILOT PLANT IN OPERATION
18 3. Straw torrefaction
19 2. Straw torrefaction PILOT PLANT TEST RESULT MASS AND ENERGY BALANCE Mass and heat balance of straw torrefaction pilot test at 250ºC (heat transfer fluid) Material Parameter Unit Value Flow rate kg/h 314 Feedstock Moisture % wb 12 Nitrogen kg/h 12 Flow rate kg/h 240 Torrefied product Weight loss % db 13,1 Flow rate kg/h 86 Torrefied gas Temperature ºC 197 Balance Heat concept Value (kw) Input Output Supplied by heat transfer fluid 63,5 (measured) Transferred heat by reactor (calculated by simulation) 69,0 Losses (measured) 24,0 Heat of reaction (calculated by heat balance) -29,5 Balance 0,0
20 2. Straw torrefaction PILOT PLANT TEST RESULT HEAT CONSUMPTION Measured heat consumption per kg of product in torrefaction pilot test Reactor heat consumpti ion (kj/kg) Beech Straw Pine Straw torrefaction process has lower energy consumption ( 950 kj/kg) than woody biomass (> kj/kg) torrefaction with similar weight loss Heat transfer fluid temperature (ºC)
21 2. Straw torrefaction PILOT PLANT TEST RESULT PELLETIZATION TEST Energy efficiency of different torrefied biomasses pelletisation Torrefied biomass source Parameter Units Straw Beech Pine Pellet production kg/h Energy efficiency kg/kwh 12,7 10,3 9,0 Pellet temperature ºC Torrefaction degree % (db) 13,1 14,7 14,1 Pelletisation of torrefied straw was possible. Optimization of pelletization conditions is necessary to improve pellet quality. Energy consumption for torrefied straw pelletization seems to be lower than for torrefied wood.
22 4. Torrefaction reactor modeling and upscalling studies
23 4. Torrefaction reactor modeling and up-scalling studies CONSIDERATIONS OF THE MODEL A number of perfectly mixed reactors in series. The products output from one stage will be the input of the next. The torrefaction process is according the kinetic model from Di Blasi Lanzetta Kinetic parameters are obtained by thermogravimetric analysis of studied biomasses. Biomass particles are considered as isothermal. Intra-particle temperature profiles are neglected. Heat of reaction is considered as function of reaction temperature (correlations developed from pilot test energy balance) Gas-solid heat transfer is neglected (correlation under developmenet) For each stage mass balance and energy balance equations are solved Model calculates: conversion, temperature profile, gas temperature and heat demand of the reactor Model is used for reactor upscaling and for technoeconomic case studies
24 4. Torrefaction reactor modeling and up-scalling studies CONSIDERATIONS OF THE MODEL Kinetic constants are obtained by thermogravimetric analysis of studied biomasses
25 4. Torrefaction reactor modeling and up-scalling studies EXAMPLE OF MODEL OUTPUT Example of conversion and product temperature profiles in reactor by simulation T(ºC)/ Torrefaction degree (d.a.f) Length of reactor 0-5
26 4. Torrefaction reactor modeling and up-scalling studies MODEL VALIDATION Biomass conversion in good agreement with experimental results in terms of product conversion Test result Material Parameter Units Simulation Pilot plant Feedstock Flow rate kg/h Product Gas Flow rate kg/h Weight loss % db 13,0 13,1 Flow rate kg/h Temperature ºC
27 HEAT OF REACTION CORRELATIONS 4. Torrefaction reactor modelling Heat of reaction vs. averaged reaction temperature calculated from pilot test heat balance

28 4. Torrefaction reactor modeling and up-scalling studies MASS AND ENERGY BALANCE INDUSTRIAL PLANT CASE In order to close the energy balance, required torrefaction degree and thermal efficiency depends on straw moisture content. Efficiency is higher than the case of wet woody biomass.
29 5. Conclusions
30 5. Conclusions Torrefaction of straw was carried out successfully. Axial transport of the biomass inside of the reactor allowed proper torrefaction process without clogging, thereby obtaining a homogeneous product. Thermal efficiency for straw torrefaction is higher than for wood due to the lower moisture content and higher reactivity. In the other hand process concept has to be adapted due to the special characteristic of straw. Subsequent peletisation of torrefied straw was posible. Optimization of pelletization conditions is necessary to improve pellet quality. Energy consumption for torrefied straw pelletization was lower than for torrefied wood in similar conditions. Torrefaction process model developed by CENER fits well with the experimental results and is an effective tool for optimization and uspscalling studies to analyze the techno-economic feasibility and for plant design.

31 ACKNOWLEDGEMENTS Thank so much for your attention Contacts: Javier Gil: Ines Echeverría: This infrastructure has been co-funded through the ERDF Funds, the Ministry of Economy and Competitiveness and the Government of Navarra.
32

33