Vertex Environmental Inc.
|
|
|
- Patricia Mason
- 5 years ago
- Views:
Transcription

1 Vertex Environmental Inc. Optimizing Oxidant Delivery for In-Situ Remediation Remediation Technologies Symposium 2012 Banff, Alberta October 19, 2012 Bruce Tunnicliffe

2 Overview Background Purpose of Talk Vertex What is In-Situ? Key Factors Contaminant Distribution Free Phase Product Dissolved Phase Plume Oxidant Delivery Delivery Method Delivery Experiment Questions
3 Purpose of Talk In-situ remediation is now commonly considered and applied Currently: pre-remediation data & design for an in-situ project is similar to excavation Purpose: Explore what we need to consider to better deliver a remediation liquid (i.e oxidant) to the subsurface to improve remedial success.


4 Vertex Background Environmental Contracting Remediation and injection services Clients are consultants Consultant: Phase II ESA Vertex: Remedial Design, Remediation (bench, pilot, full-scale)
5 What Is In-Situ? Amendment (i.e. Oxidant) Pump Mixing System Delivery System Contamination Source: EPA, 2010 In-Situ is a Latin phrase meaning in its place Remediation completed in the ground

6 Source: EPA, 2010 What Is In-Situ?

7 Source: EPA, 2010 What Is In-Situ?

8 Source: EPA, 2010 What Is In-Situ?
9 Contaminant Characterization Advanced Characterization Tools: Laser Induced Fluorescence LIF Free Product (LNAPL) Membrane Interface Probe MIP Dissolved Phase (Plume)

10 Contaminant Characterization Laser Induced Fluorescence

 Fibre optic cable")
11 Laser Induced Fluorescence Developed in early 1990s US Army Corps of Engineers UVOST (Ultra Violet Optical Screening Tool) Light-based Equipment Geoprobe (direct push) Fibre optic cable Sapphire window

 Aromatic molecules (PAHs) readily absorb")
12 kerosene gasoline diesel oil Laser Induced Fluorescence Spectroscopy molecules absorb light (gain energy) and then emit light (lose energy = fluoresce) Aromatic molecules (PAHs) readily absorb and emit light

13 Laser Induced Fluorescence

14 Clean Sand 350 ppm 1,100 ppm 10,000 ppm 84,000 ppm Gasoline
15 Laser Induced Fluorescence

16 Contaminant Characterization Membrane Interface Probe

17 Membrane Interface Probe Nitrogen Carrier Gas VOCs to Detector Dissolved phase: Depth Relative conc. Lithology VOCs in Soil Probe Body Semi-permeable Membrane


18 Membrane Interface Probe Membrane Heater Block
19 MIP Example
20 Characterization In Sights Standard Characterization Monitoring Wells and Sampling (3 m) Advanced Characterization Tools Laser Induced Fluorescence (0.01 m) Free Product (LNAPL) Membrane Interface Probe (0.3 m) Dissolved Phase (Plume) 3-D view: superior understanding of aquifer Remedial design: Target discrete zones

21 Oxidant Delivery Oxidant Delivery Method Injection Wells Injection Points Delivery Experiment Injection Well Injection Points
22 Oxidant Delivery Method Article published in fall 2010 Ground Water Monitoring & Remediation 5 authors (Krembs et al. 2010): Created a database Examined 242 in-situ projects ( 96 to 07) All oxidation projects: Permanganate, catalyzed hydrogen peroxide (H 2 O 2 ), ozone, persulfate, peroxone (ozone and H 2 O 2 ), percarbonate Oxidants = liquids or gases
23 Delivery Method Gas Injection Oxidant Delivery Method Percent of Sites Injection wells 47 Direct push 23 Sparge points 14 Trenches, Galleries 10 Recirculation 7 Fracturing 6 Mechanical mixing 2 Horizontal wells 1 Percentages greater than 100% because multiple delivery techniques were used at some sites. Source: Krembs et al. 2010
24 Delivery Method Liquid Injection only Oxidant Delivery Method Percent of Sites Injection wells 54 Direct push 26 Sparge points Trenches, Galleries 11 Recirculation 8 Fracturing 7 Mechanical mixing 2 Horizontal wells 1 Percentages greater than 100% because multiple delivery techniques were used at some sites. Source: Krembs et al. 2010


25 Delivery Method Injection Well Source: ITRC, 2005


26 Delivery Methods Direct Push Bottom Up Source: ITRC, 2005


27 Delivery Methods Injection Point Injection Rod Tip Holder Injection Tip
28 Delivery Laboratory Experiment Overview Purpose: Assessment of Dye Distribution Experiments: Distribution from Injection Well Coarse Sand Distribution from Injection Point Coarse Sand Sand with Clay Layer
 Hydraulic Head=1.5 m Flow = 1.")
29 Delivery Laboratory Experiment Glass Container 51 by 26 by 31 cm 41 L Coarse Sand Filter Sand (#3) Bentonite Clay Water and Dye Food grade dye Injection Gravity Feed (0 psi) Hydraulic Head=1.5 m Flow = 1.0 to 4.5 lpm
30 Delivery Laboratory Experiment Experiment #1 Injection into Injection Well

31 Delivery Laboratory Experiment Insert Video M1793 HW Injection Injection Well, Experiment #1 2 diameter PVC Slot 10 Well, screened to bottom of tank Flow = 4.5 lpm
32 Delivery Laboratory Experiment Experiment #2 Injection into Temporary Point

33 Delivery Laboratory Experiment Insert Video M1794 Rod Pulling Pulling Injection Rod to remove Injection Tip

34 Delivery Laboratory Experiment Insert Video M1782 Injection Point Injection #1 Injection into Injection Point, Experiment #1 Injection rod located 9 cm from bottom of tank Flow = 4.0 lpm

35 Delivery Laboratory Experiment Insert Video M1795 Injection Point Injection #2 Injection into Injection Point, Experiment #2 Injection rod located 9 cm from bottom of tank Flow = 2.8 lpm
36 Delivery Laboratory Experiment Experiment #3 Injection into Temporary Point Clay Aquitard

37 Delivery Laboratory Experiment

38 Delivery Laboratory Experiment Insert Video M1799 Injection Point Injection with Clay Injection into Injection Point, Experiment #3 Injection rod located 5 cm from bottom of tank Flow = 1.0 lpm

39 Delivery Laboratory Experiment

40 Delivery Laboratory Experiment

41 Delivery Laboratory Experiment Injection into Injection Point, Experiment #3 Time = 0 min
42 Delivery Laboratory Experiment Injection into Injection Point, Experiment #3 Time = 2 min
43 Delivery Laboratory Experiment Injection into Injection Point, Experiment #3 Time = 4 min
44 Delivery Laboratory Experiment Injection into Injection Point, Experiment #3 Time = 5 min

45 Delivery Laboratory Experiment Injection into Injection Point, Experiment #3 Time = 15 min
46 Delivery In Sights Homogenous sand: Well = Horizontal distribution Point = Radial distribution Clay aquitard: Significant influence on dye distribution Tight soil will control distribution of liquid No dye migration into clay Idea: Injection point could be placed into clay to deliver directly to the clay unit
47 Conclusions / In Sights Oxidant chemistry works Better oxidant delivery = better remediation Two important factors: Understanding contaminant distribution Designing delivery system Contaminant Distribution Monitoring well (300 cm resolution) LIF free phase (1 cm resolution) MIP dissolved phase (30 cm resolution) Detailed data produce 3D plots, and design remediation approach accordingly
48 Conclusions / In Sights Oxidant Delivery System 2 most common methods: Wells and Points Wells: Good for homogeneous aquifers and evenly distributed contamination If multiple injections, lower cost option Limited ability to deliver into tighter soils, due to preferential flow into coarse soils Major problem, considering most historical contamination is located within tight soils
49 Conclusions / In Sights Injection Points: Pin point delivery flow from end of injection rod allows accurate vertical placement of oxidant Vertical distribution rods can be advanced to specific depths to target impacted seams Targeting tight soil layer = distribution into clays Higher injection pressure with steel injection rod construction Multiple injections, different locations Overall: When designing an in-situ remediation program, consider advanced characterization techniques and delivery method
 653-8444 x304 (519) 249-9184 mobile brucet@vertexenvironmental.ca www.")
50 Questions? Thank You for Your Time Bruce Tunnicliffe Vertex Environmental Inc. (519) x304 (519) mobile
51 Case Study Advanced Characterization and Oxidant Delivery Laser Induce Fluorescence Free Product (LNAPL) Membrane Interface Probe Dissolved Phase (Plume) Injection Points Oxidant Delivery
52 Case Study Former Fueling Area Highest Groundwater Concentrations
53 Case Study LIF Results No NAPL detected
54 Case Study
55 Case Site MIP Results Dissolved phase plume 2 m to 11 m below ground
56 Case Site Results North MIP Cross Section South MIP Cross Section
57 Case Site Results North MIP Cross Section
58 Case Site Results South MIP Cross Section

59 MIP Results Before ISCO Black Line May 13/2011 After ISCO Green Line Sept 27/2011

60
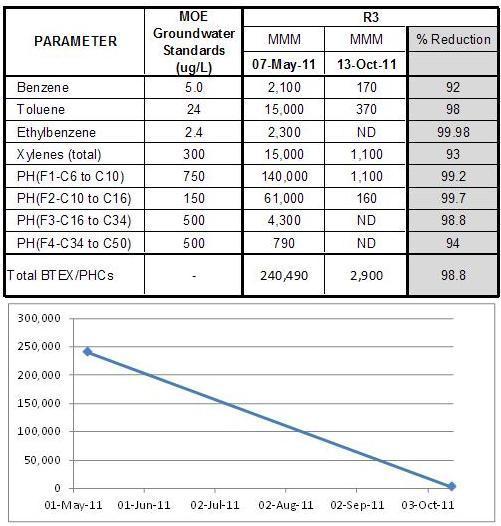
61
62 Case Study Average PHC groundwater reduction across Site = 96% LIF: safe commencement of ISCO MIP: ISCO re-design Zones of high impacts targeted, resulting in excellent treatment