2007/04/21.
|
|
|
- Homer Burns
- 5 years ago
- Views:
Transcription

1 2007/04/21 1
 http://www.gene2drug.com/about/archives.asp?newsid=180")
2 GeneChip Expression Array Design Assay and Analysis Flow Chart Quality Assessment Low Level Analysis (from probe level data to expression value) Software Useful Links and Reference Affymetrix Dominates DNA Microarrays Market (75%~85%)


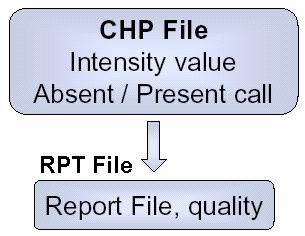
3 Expression Index Matrix of genes (rows) and samples (columns)


4 Expression Index
 http://www.hhmi.org/biointeractive/genomics/video.html http://www.hhmi.org/biointeractive/genomics/animations.")
5 The Structure of a GeneChip Microarray How to Use GeneChip Microarrays to Study Gene Expression Genisphere HHMI (Howard Hughes Medical Institute) DNA Interactive Site from Cold Spring Harbor Labs "Applications", => "Genes and Medicine => "Genetic Profiling" Digizyme - Web & Multimedia Design for the Sciences DNA Microarray Virtual Lab


6 !


7 ! " #
8 $ RNA Sample Quality Control Array Hybridization Quality Control Statistical Quality Control (Diagnostic Plots)


9 % & Assessment of RNA Quality:


10 ' ( ( Saturation: PM or MM cells > Defect Classes: dimness/brightness, high Background, high/low intensity spots, scratches, high regional, overall background, unevenness, spots, Haze band, scratches, crop circle, cracked, cnow, grid misalignment. As long as these areas do not represent more than 10% of the total probes for the chip, then the area can be masked and the data points thrown out as outliers. Haze Band Crop Circles Spots, Scratches, etc. Source: Michael Elashoff (GLGC)
 Model-based analysis of")

11 ' ( () Li, C. and Wong, W. H. (2001) Model-based analysis of oligonucleotide arrays: Expression index computation and outlier detection, Proc. Natl. Acad. Sci. Vol. 98,

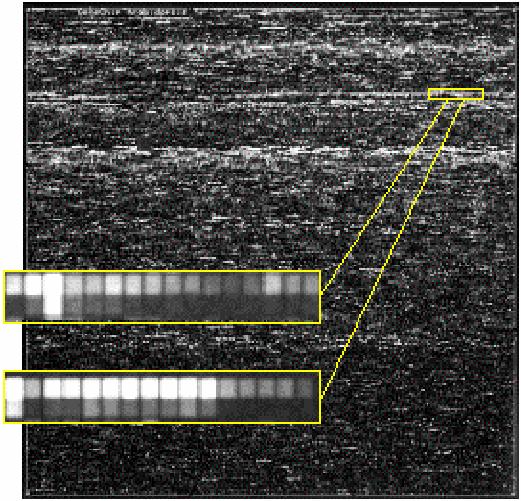
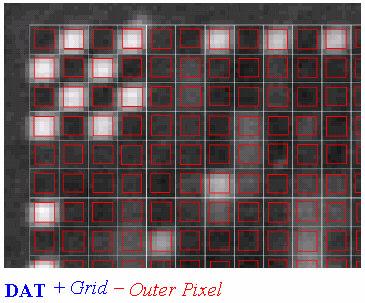
12 * + Make sure the alignment of the grid was done appropriately. Look at the spiked in Oligo B2 control in order to check the hybridization uniformity. The border around the array, the corner region, the control regions in the center, are all checked to make sure the hybridization was successful. Source: Baylor College of Medicine, Microarray Core Facility
13 , - ). %! / )% " The Scaling Factor- In general, the scaling factor should be around three, but as long as it is not greater than five, the chip should be okay. The scaling factor (SF) should remain consistent across the experiment. Average Background: Noise < 4 The measure of Noise (RawQ), Average Background and Average Noise values should remain consistent across the experiment. Percent Present : 30~50%, 40~50%, 50~70%. Low percent present may also indicate degradation or incomplete synthesis.
14 , - ). %! / )% " Sig (3'/5')- This is a ratio which tells us how well the labeling reaction went. The two to really look at are your 3'/5' ratio for GAPDH and B-ACTIN. In general, they should be less than three. Spike-In Controls (BioB, BioC, BioD, Cre)- These spike in controls also tell how well your labelling reaction went. BioB is only Present half of the time, but BioC, BioD, & Cre should always have a present (P) call.


15 , 01 1/2h adjusts the height of each bar so that the total area enclosed by the entire histogram is 1. The area covered by each bar can be interpreted as the probability of an observation falling within that bar. Disadvantage for displaying a variable's distribution: selection of origin of the bins. selection of bin widths. the very use of the bins is a distortion of information because any data variability within the bins cannot be displayed in the histogram. Density Plots

16 , 0* Box plots (Tukey 1977, Chambers 1983) are an excellent tool for conveying location and variation information in data sets. For detecting and illustrating location and variation changes between different groups of data. Further reading: The box plot can provide answers to the following questions: Is a factor significant? Does the location differ between subgroups? Does the variation differ between subgroups? Are there any outliers?


17 , Features of scatterplot. the substantial correlation between the expression values in the two conditions being compared. the preponderance of low-intensity values. (the majority of genes are expressed at only a low level, and relatively few genes are expressed at a high level) Goals: to identify genes that are differentially regulated between two experimental conditions.
18 , ) MA plots can show the intensity-dependant ratio of raw microarray data. x-axis (mean log2 intensity): average intensity of a particular element across the control and experimental conditions. y-axis (ratio): ratio of the two intensities. (fold change) Outliers in logarithm scale spreads the data from the lower left corner to a more centered distribution in which the prosperities of the data are easy to analyze. easier to describe the fold regulation of genes using a log scale. In log2 space, the data points are symmetric about 0.
19 # Background correction (local vs. global) Normalization (baseline array vs. complete data) PM Correction Summarization [Expression Index] (single vs. multiple chips)
20 # Background Methods Normalization Methods PM correction Methods Summarization Methods none rma/rma2 mas quantiles loess contrasts mas pmonly subtractmm avgdiff liwong mas constant medianpolish invariantset Qspline playerout The Bioconductor: affy package
21 * 2 What is background? A measurement of signal intensity caused by auto fluorescence of the array surface and non-specific binding. Since probes are so densely packed on chip must use probes themselves rather than regions adjacent to probe as in cdna arrays to calculate the background. In theory, the MM should serve as a biological background correction for the PM. What is background correction? A method for removing background noise from signal intensities using information from only one chip.
22 3 & 45 Normalization corrects for overall chip brightness and other factors that may influence the numerical value of expression intensity, enabling the user to more confidently compare gene expression estimates between samples. Main idea Remove the systematic bias in the data as completely possible while preserving the variation in the gene expression that occurs because of biologically relevant changes in transcription. Assumption The average gene does not change in its expression level in the biological sample being tested. Most genes are not differentially expressed or up- and down-regulated genes roughly cancel out the expression effect.
23 " & 4 Levels PM&MM, PM-MM, Expression indexes Features All, Rank invariant set, Spike-ins, housekeeping genes. Methods Complete data: no reference chip, information from all arrays used: Quantiles Normalization, MVA Plot + Loess Baseline: normalized using reference chip: MAS 4.0, MAS 5.0, Li-Wong s Model-Based, Qspline
24 & 4 Normalization and Scaling The data can be normalized from: a limited group of probe sets. all probe sets. Global Scaling the average intensities of all the arrays that are going to be compared are multiplied by scaling factors so that all average intensities are made to be numerically equivalent to a preset amount (termed target intensity). Global Normalization the normalization of the array is multiplied by a Normalization Factor (NF) to make its Average Intensity equivalent to the Average Intensity of the baseline array. Average intensity of an array is calculated by averaging all the Average Difference values of every probe set on the array, excluding the highest 2% and lowest 2% of the values.

25 #,, & 4 Loess normalization (Bolstad et al., 2003) is based on MA plots. Two arrays are normalized by using a lowess smoother. Skewing reflects experimental artifacts such as the contamination of one RNA source with genomic DNA or rrna, the use of unequal amounts of radioactive or fluorescent probes on the microarray. Skewing can be corrected with local normalization: fitting a local regression curve to the data.
 Estimation.")
26 PM only make no adjustment to the PM values. Subtract MM from PM This would be the approach taken in MAS 4.0 Affymetrix (1999). It could also be used in conjuntion with the liwong model. Affymetrix: Guide to Probe Logarithmic Intensity Error (PLIER) Estimation. Edited by: Affymetrix I. Santa Clara, CA, ; 2005.
27 ( Summarization Reduce the probe intensities on each array to a single number for gene expression. The goal is to produce a measure that will serve as an indicator of the level of expression of a transcript using the PM (and possibly MM values). The values of the PM and MM probes for a probeset will be combined to produce this measure. Single Chip avgdiff : no longer recommended for use due to many flaws. Signal (MAS5.0): use One-Step Tukey biweight to combine the probe intensities in log scale average log 2 (PM - BG) Multiple Chip MBEI (li-wong): a multiplicative model RMA: a robust multi-chip linear model fit on the log scale
28 " 3 67 MAS5 & PLIER Li-Wong Model RMA
 Estimation Affymetrix: Guide to Probe")
29 , - 8 # ( % Guide to Probe Logarithmic Intensity Error (PLIER) Estimation Affymetrix: Guide to Probe Logarithmic Intensity Error (PLIER) Estimation. Edited by: Affymetrix I. Santa Clara, CA, ; 2005.
 then using them to fit a non-linear relationship between the \"treatment\" and \"baseline\"")
.")
30 # 0& 4 Using a baseline array, arrays are normalized by selecting invariant sets of genes (or probes) then using them to fit a non-linear relationship between the "treatment" and "baseline" arrays. A set of probe is said to be invariant if ordering of probe in one chip is same in other set. Fit the non-linear relation using cross validated smoothing splines (GCVSS). (Li and Wong, 2001) invariant set
31 # 0, 4 (Model-Based Expression Index, MBEI) i: this model computes an expression level on the ith array. SE( ) s and SE( ) s: can be used to identify outlier arrays and probes that will consequently be excluded from the final estimation of the probe response pattern. Outlier array: large SE( i), possibly due to external factors like the imaging process. Outlier probe: large SE( j), possibly due to non-specific cross-hybridization. Single outliers: individual PM-MM differences might also be identified by large residuals compared with the fit. (these are regarded as missing values in the model-fitting algorithm).
32 % 0* 2 RMA: Robust Multichip Average (Irizarry and Speed, 2003): assumes PM probes are a convolution of Normal and Exponential. Observed PM = Signal + Noise O = S + N Exponential (alpha) Normal (mu, sigma) Use E[S O=o, S>0] as the background corrected PM. Ps. MM probe intensities are not corrected by RMA/RMA2.
33 % 0& 4 Quantiles Normalization (Bolstad et al, 2003) is a method to make the distribution of probe intensities the same for every chip. Each chip is really the transformation of an underlying common distribution. The two distribution functions are effectively estimated by the sample quantiles. The normalization distribution is chosen by averaging each quantile across chips.
34 % 0, 4 MedianPolish This is the summarization used in the RMA expression summary Irizarry et al. (2003). A multichip linear model is fit to data from each probeset. The medianpolish is an algorithm (see Tukey (1977)) for fitting this model robustly. Please note that expression values you get using this summary measure will be in log2 scale.

:323-31. Irizarry RA, Wu Z, Jaffee HA.")
35 Cope LM, Irizarry RA, Jaffee HA, Wu Z, Speed TP. A benchmark for Affymetrix GeneChip expression measures, Bioinformatics Feb 12;20(3): Irizarry RA, Wu Z, Jaffee HA. Comparison of Affymetrix GeneChip expression measures. Bioinformatics Apr 1;22(7):
36 , Image Analysis/Normalization Shareware/Freeware Bioconductor (R, Gentleman) DNA-Chip Analyzer (dchip v1.3) (Li and Wong) RMAExpress: a simple standalone GUI program for windows for computing the RMA expression measure. Commercial Affymetrix GeneChip Operating Software (GCOS v1.0) GeneSpring GX v7.3


37 " * 0 The Bioconductor Project Release affypdnn affyplm gcrma makecdfenv

38 " * 0 Quick Start: probe level data (*.cel) to expression measure.


39 & :


40 % Ben Bolstad Biostatistics, University Of California, Berkeley Talks Slides


41 , ; < )+ )< Affymetrix GeneChip Operating Software
< RMA or GC-RMA probe level analysis Advanced Statistical Tools Data")

42 , = > )? )< RMA or GC-RMA probe level analysis Advanced Statistical Tools Data Clustering Visual Filtering 3D Data Visualization Data Normalization (Sixteen) Pathway Views Search for Similar Samples Support for MIAME Compliance Scripting MAGE-ML Export Images from More than 700 papers
.")


43 @ # 2 % Stekel, D. (2003). Microarray bioinformatics, New York : Cambridge University Press. Speed Group Microarray Page: Affymetrix data analysis Statistics and Genomics Short Course, Department of Biostatistics Harvard School of Public Health. Statistics for Gene Expression Bioconductor Short Courses DNA Microarray Data Analysis Microarrays and Cancer: Research and Applications