for monitoring of marine contaminants along the Dalian coasts HUO Chuan-Lin National Marine Environmental Monitoring Center, SOA Dalian, China
|
|
|
- Susan O’Connor’
- 5 years ago
- Views:
Transcription

1 EROD as bioindicator/biomarker for monitoring of marine contaminants along the Dalian coasts HUO Chuan-Lin National Marine Environmental Monitoring Center, SOA Dalian, China October, 2005
2 Outline 1. Brief introduction to Biomarker 2. EROD as biomarker for monitoring marine contaminants along the Dalian coasts 3. Study on other biomarkers (AHH( BPH) 4. Work in the future 2
3 1 Brief Introduction to Biomarker Biomarker, Biological marker What is biomarker? Why biomarker is hot? What biomarkers are available? 3
4 What is biomarker? PAHs Hg Pb PAHs Cu Cr Zn PCB PCDD Cd TBT PCB As Indicator for detecting internal changes induced by exterior stresses Idea from Dr. Seonock Woo 4
5 bioindicator organisms or bioindicator species is used Bioindicators Ecosystem community population individual Biomarkers sub-organismic changes Biomarkers biomarkers or biomarker response : sub-organismic changes occurring at cellular, biochemical, molecular, or physiological levels, that can be measured in cells, body fluids, tissues, or organs within an organism and are indicative of xenobiotic exposure and/or effect. The Final Design Plan for the HOTO Module of GOOS, 2001
6 high Ecological significance Loss of habitats(1) * * Biodiversity decrease(2) * Species distribution change(2) *breeding capacity loss(2) * Bearing lowering(2) * Individual size decrease(1) * Growth rate decrease(3) * Tissues mutation(3) * Negative energy balance(3) (1) (3) difficulty increasing for * Physiological abnormality(1-3) measurement * Cell pathology(1) * Immunity decrease(2) * Behavior change(1) * Biochemistry & cytology indexes(1-2) early Distress signals damage late
7 Why biomarker is hot? Characteristics: SPECIFICITY EARLY-WARNING UNIVERSALITY Advantage: Some biomarkers are very specific in helping to establish cause-and and-effect relationships between an exposure to contaminants and biological responses. Fast Micro level Low-priced 7
8 Biomarkers using in marine biomonitoring Acetylcholinesterase (AchE) Cytochrome P450-1A1 (CYP4501A1) ---7-ethoxyresorufine ethoxyresorufine-o-deethylase (EROD) DNA Adduct formation Other biomarkers such as Metallothionein (MT) 8
9 2 EROD as biomarker for monitoring marine contaminants along the Dalian coasts The study on EROD induction by organic contaminants in the liver of marine benthic fish Paralichthys olivaceus Investigation using EROD activity as biomarker and chemical analysis The 3-year 3 biomonitoring by measurement of EROD activities in fish The hepatic EROD activities analysis by using a fluorescence plate-reader 9
10 Studies on biomarkers focus on MFO of fish Mixing Function Oxygenase (MFO), an electron transport chain, including CYP-450, NADPH CYP-450 reductase & lecithoid Molecular effect early warning indicate AHH EROD induce In general MFO 3 levels Enzyme Activity CYP1A protein mrna High level Respond Substrates & inducer, (PCBs, PAHs & dioxin) Induction can be measured at different levels less reversible and more detrimental
11 Electron transfer and metabolism of substrates by microsomal CYP system catalytic mechanism Bandiera S.M. (2001)
 -1 Pro] Resorufin Preparation of extracts Proteins contents Regressed Liner regression k (slope) Vivisection Tip of liver Homogenating Centrifugating 595nm Spectrophotometer Fluorophotometer")
12 The study on EROD induction by organic contaminants in the liver of marine benthic fish Paralichthys olivaceus CB28 Exposure to CB-28 EROD activity [pmol prod.(min mg) -1 Pro] Resorufin Preparation of extracts Proteins contents Regressed Liner regression k (slope) Vivisection Tip of liver Homogenating Centrifugating 595nm Spectrophotometer Fluorophotometer E X 535nm E M 585nm Supernatant as enzymatic solution Protein analysis By Bradford Analysis of EROD Activity by kinetics fluorophotometry Fluorometry
-1 Pro] Selection of Ex & Em Fluorescence Unit 20.0 18.0 16.0 14.0 12.0 10.0 8.0 6.0 Ex Em 559 585 4.")
13 Rusults Liver Intestines Heart Test organ Kidney Kirby et al. (1999) Gill Muscle EROD activity [pmol prod.(min mg)-1 Pro] Selection of Ex & Em Fluorescence Unit Ex Em Wavelength (nm) 13
14 Influence of butter solution ph on EROD activities Influence of substrate content on EROD activities EROD pmol/(min mg) ph 7.6 phosphate Tris ph EROD pmol/(min mg) µmol/L substrate (µmol/l) Temperature effect on the stability of EROD activities Dependence of EROD activities for NADPH EROD pmol/(min mg) C EROD pmol/(min mg) mmol/L Time(h) NADPH (mmol/l)
15 The relationship between some pollutants and response of EROD activities in Limanda limanda Pollutants Relationship r Pollutants Relationship r Pollutants Relationship r Trace Metal Lindane CB Aldrin CB Arsenic ο.ρ -DDE CB Cadmium Dieldrin CB Copper CB Mercury ο.ρ -DDD CB Zinc ρ.ρ -DDD CB ρ.ρ -DDT CB Pesticide CB PCBs CB α-hch CB HCB CB CB Eggens et al.,
16 Relationship between CB-28 contents and response of EROD activity (dose-effect/dose-response) 400 EROD EROD 活性 (pmol/min/g pmol/(min mg 蛋白 ) ) y = 67.07Ln(x) R= CB-28(μg/L) 16


17 Investigation using EROD activity as biomarker and chemical analysis Investigation Area Test species: Hexagrammos otaki 17


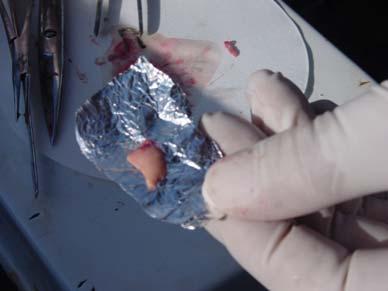
18 Sampling and pretreatment 18


19 19
 PCBs(wet weight) 60 40 20 PCBS/ 10-9 0 小长山三山岛海之韵河口龙王塘")
20 Investigation area and Rusults EROD pmol/(min mg) PCBs(dry weight) PCBs(wet weight) PCBS/ 小长山三山岛海之韵河口龙王塘 0

21 The 3-year biomonitoring by measurement of EROD activities in fish Seasonal variation of EROD activity induction Monitoring area 21


22 22


23 Habitat research for the tested fish 23
 -1 90 80 70 60 50 40 30 20 C1 C2 C3 C4 10 0 May Aug. Oct.")
24 Seasonal variation of EROD activity induction EROD/pmol (min mg) C1 C2 C3 C May Aug. Oct. 24

25 The hepatic EROD activities analysis by using a fluorescence plate-reader The test species, test organ, conditions including sampling principle, sampling time and measuring method for analysis of EROD activity were the same as before. Illustration of Micro-plate with 96 wells 25
26 The hepatic EROD activities analysis of fish by using a fluorescence plate-reader Material and method Plate-reader Exposure to CB-28 EROD activity [pmol prod./(min mg) Pro] Preparation of extracts Proteins contents Regressed Liner regression k (slope) Vivisection Tip of liver Homogenating Centrifugating 595nm Spectrophotometer Fluorophotometer E X 530nm E M 590nm Supernatant as enzymatic solution Protein analysis By Bradford Multiskan Ascent Analysis of EROD Activity by kinetics fluorophotometry Fluoroskan Ascent
27 Influence of enzymatic solution dose on EROD activity Calculation of slop with kinetic measurement data EROD pmol/(min mg Pro Fluorescence Unit y = x R 2 = Enzyme dose (ul) Comparison of the EROD activity measured with the plate reader method and fluorescence spectrophotometry Time (s) EROD Activity pmol/(min mg)pro Fluorometry Plate-reader C1 C2 C3 C4
28 Summary EROD induction was a potential biomarker and feasible indicator of screening contaminants in seawater such as PCB; The results showed the feasibility of using such an indicator in the field either with Kinetics Fluorescence Spectrophotometry or with fluorescence plate-reader; This approach can be a highly informative & cost-effective; The assessment would be more precise using biomarker combining with chemical analysis; It has to be noted that the factors affecting EROD activities in organisms are various; The capability of monitoring contamination by using single biomarker is limited, and a biomarker system should be more persuadable. 28
29 3 Study on other Biomarkers Benzo[a] [a]pyrene hydroxylase (BPH BPH) The study on benzo(a) (a)pyrene hydroxylase (BPH) activity in the marine mussel, as a potential biomarker of contamination by PAHs-type compounds. (SOA youth grant No ) Aryl hydrocarbon hydroxylase (AHH) AHH) The study on Aryl hydrocarbon hydroxylase (BPH) activity for monitoring the marine benthic environment.(soa youth grant No ) 29
30 4 Work in the future Biomarker system Biomarkers can provide a rapid and cost-effective screening tool, which can complement other testing techniques by significantly reducing the number of samples (not for specific evaluation); Thus, biomarker-based techniques have a major role to play in the overall effort of environmental monitoring and protection. Methodology Different levels: Protein level, Gene level, DNA level. 30
31 Scientific and Technical Advisory Panel (STAP) to the Global Environment Facility (GEF) May 2004 The use of bioindicators, biomarkers and analytical methods for the analysis of POPs in developing countries 31
32 The Final Design Plan for the HOTO (Health of the Oceans) Module of GOOS (Global Ocean Observing Systems) 5.2. BIOLOGICAL EFFECTS MEASUREMENTS Molecular and Cellular Biomarkers Cellular Pathology Physiological and Behavioural Responses Population and Community Monitoring 32
33 Biomarker system (focus on POPs) Biomarkers Issues addressed Organism EROD AHH BPH DNA adduct formation AchE Measures induction of enzymes which detoxify planar organic contaminants (e.g., PAHs, planar PCBs, dioxins) Measures induction of enzymes which detoxify PAHs Measures induction of enzymes which detoxify PAHs (BaP) PAHs, Other synthetic organics, e.g., nitro organics, amino triazine pesticides (triazines) Organophosphates (OP) and carbamates or similar molecules, Possibly algal toxins Fish Fish Bivalve molluscs Fish Bivalve molluscs Fish,crustacea, bivalve molluscs 33

34 PCBs Polychlorinated Dibenzodioxins (PCDD) PAHs AHH B(a)P BPH EROD Biomarker system Source: Clean Water Action Plan, USA, 2000


35 Thank you! nmemc.gov.cn 35