Non-covalent or Native Mass Spectrometry. We can ionize intact protein complexes using ESI!!
|
|
|
- Madison Kelly
- 5 years ago
- Views:
Transcription
1 Non-covalent or Native Mass Spectrometry We can ionize intact protein complexes using ESI!!
2 What Can We Learn? Stoichiometry of complex Relative affinity and topology Rates of subunit exchange Assembly pathways
3 Parameters for Non-covalent Mass Spectrometry Generally done with ToF instruments Direct (nanospray) infusion out of volatile buffers (typically ammonium acetate)
4 Displacement of Contaminating Buffer by Competion
5 Effect of Pressure on Spectral Quality Increasing vacuum
6 How Do We Determine Charge State? = m/z
7 How Do We Determine Charge State of a Protein? m/z = (MW + nh + )/n m/z
8 + K d = k off / k on


9 Subunit Exchange in NAD Synthetase A B C 1.0 Heterodimer/ homodimer (RU) Time (min)


10 Portal Motor Packages DNA Into Phage Head
11 Native Mass Spectrometry Can Determine the Stoichiometry of Macromolecular Complexes Phi-29 Portal Complex m/z = 8938 m/(z+1) = 8756 m/(z+2) = 8581 m = 429,052 m/12 = 35,754 Monomer = 35,747
12 Detection of Intermediates and Sub-populations

")
13 Complexes Formed in Vitro Larger Diameters Connector Dodecamers Complexes Number of Particles Connector Connector/Scaffold Complexes Diameter (nm) Negative-stained EM
14 Native Mass Spectrometry Demonstrates Scaffold Binds as a Dimer Scaffolding :Connector at 2:1 Input Ratio 12mer connector + 2 scaffold + 4 scaffold + 6 scaffold
15 Increasing the Scaffolding to Connector Ration Increases the Scaffolding Saturation 2:1 25:1
16 Scaffolding Binds Non-cooperatively with a K d of ~20 µm 0.30 Experimental 15uM connector dimer/ 30uM scaffold dimer 15uM connector dimer/145um scaffold dimer 5uM connector dimer/125um scaffold dimer 0.40 K d = 50 µm # of bound 6 scaffold 8 dimer : K d = 20 µm 10:1 25: K d = 100 µm
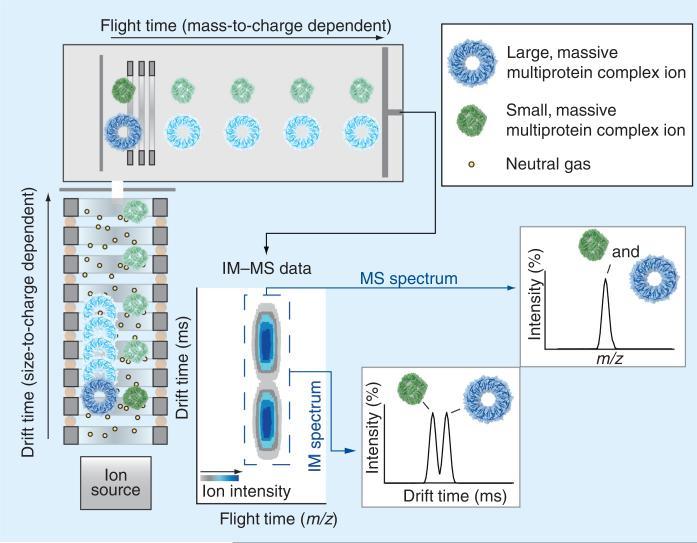
17 Obtaining Shape Information Put a device that separates ions by shape in front of MS (Imagine a size exclusion column) One such device is a drift tube This is a tube filled with gas. The progress of the molecules is retarded as they are buffeted by gas.
18 Ion Mobility Mass Spec (IMS) Provides information about the Size and shape of a molecule In the gas phase
19
20 How do we derive collision cross section from drift time? What good is it? another dimension of separation provide shape information
21 Transthyretin (TTR) Serum carrier of throxine and retinol Tetramer of 55 KDa subunits Misfolding results in systemic amyloidosis Aggregation requires partial unfolding of monomer Thought that stabilizing tetramer would be therapeutic Can one partially unfold and remain tetrameric?
22 IMS Mass Spectrum of Equilibrium Mixture of TTR Tetramer and Octamer Separation of tetramer and octamer Narrow drift time uniform states
23 Increase cone voltage Increased and Broadened drift time
24 Select Tetrameric Species Data and Model Cross-sectional Area 25% unfolded 50 & 30% unfolded folded
25 Direct Measurement of Charge on Complexes (CDMS)
26 Basis of CDMS Ion Trap Analyze individual ions for 95 ms Frequency mass/charge Induced current - charge What is the dynamic range of a single molecule experiment?

27 420 molecules of 46,500 Da = Mda Unknown number of scaffolding protein of mol wt = 35,000 Da
28 Bacteriophage Capsids MDa 112 scaffolding +/ MDa
29 Breakdown of Charge Residue Model? full empty
30 Identification of the Connector/Scaffolding Interface by Chemical Cross-Linking To Locate the Interface on Connector Protein To Obtain Distance Constraint of Interactions

31 Schematic of Crosslinking Experiments.
32 Lysine Reactive DST Cross-Linker DST: Spacer Arm 6.4 Å Lys + Lys Trypsin Digestion Lys Lys Lys Lys Mass: A+B+114 Da

33 DST Cross-Linking Profiles Conn Complex Conn Complex Conn/D Complex Conn/M Scaf/D Scaf/M 200K 123K 80K 36K Conn/D CS2 CS1 Conn/M 15 % SDS-PAGE 7.5 % SDS-PAGE
34 Identification of Scaffolding/Connector Interfaces by Chemical Cross-linking Scaffolding Cross-Linked to Connector 4-5/ * * * NL: 4.59E2 ComplexHigh_FT# RT: AV: 85 T: FTMS + p ESI Full ms [ ] Scaffolding Cross-Linked to Connector * [M+3H] 3+ theo = [M+3H] 3+ exp = Error (ppm) = 1.2 ppm NL: [M+5H] 5+ theo = [M+5H] 5+ exp = Error (ppm) = 2 ppm Peptides were sequenced by MS/MS.

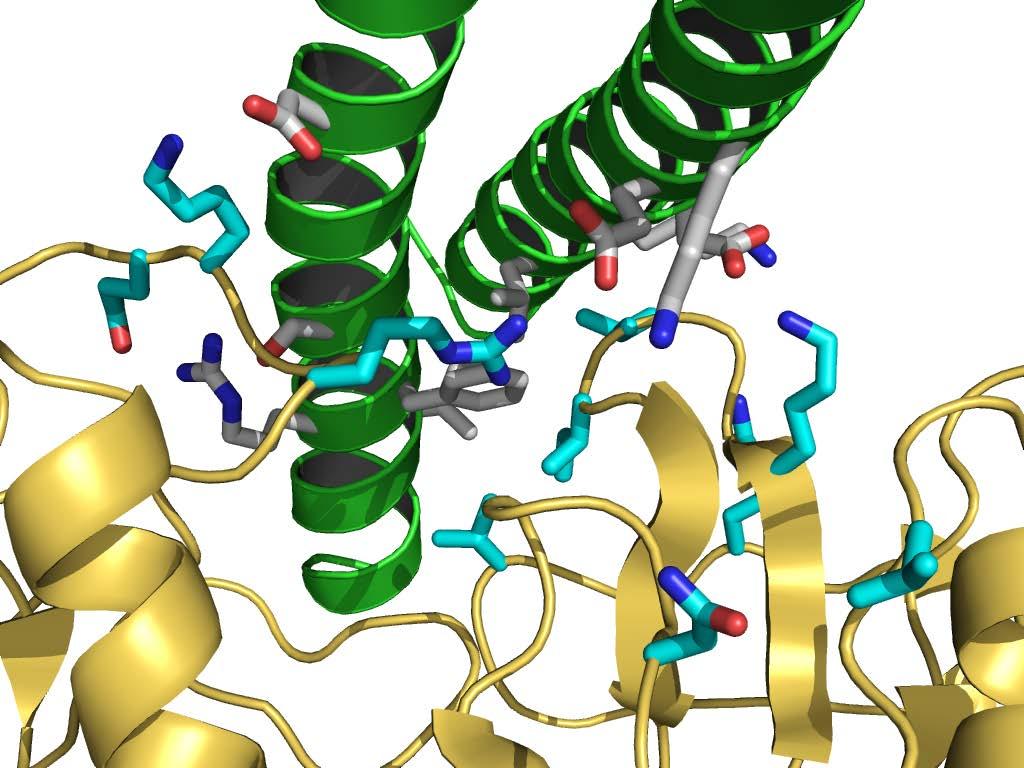
35 Docking Model of Connector/Scaffolding Complexes 1 st step: ZDOCK ( optimize shape complementarity, deslovation, electrostatics) Use entire scaffolding dimer Use connector dimer Block interior surface of connector Generate #2000 models 6.38 Å 2 nd step: filter with SF66-Conn102 cross-link distance constraint Use 8 Å constraint, 26 models Scaffolding orientation Defined by SF83 Conn4/19 cross-link Select model #25 3 rd step: model verification by mutagenesis
36 D59 E114 E56 K52 K67 R69 R110 N43

37 Based on the Model Pairs of Lysines Were Introduced to Alter Complex Stability and Enable Cross-linking Connector Scaffolding Distance K67 D Å N43 K Å R110 E Å E114 R Å L274 K Å % Solubilized Connector Reduced binding 2x 3x 5x WT D59K N43K R110K E114K L274K

38 Loss of Function is Easy!

39 Gain of Function
40 K113 D58
41 Scaffolding D58K Cross-links to Connector K113 within the Distance Range Predicted by the Model D58K Scaffolding Cross-Linked to Wt Connector using DST (6.4 Å) Relative Abundance Peptide was sequenced by MS/MS. Predicted distance D58 to K113 ~3.8 Å. [M+6H] 6+ theo = [M+6H] 6+ exp = Error (ppm) = 3 ppm
42 The Needle in a Haystack is the Challenge for Crosslinking Studies Strategies Enrichment via biotin/strepavidin or size exclusion chromotography Identification Use of deuterated crosslinkers Limitation Lysine Cα-Cα of 30 A Cys-Cys or zero length would be better