Supplementary Figures and Data
|
|
|
- Anissa Tyler
- 5 years ago
- Views:
Transcription
1 Supplementary Figures and Data Whole Exome Screening Identifies Novel and Recurrent WISP3 Mutations Causing Progressive Pseudorheumatoid Dysplasia in Jammu and Kashmir India Ekta Rai 1, Ankit Mahajan 2, Parvinder Kumar 3, Arshia Angural 1, Manoj K Dhar 2, Sushil Razdan 4, Kumarasamy Thangaraj 5, Carol Wise 6, Shiro Ikegawa 7, Kamal Kishore Pandita 8*, Swarkar Sharma 1* Authors Affiliations: 1. Human Genetics Research Group, School of Biotechnology, Shri Mata Vaishno Devi University, Katra, J&K, India 2. School of Biotechnology, University of Jammu, J&K, India 3. Human Genetic Research cum Counselling Centre, University of Jammu, J&K, India 4. 7, Bhagwati Nagar, Jammu, J&K, India 5. Centre for Cellular and Molecular Biology, Hyderabad, A.P, India 6. Texas Scottish Rite Hospital for Children, Dallas, Texas, USA 7. Laboratory for Bone and Joint Diseases, SNP Research Center, RIKEN, Tokyo, Japan 8. Department of Internal Medicine, ASCOMS & Hospitals, Jammu, J&K, India Corresponding Authors Dr. Swarkar Sharma Coordinator, Human Genetics Research Group School of Biotechnology, Shri Mata Vaishno Devi University, Katra, J&K, India Swarkar.sharma@smvdu.ac.in Mobile: Ph: // Ext. 2533, 2385 Dr. Kamal Kishore Pandita Department of Internal Medicine, ASCOMS & Hospitals, Jammu, J&K, India panditakk69@gmail.com Running Title: Whole Exome Sequencing in Skeletal Dysplasia Keywords: Whole Exome Sequencing, Skeletal Dysplasia, PPAC, SEDT-PA, PPD, India
2
3

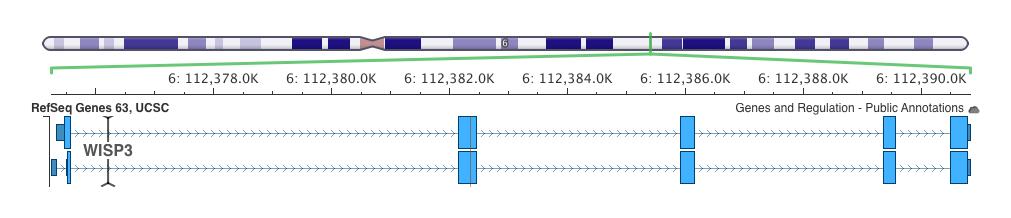

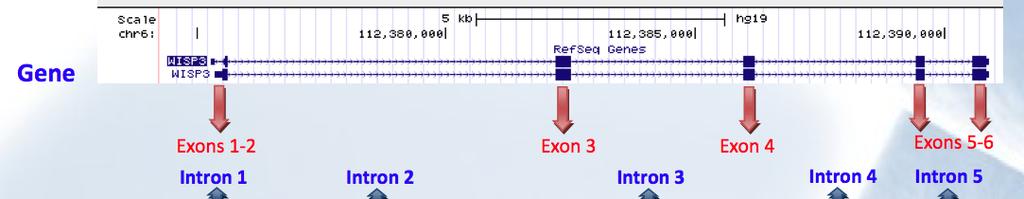
4 Chr$6$
$$ NM_003880.3:c.248G>A,$ NP_003871.1:p.")
5 TGC>TGA$ (RS ):$$ $NM_ :c.156C>A$ NP_ :p.Cys52*$$ GGG>GAG$ (RS )$$ NM_ :c.248G>A,$ NP_ :p.Gly83Glu$
6 VARIATIONS$NP_ :p.Cys52*$(C>A)$AND$$ NP_ :p.Gly83Glu$(G>A)$IN$EXTENDED$FAMILY$1$ C/A$ G/A$ C/A$ G/A$ C/A$ G/A$ Perfect$segregaOon$with$the$disease$in$family$ FAMILY$2$ Both$VariaOons$were$absent$in$2 nd $Family.$

7 (Novel'WISP3&Splice'site'varia0on)'NM_ :c.643+1'G>A' 'IN'EXTENDED'FAMILY'2' Perfect'segrega0on'with'the'disease'

8 (Novel'WISP3&Splice'site'varia0on)'NM_ :c.643+1'G>A' FO'Desmet,'Hamroun'D,'Lalande'M,'CollodKBeroud'G,'Claustres'M,'Beroud'C.'Human'Splicing'Finder:'an'online' bioinforma0cs'tool'to'predict'splicing'signals.'nucleic'acid'research,'2009'
9 Supplementary Information Whole Exome Sequencing Methodology Human Whole Exome Service was performed by SciGenom Labs Private Limited, Kakanad, Cochin, Kerala, India. Exome sequencing Agilent Sureselect v5 kit was used for the exon capture and sequencing was done on Illumina HiSeq 2000 with targeted mean coverage of 100X. A bioinformatics pipeline spanning from alignment, variant calling to variant annotation was used. Bioinformatics analysis pipeline The following bioinformatics steps were performed for preliminary analyses of the data. Read quality check - We checked the following parameters from fastq file. Base quality score distribution Sequence quality score distribution Average base content per read GC distribution in the reads PCR amplification issue Check for over-represented sequences Adapter trimming Based on quality report of fastq files, we trimmed sequence read where necessary to only retain high quality sequence for further analysis. In addition, the low-quality sequence reads were excluded from the analysis. Read alignment The paired-end reads were aligned to the reference human genome Feb release downloaded from UCSC database (GRCh37/hg19). The chromosome fasta file was downloaded from the following website ( The alignment was performed using BWA program (version= r313). Only properly paired aligned reads (based on flagstat summary of samtools) and reads with mapping quality >= 30 were taken further for downstream analysis. Duplicate read removal The aligned reads were first sorted using Picard tool (version 1.85) Sort Sam command and then the read duplicates were removed using Picard MarkDuplicates command. Read realignment After removing duplicate reads the reads were realigned around the known indels from 1000-genome study using GenomeAnalysisTKLite toolkit.

10 The known indels set (Mills_and_1000G_gold_standard.indels.hg19.vcf) was downloaded from GATK resource page. Base recalibration After performing realignment the base re-calibration step was performed. After recalibration, the quality score of each base was more accurate. For details please look into the following website Known variant position (dbsnp_138, Mills_and_1000G_gold_standard) was taken into account to recalibrate the quality score. Variant calling After performing realignment, we used GenomeAnalysisTKLite toolkit UnifiedGenotyper to identify single nucleotide variants (SNPs) and short Indels. After calling the variants, we further filtered variants in order to retain good quality (depth, variant score and others) variants. Variant annotation and comparison The identified variants were annotated using in-house program (VariMAT) at SciGenom Pvt. Ltd. The gene model used for annotation was downloaded from Ensembl database Release 75 (ftp://ftp.ensembl.org/pub/release-75/gtf/homo_sapiens). Supplementary Figure 6: Bioinformatics analysis pipeline

11 Analysis results. Data summary The sequencing of the sample on Illumina HiSeq 2000 provided us more than 90 million reads for each sample. Total data generated for the each sample was more than 8 Gb. Approximately around 90% of data was greater than or equal to Q30 Phred score. Alignment & Filter The overall alignment summary is shown in Table 1. Overall, more than 99% of the total reads aligned to the reference genome for each sample. After filtering the alignment for mapping quality, insert size estimates and cross mapping read more than 96% passes the alignment filer. More than 98% of the passed mapped reads in all samples have Q60 score, which reflects very good alignment quality (Supplementary Figure 7). Insert size distribution from filtered aligned reads, is shown in Supplementary Figure 8. The percentage duplicate reads per chromosome is shown in Supplementary Figure 9. Less than 1% of reads out of aligned reads are duplicated in the chromosomes for all three samples. Supplementary Figure 7: Mapping quality distribution for aligned reads
12 Supplementary Figure 8: Insert-size distribution of the aligned reads Table 1: Read alignment summary Total Reads Total aligned (%) Total passed alignment (%) Total Failed alignment (%) VDU AR08 90,333, VDU AR09 93,840, VDU AR15 87,287,

13 Supplementary Figure 9: Percentage duplicate reads per chromosome Variant calling The variant calling was performed using GATK-Lite program. After identification the variants were filtered out. The main criteria for accepting the variants as good quality were: Min. Read Depth >= 10; Variant Quality >= 50; Variant not in SNP cluster; Multimapped read< 5. The variants were called using the complete reference genome, later we filtered the variants only for the targeted genomic regions based on the kit used (Agilent Sure Select V5) library preparation. The filter passed variants are provided in Table 2. The variant depth, quality and variant minor allele frequency distribution is provided in Supplementary Figure respectively. The indel base distribution is provided in Supplementary Figure 13. For majority of the indels 1-bp was either deleted or inserted with respect to the reference genome.

14 Table 2: Summary of variant identified VDU AR08 VDU AR09 VDU AR15 TOTAL 43,907 44,350 42,937 VARIANTS TOTAL 40,795 41,174 39,896 SNPs TOTAL 3,112 3,176 3,041 INDELs TOTAL 26,300 26,739 24,979 HET TOTAL 17,607 17,611 17,958 HOM Ts/Tv Supplementary Figure 10: Read depth distribution of the identified variants in the sample. The legend represent variant read depth

15 Supplementary Figure 11: Quality distribution of the identified variants in the sample. The legend represents variant quality score Supplementary Figure 12: Variant minor allele frequency distribution for all samples
16 Supplementary Figure 13: Distribution of insertion and deletion base length Variant annotation The identified variants were annotated and annotation summary of filtered SNPs and Indels based on the targeted genomic regions (based on the kit used for the library preparation) is provided in Tables 3 and shown in Supplementary Figure 14. Out of total variants identified, ~98% were present inside gene region. Approx. 63% of the SNPs and Indels fall in the exonic region. The total variants identified in different variant classes are provided in Table 4, also shown in Supplementary Figure 15.
17 Table 3: Annotation summary of variants VDU AR08 VDU AR09 VDU AR15 Intergenic InsideGene 43,360 43,853 42,377 Exonic 27,632 27,833 26,976 Intronic 15,728 16,020 15,401 Exonic-CDS 20,797 21,057 20,328 Exonic-5UTR 1,194 1,262 1,151 Exonic-3UTR 1,582 1,567 1,551 Exonic-PC_ncRNA 2,573 2,501 2,510 Exonic-ncGene 1,486 1,446 1,436 Intronic- 3SPLICE_SITE 1,076 1,093 1,036 Intronic- 5SPLICE_SITE Intronic-Others 13,835 14,114 13,561 Supplementary Figure 14: Distribution of all identified SNPs and Indels in the samples

18 Table 4: Functional prediction of coding variants VariantClass VDU AR08 VDU AR09 VDU AR15 Silent 9,318 9,446 9,066 Missense 10,776 10,904 10,578 Nonsense Startloss Stoploss Frameshift-indel Inframe-indel Supplementary Figure 15: Distribution of coding variants