Bioinformatics (Lec 19) Picture Copyright: the National Museum of Health
|
|
|
- Jessica Richardson
- 5 years ago
- Views:
Transcription
1 3/29/05 1 Picture Copyright: the National Museum of Health

2 PCR 3/29/05 2

3 Schematic outline of a typical PCR cycle Target DNA Primers dntps DNA polymerase 3/29/05 3
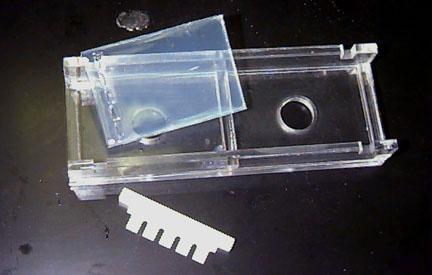
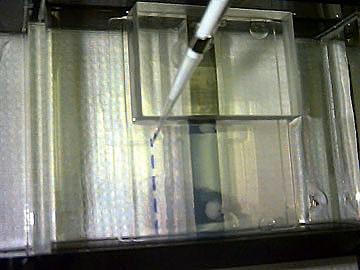
4 Gel Electrophoresis Used to measure the lengths of DNA fragments. When voltage is applied to DNA, different size fragments migrate to different distances (smaller ones travel farther). 3/29/05 4

5 Gel Pictures 3/29/05 5
6 Gel Electrophoresis: Measure sizes of fragments The phosphate backbone makes DNA a highly negatively charged molecule. Thus DNA can be fractionated according to its size. Gel: allow hot 1 % solution of purifed agarose to cool and solidify/polymerize (like Jello). DNA sample added to wells at the top of a gel and voltage is applied. Larger fragments migrate through the pores slower. Proteins can be separated in much the same way, only acrylamide is used as the crosslinking agent. Varying concentration of agarose makes different pore sizes & results. 3/29/05 6
7 Gel Electrophoresis 3/29/05 7

8 Gel Electrophoresis 3/29/05 8
9 3/29/05 9
10 Sequencing a Fragment Using Gels Isolate the desired DNA fragment. Using the starving method obtain all fragments that end in A, C, G, T Run gel with 4 lanes and read the sequence 3/29/05 10
11 Application of Gels: Sequencing GCCAGGTGAGCCTTTGCA A C G T 3/29/05 11

12 2D-Gels 3/29/05 12

13 2D Gel Electrophoresis 3/29/05 13
14 2D-Gels First Dimension Methodology of a 2D Gel: Denatured cell extract layered on a glass tube filled with polyacrylamide saturated with solution of ampholytes, a mixture of polyanionic[(-) charged] and polycationic [(+) charged] molecules. When placed in an electric field, the ampholytes separate and form continuous gradient based on net charge. Highly polyanionic ampholytes will collect at one end of tube, highly polycationic ampholytes will collect at other end. Gradient of ampholytes establishes ph gradient. Charged proteins migrate through gradient until they reach their pi, or isoelectric point, the ph at which the net charge of the protein is zero. This resolves proteins that differ by only one charge. Entering the Second Dimension: Proteins that were separated on IEF gel are next separated in the second dimension based on their molecular weights. The IEF gel is extruded from tube and placed lengthwise in alignment with second polyacrylamide gel slab saturated with SDS. When an electric field is imposed, the proteins migrate from IEF gel into SDS slab gel and then separate according to mass. Sequential resolution of proteins by their charge and mass can give excellent separation of cellular proteins. As many as 1000 proteins can be resolved simultaneously. *Some information was taken from Lodish et al. Molecular Cell Biology. 3/29/05 14

15 2D-gels Comparing Proteomes For Differences in Protein Expression Comparing Different Sample Types For Changes in Protein Levels 3/29/05 15

16 Mass Spectrometry 3/29/05 16
17 Mass Spectrometry Mass measurements By Time-of-Flight Pulses of light from laser ionizes protein that is absorbed on metal target. Electric field accelerates molecules in sample towards detector. The time to the detector is inversely proportional to the mass of the molecule. Simple conversion to mass gives the molecular weights of proteins and peptides. Using Peptide Masses to Identify Proteins: One powerful use of mass spectrometers is to identify a protein from its peptide mass fingerprint. A peptide mass fingerprint is a compilation of the molecular weights of peptides generated by a specific protease. The molecular weights of the parent protein prior to protease treatment and the subsequent proteolytic fragments are used to search genome databases for any similarly sized protein with identical or similar peptide mass maps. The increasing availability of genome sequences combined with this approach has almost eliminated the need to chemically sequence a protein to determine its amino acid sequence. 3/29/05 17
18 Genomics Study of all genes in a genome Gene Expression Microarray experiments & analysis Probe design (CODEHOP) Array image analysis (CrazyQuant) Identifying genes with significant changes (SAM) Clustering 3/29/05 18
19 Comparative Genomics Comparison of whole genomes. Whole genome sequencing Whole genome annotation & Functional genomics Whole genome comparison PipMaker, MultiPipMaker, EnteriX: PipMaker uses BLASTZ to compare very long sequences (> 2Mb); Mummer: used for comparing long microbial sequences (uses Suffix trees!) Many more! 3/29/05 19
20 Proteomics Study of all proteins in a genome, or comparison of whole genomes. Whole genome annotation & Functional proteomics Whole genome comparison Protein Expression: 2D Gel Electrophoresis 3/29/05 20

21 3/29/05 21
22 Gene Networks & Pathways Genes & Proteins act in concert and therefore form a complex network of dependencies. 3/29/05 22
23 Pathway Example from KEGG Staphylococcus aureus 3/29/05 23
24 Pseudomonas aeruginosa 3/29/05 24
25 STSs and ESTs Sequence-Tagged Site: short, unique sequence Expressed Sequence Tag: short, unique sequence from a coding region 1991: 609 ESTs [Adams et al.] June 2000: 4.6 million in dbest Genome sequencing center at St. Louis produce 20,000 ESTs per week. 3/29/05 25
26 What Are ESTs and How Are They Made? Small pieces of DNA sequence (usually nucleotides) of low quality. Extract mrna from cells, tissues, or organs and sequence either end. Reverse transcribe to get cdna (5 EST and 3 EST) and deposit in EST library. Used as "tags" or markers for that gene. Can be used to identify similar genes from other organisms (Complications: variations among organisms, variations in genome size, presence or absence of introns). 5 ESTs tend to be more useful (cross-species conservation), 3 EST often in UTR. 3/29/05 26
27 DNA Markers Uniquely identifiable DNA segments. Short, <500 nucleotides. Layout of these markers give a map of genome. Markers may be polymorphic (variations among individuals). Polymorphism gives rise to alleles. Found by PCR assays. 3/29/05 27
28 Polymorphisms Length polymorphisms Variable # of tandem repeats (VNTR) Microsatellites or short tandem repeats Restriction fragment length polymorphism (RFLP) caused by changes in restriction sites. Single nucleotide polymorphism (SNP) Average once every ~100 bases in humans Usually biallelic dbsnp database of SNPs (over 100,000 SNPs) ESTs are a good source of SNPs 3/29/05 28
29 SNPs SNPs often act as disease markers, and provide genetic predisposition. SNPs may explain differences in drug response of individuals. Association study: study SNP patterns in diseased individuals and compare against SNP patterns in normal individuals. Many diseases associated with SNP profile. 3/29/05 29