Lecture 7: 9/7. CHAPTER 7 Kinetics and Regulation
|
|
|
- Erin Hart
- 5 years ago
- Views:
Transcription
1 Lecture 7: 9/7 CHAPTER 7 Kinetics and Regulation
2

3 Chapter 7 Outline
4 The rate or velocity of an enzymatic reaction Consider a simple reaction: The velocity or rate of the reaction is determined by measuring how much A disappears as a function of time or how much B appears as a function of time. Suppose that we can readily measure the disappearance of A. The velocity of the reaction is given by the formula below, where k is a proportionality constant. When the velocity of a reaction is directly proportional to reactant concentration, the reaction is called a first order reaction and the proportionality constant has the units s 1.
5 Many important biochemical reactions are biomolecular or second order reactions. or The rate equations for these reactions are: and The proportionality constant for second order reactions has the units M 1 s 1.
6 A common means of investigating enzyme kinetics to measure velocity as a function of substrate concentration with a fixed amount of enzyme. Consider a simple reaction in which the enzyme E catalyzes the conversion of S P. with k 1, k 2 being the rate constant for the indicated reaction steps. So as to ignore the reverse reaction of P S, we measure activity when [P] 0. Under these conditions, the velocity is called the initial velocity or V o.
7 Reaction velocity versus substrate concentration in an enzyme catalyzed reaction An enzyme catalyzed reaction approaches a maximal velocity when the enzyme is saturated with substrate.
8 The initial velocity is determined by measuring product formation as a function of time, and then determining the velocity soon after the reaction has started.
9 Determining initial velocity The amount of product formed at different substrate concentrations is plotted as a function of time.
10 Leonor Michaelis and Maud Menten derived an equation to describe the initial reaction velocity as a function of substrate concentration. where and When V o = ½ V max, K M =[S]. Thus, K M is the substrate concentration that yields ½ V max.
11 Michaelis Menten kinetics A plot of the reaction velocity, V 0, as a function of the substrate concentration, [S], for an enzyme that obeys Michaelis Menten kinetics shows that the maximal velocity, V max, is approached asymptotically. The Michaelis constant, K M, is the substrate concentration yielding a velocity of V max /2.
12 [S]/Km=?
13 Two enzymes play a key role in the metabolism of alcohol.
14 Some people respond to alcohol consumption with facial flushing and rapid heart beat, symptoms caused by excessive amounts of acetaldehyde in the blood. There are two different acetaldehyde dehydrogenases in most people, one with a low K M and one with a high K M. The low K M enzyme is inactivated in susceptible individuals. The enzyme with the high K M cannot process all of the acetaldehyde, and so some acetaldehyde appears in the blood.


15
16 The Michaelis Menten equation can be manipulated into one that yields a straight line plot. This double reciprocal equation is called the Lineweaver Burke equation.
17 y=mx+b X axis Y axis
18 A double reciprocal, or Lineweaver Burk, plot y=mx+b

19 K M values for enzymes vary widely and evidence suggests that the K M value is approximately the substrate concentration of the enzyme in vivo.
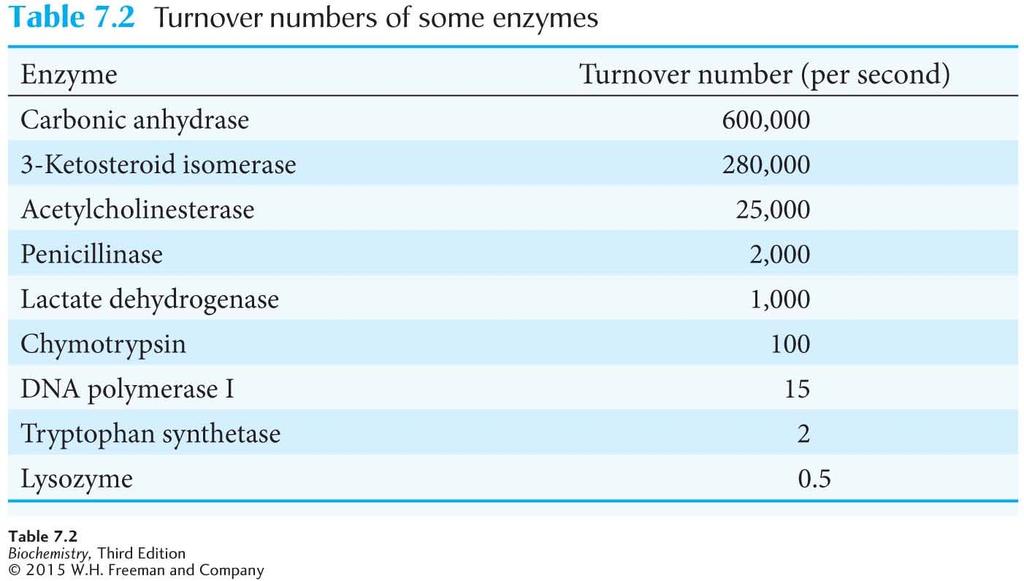
20 If the enzyme concentration, [E] T, is known, then and K 2, also called k cat, is the turnover number of the enzyme, which is the number of substrate molecules converted into product per second.
21
22 If [S]<<K M, we can assume that free enzyme [E] [E] T. The Michaelis Menten equation can be manipulated to yield: Under these conditions, is a measure of catalytic efficiency because it takes into account both the rate of catalysis (k cat ) and nature of the enzyme substrate interaction (K M ).
23
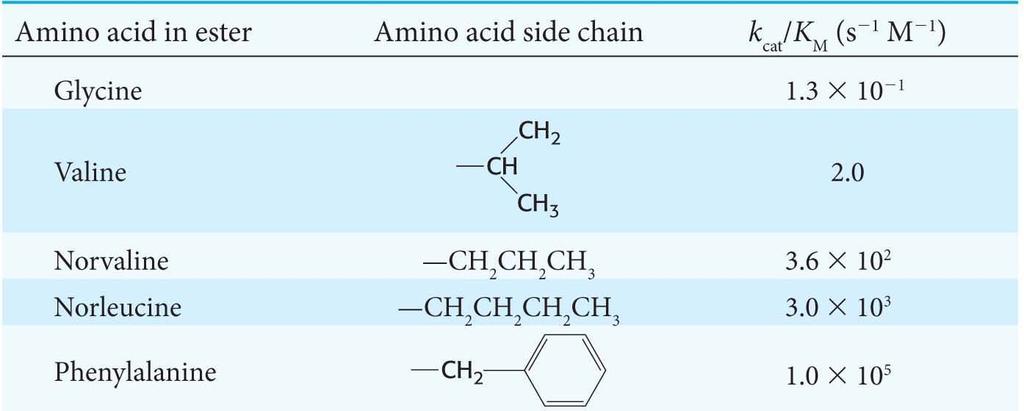
24 Examination of the k cat /K M ratio reveals that some enzymes approach catalytic perfection. Expanding the equation for k cat /K M shows that k 1, the rate of formation of the enzymesubstrate complex, is the rate limiting step. Diffusion ( s 1 M 1 ) limits the value of k 1. Yet, the k cat /K M of some enzymes approaches the rate of diffusion.
25 Multiple substrate reactions can be divided into two groups. Sequential reactions are characterized by formation of a ternary complex consisting of the two substrates and the enzyme. Double displacement reactions are characterized by the formation of a substituted enzyme intermediate. Double displacement reactions are also called ping pong reactions.
26
27 or ping pong reactions
28 Allosteric enzymes control the flux of biochemical reactions in metabolic pathways. Because of their regulatory properties, allosteric enzymes allow for the generation of complex metabolic pathways.
29
30
31 The conversion of A to B is the committed step, because once this occurs, B is committed to being converted into F. Allosteric enzymes catalyze the committed step of metabolic pathways. Michaelis Menten enzymes facilitate the remaining steps.
32 The amount of F synthesized can be regulated by feedback inhibition. The pathway product F inhibits enzyme e 1 by binding to a regulatory site on the enzyme that is distinct from the active site.
33 The regulation of metabolic pathways can be quite complex. Allosteric enzymes may be inhibited or stimulated by several regulatory molecules.
34
35 The reaction velocity of allosteric enzymes displays a sigmoidal relationship to substrate concentration.
36 Kinetics for an allosteric enzyme
37 All allosteric enzymes display quaternary structure with multiple active sites and regulatory sites. One model that explains the behavior of allosteric enzymes is the concerted model. Features of the concerted model: 1. The enzyme exists into two different quaternary structures, designated T(tense) and R (relaxed). 2. T and R are in equilibrium, with T being the more stable state. 3. The R state is enzymatically more active than the T state. 4. All active sites must be in the same state.
38 The binding of substrate to one active site traps the other active sites in the R state and removes the substrate bound enzyme from the T< >R equilibrium. This disruption of the T< >R equilibrium by the binding of substrate favors the conversion of more enzymes to the R state.
39 The concerted model for allosteric enzymes
40 Allosteric enzymes are more sensitive to changes in substrate concentration near their K M values than are Michaelis Menten enzymes. This sensitivity is called the threshold effect.
41 Allosteric enzymes display threshold effects
42 Allosteric regulators disrupt the R< >T equilibrium when they bind the enzyme. Inhibitors stabilize the T state while activators stabilize the R state. The disruption of the T< >R equilibrium by substrates is called the homotropic effect. The disruption of the T< >R equilibrium by regulators is called the heterotrophic effect.
43
44
45 The sequential model for allosteric enzymes proposes that subunits undergo sequential changes in structure. The sequential model
46 Phosphoribosylpyrophosphate synthetase (PRS) is an allosteric enzyme in the purine nucleotide synthesis pathway. A mutation leading to the loss of regulatory control without an effect on catalytic activity leads to the overproduction of purine nucleotides. The overproduction results in the painful disease gout.


47
48 Studies of individual enzyme molecules suggest that some enzymes may exist in multiple conformations that are in equilibrium. These different conformations may have different catalytic or regulatory properties.

49 Single molecule studies can reveal molecular heterogeneity This figure shows an enzyme that display molecular heterogeneity. Each form represent the fraction of the total enzyme population. That means that an enzyme with three forms that catalyze the same reaction but different rates.
50 A schematic View of Enzyme Activity in Ensemble Studies Enzyme activity under a set of conditions with an assumption that all the enzyme molecules are the same or similar.
51 A schematic View of Single Molecule Experiment Each peak represents a different kind of molecular forms of enzyme
52 Lecture 8: 9/9 CHAPTER 8 Mechanisms and Inhibitors