Electronic Supplementary Information
|
|
|
- Clementine Logan
- 5 years ago
- Views:
Transcription
1 Electronic Supplementary Material (ESI) for Integrative Biology. This journal is The Royal Society of Chemistry 2015 Electronic Supplementary Information Table S1. Definition of quantitative cellular features measured This table describes and classifies quantitative cell migration system properties that are discussed/analyzed in this study. Variables are alternatively classified according to: Variable Class (Cell Intensity, Cell Dynamics, Cell Morphology, CMAC Dynamics, CMAC Intensity, CMAC Localization, CMAC Morphology, Colocalization); Spatial Scaling (Cellular, CMAC population per Cell, Individual CMAC); and Temporal Scaling (Instantaneous, CMAC Lifetime, Cell Lifetime, End-point). Exact variable names are listed along with General variable names, with the latter typically used in text and figures to aid readability. For each property, corresponding units and a concise description are also included. Additional terms are defined above the main table. Figure S1. Expression of endogenous adhesion complex components is unchanged in H1299 cells overexpressing EGFP-paxillin and RubyRed-LifeAct In H1299 cells stably transfected with both EGFP-paxillin and RubyRed-LifeAct, immunoblotting was used to assess the expression of a number of endogenous cell-matrix adhesion complex components, as indicated. The parental cell line is labeled as H1299 and the double-stable clone is marked as H1299 P/L. Blotting for α-tubulin was used as a loading control. Figure S2. Talin labeling optimization and specificity The talin immunofluorescent labeling protocol used herein was optimized to preserve the total talin population - in both the cell-matrix adhesion complexes (CMACs) and the cytoplasm. This contrasts with commonly used labeling of adhesion complexes, which extract and washout the cytoplasmic pool. (A) Upper panel: in order to retain cytoplasmic talin, cells were fixed with 2% PFA and subsequently permeabilized with 0.1% Triton-X-100. Because cytoplasmic talin is retained, talin labeling in adhesions is less distinct. Lower panel: the anti(α)-talin antibody (8d4) labels cell-matrix adhesions using the standard simultaneous fixation (2% PFA) and permeabilization (0.1% Triton) protocol, where cytoplasmic proteins are extracted and washed-out to emphasize the visibility of CMAC-associated proteins. Note the colocalization of talin labeling with EGFP-paxillin (right). The colocalization panel was adjusted for contrast and brightness, for better visibility. Scale bars: 10 µm.
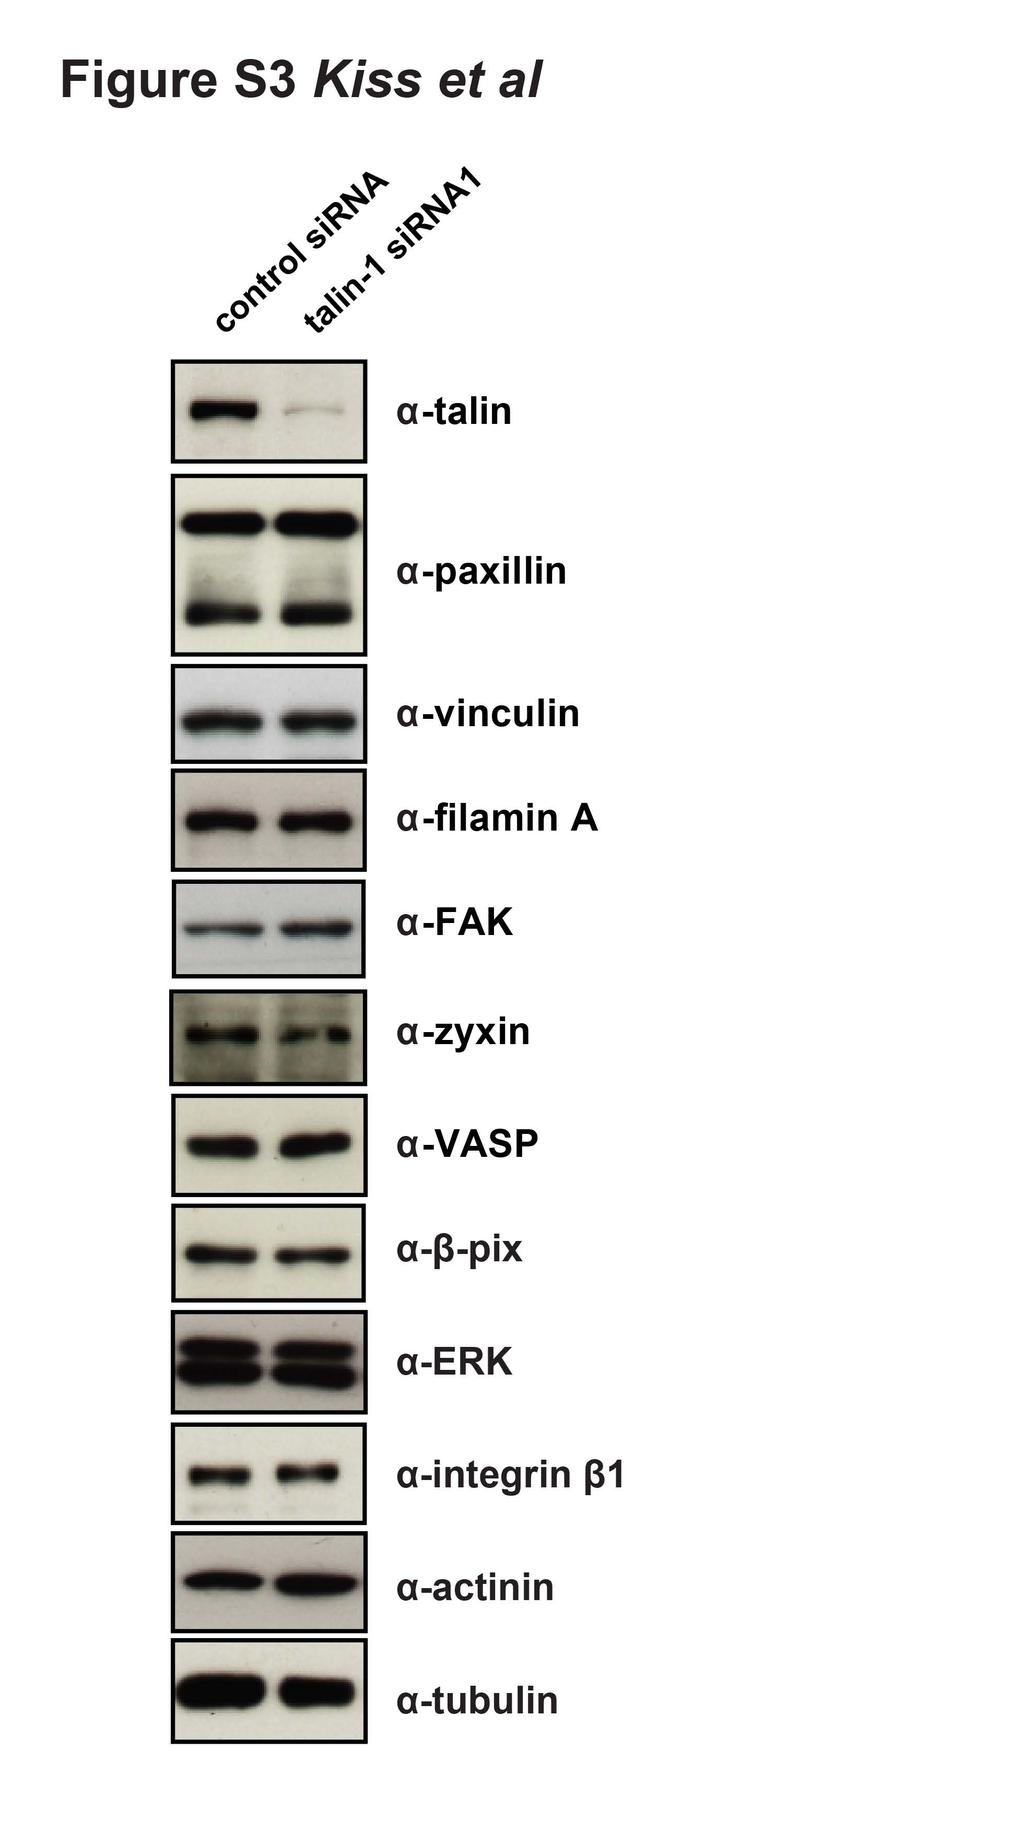
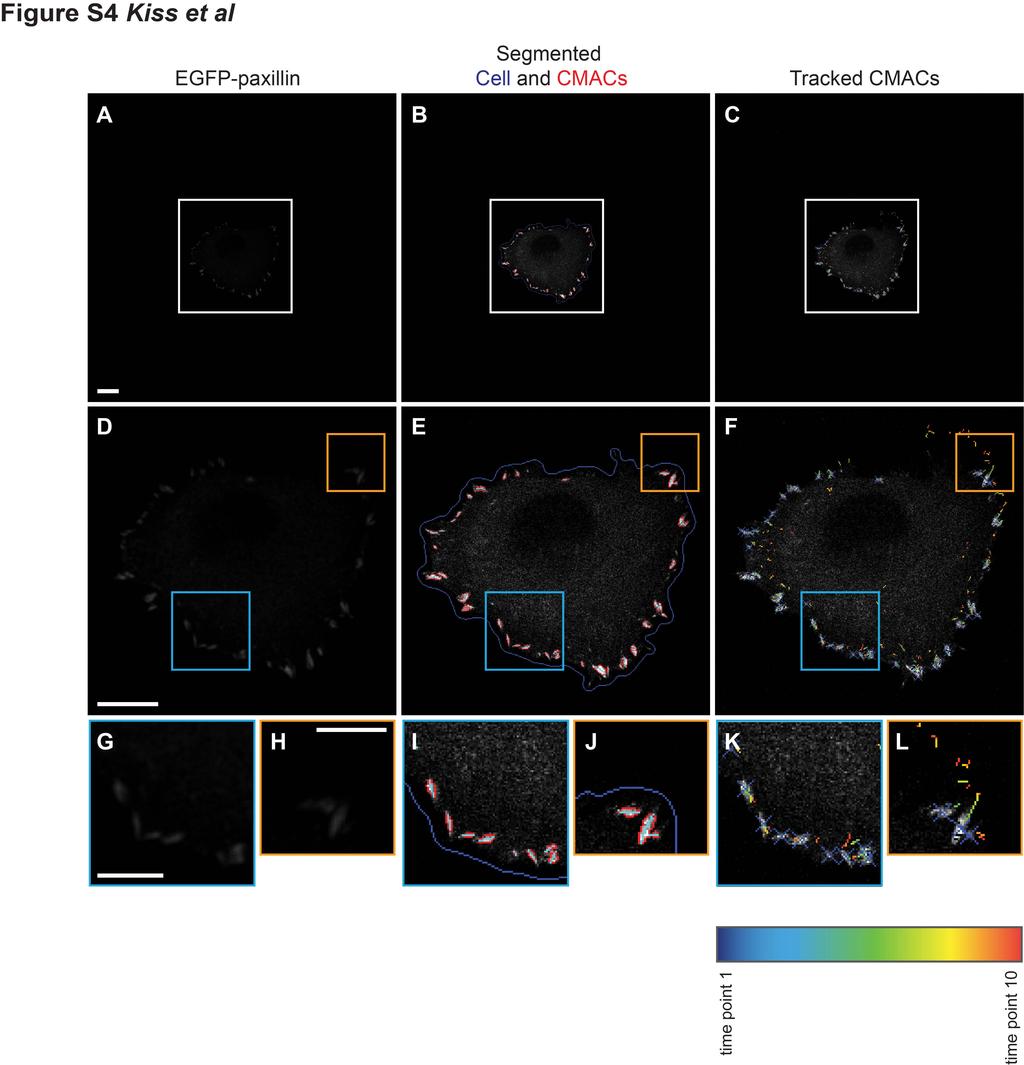
2 (B) Labeling using the secondary antibody only (Alexa 647-conjugated goat anti-mouse) confirmed the specificity of the talin antibody under the optimized, non-extractive conditions described above. Note the differences in EGFP-paxillin and talin signal between control sirna and talin-1 sirna1 treated cells, and the lack of signal in the secondary antibody only labeling. Intensities in the four anti-talin and no anti-talin channels were rescaled identically to enhance visibility (maxima set to 68 of 256 grey values). Scale bars: 10 µm. (C) We determined per cell talin expression-level as the mean talin pixel intensity value of the cell. Intensity values from the talin channel were normalized to the median talin intensity value of the control sirna-treated cell population. Quantification of the standardized talin intensity values in control and talin-1 sirna1-treated cells labeled with or without primary anti-talin antibody revealed significant differences both between treatments (control sirna vs. talin-1 sirna1) and labelings (talin antibody vs. secondary antibody only). Notably, using the secondary antibody labeling only, cell talin intensity was not significantly different between control and talin-1 knockdown cells. In box plots, red lines display the medians; blue boxes show the interquartile range (IQR), notches on the boxes indicate 95% confidence intervals for the median, whiskers mark the adjacent values of Q1-1.5(IQR) and Q3+1.5(IQR), respectively. Q1: lower quartile, Q3: upper quartile. ***: p-values < 0.001, obtained from Wilcoxon rank-sum tests. Number of cells: control sirna: 24 cells, talin-1 sirna1: 28 cells, control sirna secondary antibody only: 24 cells, talin-1 sirna1 secondary antibody only: 35 cells Figure S3. Talin knockdown did not alter expression of other adhesion complex components Expression levels of the indicated cell-matrix adhesion complex components were compared by immunoblotting in control and talin-1 sirna1-treated H1299 cells. Blotting for α-tubulin was used as loading control. Figure S4. Imaging, segmentation and tracking of migrating cells and their cell-matrix adhesion complexes Complete field images of EGFP-paxillin (left panel), cell and cell-matrix adhesion complex (CMAC) segmentation of the same cell (middle panel), and CMAC tracks color-coded for the last 10 time points (right panel) are shown. Cells expressing EGFP-paxillin (images: A, enlarged in D from white box in A, enlarged in G and H from blue and orange boxes in D) and RubyRed-LifeAct were imaged for 6 h at 5 min intervals (Movie S1, left). CMACs were segmented based on EGFP-paxillin signals (red outlines in B and enlarged in E from white box in B, and further enlarged in I, J from blue and orange boxes in E, Movie S1, right); cells were segmented based on RubyRed-LifeAct signals (blue outlines in B, E, I and J). Cells and CMACs were tracked via nearest neighbor analysis. CMAC tracking differentiates stationary
3 adhesions (F, enlarged in K from cell front (blue box) in F) from sliding adhesions (F, enlarged in L from cell rear (orange box) in F). CMAC tracking line color denotes track age from 1 to 10 time points. Scale bars: 10 µm (A-F); 5 µm (G-L). Blue crosses in C, F, K and L mark the current centroids of tracked CMACs. Figure S5. Different talin-1 sirnas have comparable effects on cellular properties In cells transfected with control sirna or two different sirnas against talin-1, talin expression-levels were analyzed by immunoblotting (A) and also measured by immunofluorescence microscopy of single cells following their imaging during live random migration (B). Properties describing CMAC paxillin content (C), rate of CMAC paxillin intensity change (D), rate of CMAC area change (E), CMAC distance from cell border (F), CMAC paxillin-f-actin colocalization (G), and cell compactness (H) were extracted in an automated fashion using PAD software (see Materials and Methods). All properties from talin-1 sirna1- and sirna2-treated cells were standardized to the median property values of the control sirna-treated cells, per experiment, except in D and E. In box plots, red lines display the medians; blue boxes show the interquartile range (IQR), notches on the boxes indicate 95% confidence intervals for the median, whiskers mark the adjacent values of Q1-1.5(IQR) and Q3+1.5(IQR), respectively. Q1: lower quartile, Q3: upper quartile. ***: p<0.001 obtained from Wilcoxon rank-sum tests. Number of observations: control sirna: 7833, talin-1 sirna1: 8844, talin-1 sirna2: Figure S6. Reproducibility of talin-1 knockdown effects between experimental repeats (A) Probability density functions showing distributions of talin expression-level in control sirna- and talin-1 sirna1-treated cells, color-coded by treatment and experimental repeats from the seven biological replicates used in this study (Exp. 1-7). Per cell talin intensity values were normalized to the median talin expression value (1) of the control sirna-treated cell population, per experiment. Note the overlap of talin intensity values between control and knockdown cell populations. (B-H) Comparison of control sirna- and talin-1 sirna1-treated cell populations in each experimental repeat shows reproducible effects of talin knockdown across the 7 experiments. Y-axes display median property values of control sirna- and talin-1 sirna1-treated cell populations, following standardization to the median values of the control cells (except in D- E, where the original property values are shown). Circles show the median values, error bars correspond to 95% confidence intervals of the medians. Different colors represent the different experimental repeats (see legend at upper right). All measured variables in all experiments of talin-1 sirna1 treated cells were statistically discernible from control (p < according to Wilcoxon rank-sum test), with the exception of rate of CMAC paxillin
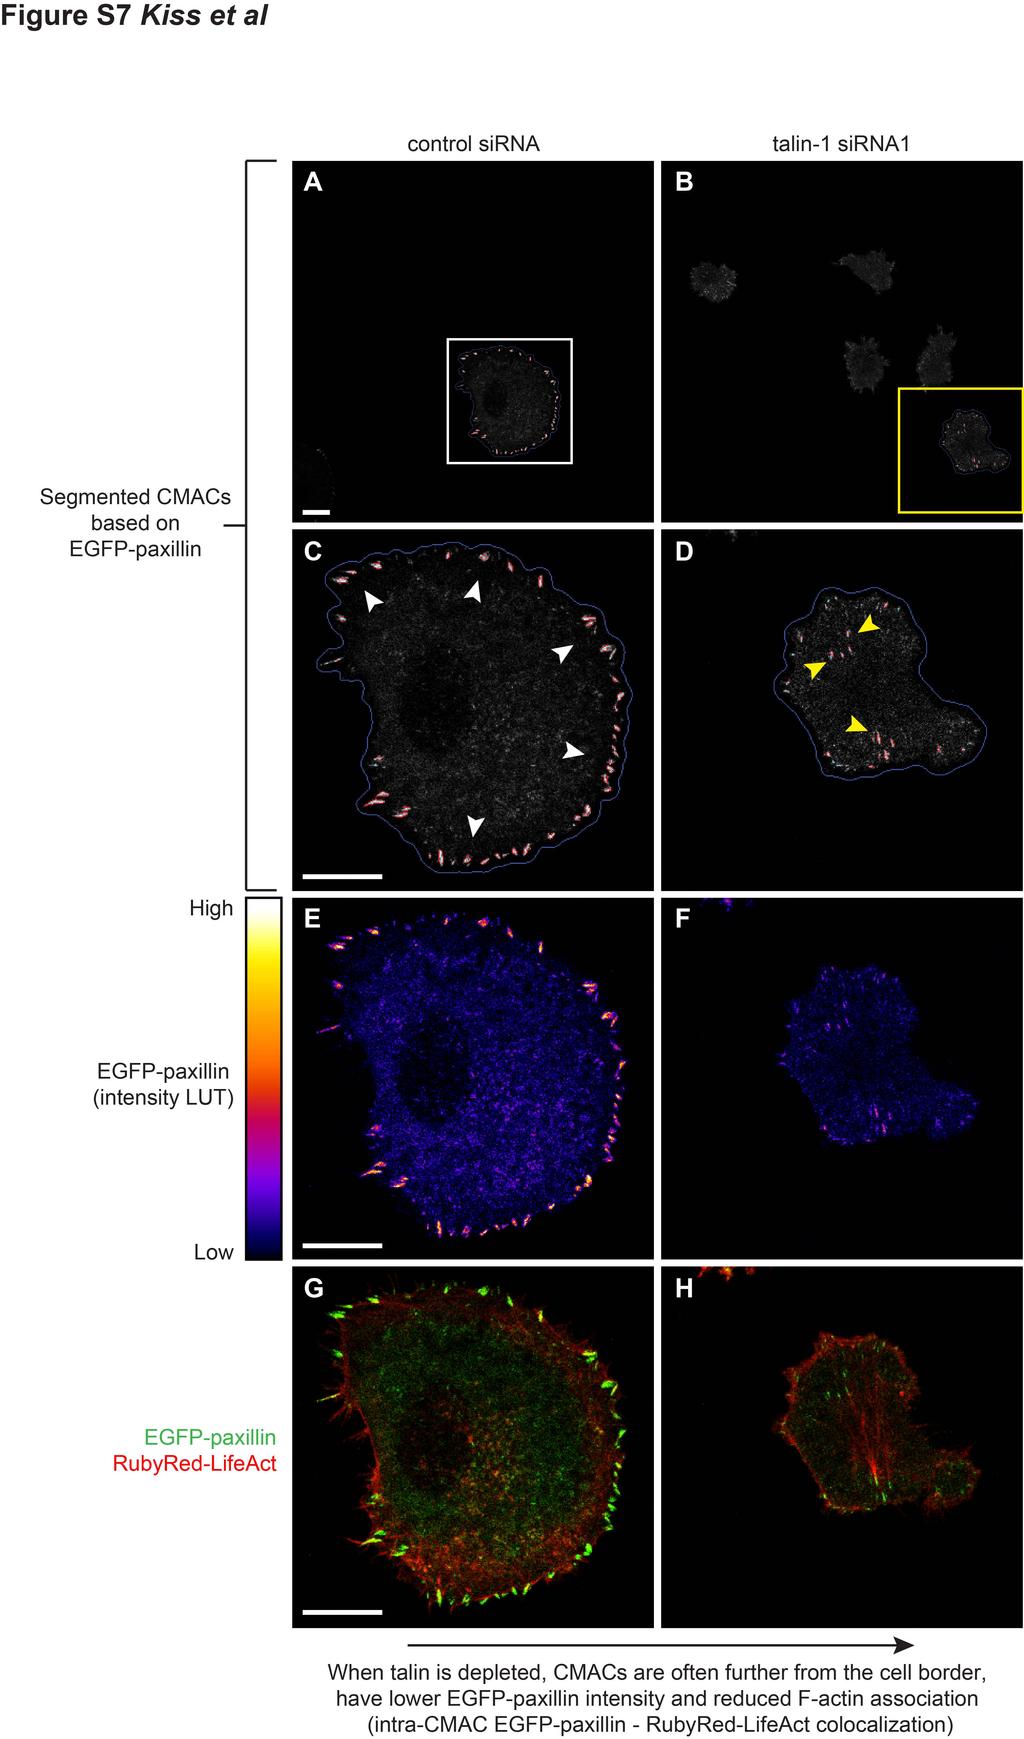
4 intensity change in Experiment #2; and CMAC paxillin-f-actin colocalization in Experiment #3. Number of observations: control sirna: Experiment #1: 839, Experiment #2: 1305, Experiment #3: 1386, Experiment #4: 671, Experiment #5:687, Experiment #6: 877, Experiment #7: 919; talin-1 sirna: Experiment #1: 931, Experiment #2: 1289, Experiment #3: 1338, Experiment #4: 1531, Experiment #5: 1364, Experiment #6: 1145, Experiment #7: 1246 Figure S7. Cell-matrix adhesion complex localization, intensity and F-actin association are altered in response to talin-1 knockdown Comparing representative cells from control sirna (left column, A, C, E, G) or talin-1 sirna1 (right column, B, D, F, H) conditions, we can visually confirm changes quantified in Figure S5. CMAC distance to cell edge: Cell-matrix adhesion complexes (CMACs) were segmented based on EGFP-paxillin signal (red outlines in A-D), cell boundaries were segmented based on RubyRed-LifeAct (blue outlines in A-D). Note that in the control sirna treated cell (shown in A, enlarged in C from white box in A), CMACs (white arrows) are located closer to the cell border (blue outline) than in the representative talin-1 sirna1 treated cell (B, enlarged in D from yellow box in B, yellow arrows indicate central CMACs). CMAC paxillin intensity: Using the fire look-up table (LUT) to visualize EGFP-paxillin intensities (intensity scale left of E), we observe that CMACs in control sirna-treated cells have higher intensity (EGFP-paxillin is more concentrated in CMACs) than in talin-1 sirna1-treated cells. CMAC paxillin-f-actin colocalization: Merged images showing both EGFP-paxillin (green) and RubyRed-LifeAct (red) signals emphasize the reduced association between actin filament bundles and CMACs in talin-1 sirna1-treated cells. This is reflected quantitatively by reduced Pearson s colocalization coefficient values within CMACs in these cells. Note: image intensities in E-H were linearly re-scaled to aid visualization, with original 8-bit intensity values of 100 (E and F) or 50 (G and H) set to the maximal value of 255. Scale bars: 10 µm. Figure S8. Stratification of talin level-associated trends between talin-1 sirna1- and control sirna-treated cells Data describing cell and cell-matrix adhesion complex (CMAC) properties (A-G) was grouped into talin expression deciles. Note the overlapping regions D6-D7 between talin-1 sirna1-treated (orange dashed line) and control sirna-treated (blue continuous line) cell populations. Tick mark locations on the lower X-axes designate normalized median talin expression values of talin deciles. Y-axes display median property values in each talin decile, following standardization to the median of D10 (except for C and D which show median absolute values). Variables A-G show progressive trends from D1 to D10, with trend line
5 connections proximal between control sirna and talin-1 sirna1 conditions. Error bars indicate the 95% confidence intervals of the medians. Number of observations: D1: 1425, D2: 1413, D3: 1514, D4: 1319, D5: 1426, D6: 1557, D7: 1532, D8: 1781, D9: 1736, D10: Figure S9. Visualizing Cell-matrix adhesion complex area increases with the reduction of talin expression levels between quintile 2 and quintile 1 cells Comparing representative cells from talin expression quintile 2 (left column, A and C) or quintile 1 (right column, B and D), we can visually confirm changes in CMAC Area quantified in Figure 4. Cell-matrix adhesion complexes (CMACs) were segmented based on EGFP-paxillin signal (red outlines in A-D), cell boundaries were segmented based on RubyRed-LifeAct (blue outlines in A-D). Note that in the quintile 2 cell (shown in A, enlarged in C from white box in A), CMACs are smaller (white arrowheads) than in the quintile 1 cell (B, enlarged in D from yellow box in B), where yellow arrowheads highlight larger adhesions. This is despite the lower talin levels in the quintile 1 cell, and is emblematic of the non-monotonic population response to talin seen for CMAC area. Scale bars: 10 µm. Figure S10. Continuous sampling of the talin expression spectrum and selection of significant inter-feature correlations (A) Per cell median values for pairs of cellular properties (grey and red circles) were plotted according to their relative talin expression-levels (standardized to the median of the controlsirna condition). To analyze Spearman s correlations coefficients between pairs of cellular properties, a moving window (grey rectangles) approach was applied to group cell observations based on rank-ordered, relative talin expression-levels. Spearman s correlation coefficients were calculated between cellular properties within each window. (B) Spearman s correlation coefficients were calculated as follows. Talin expression-level (X axis: talin expression-levels (grey) standardized to control sirna median; talin expression group (black) defines thirds of the absolute talin expression range (low, moderate and high)) was divided into sampling windows containing 25 cells (grey rectangles in A). Within each window, bootstrap sampling of median cell property values (100 times resampling with replacement) was performed, generating a distributed estimation of Spearman s coefficient values within each window. Median correlation values (blue circles), as well as 5 and 95 percentiles (red squares), were calculated from distributions in each window. In iterative steps, the sampling window was moved in the direction of increasing talin expression, retaining an overlap with 20 rank-ordered cells from the previous sample window. This method guaranteed continuous sampling of the talin expression spectrum.
6 (C) To test for significant changes in Spearman s correlation coefficients in the different talin expression groups, correlation values obtained from continuous sampling described in B were divided according to these equidistant thirds of the absolute talin expression range (as indicated in B, low (only knockdown cells), moderate (overlap between control and knockdown), high (only control cells)). Spearman s correlations were considered significant only if the 95% confidence intervals (CIs) of the median correlation values (from distributions obtained by bootstrap sampling within each group) did not span 0. Such significant correlations were included in the correlation network analysis in Figure 5, while nonsignificant correlations were excluded regardless of their median Spearman s correlation value. In the example of cell compactness vs. cell speed, 95% confidence intervals did not overlap with 0 in the moderate and high talin expression-levels, and were therefore considered significant. The Spearman s correlation coefficient values for each of the talin expression groups is stated at the bottom of C. Green frames indicate significant correlations. Movie S1. Cell migration of control sirna-treated H1299 cells Control sirna-treated H1299-P/L cells stably expressing EGFP-paxillin (green, left panel) and RubyRed-LifeAct (red, left panel) were imaged at 5 min intervals for 6 h. The representative control cell displays a continuous movement, with many clearly discernible cell-matrix adhesion complexes (CMACs). EGFP-paxillin is concentrated within CMACs while RubyRed-LifeAct associates with the F-actin cytoskeleton. After confocal image acquisition (left panel), individual cells were segmented based on RubyRed-LifeAct fluorescence (cell boundary is indicated by dark blue outline, overlaying EGFP-paxillin channel; right panel). Subsequently, CMACs within each cell were segmented and tracked based on EGFP-paxillin fluorescence (indicated by red outlines, right panel). Scale bar: 20 µm Movie S2. Cell migration of talin-1 sirna1-treated H1299 cells. Talin-1 sirna1-treated H1299-P/L cells expressing EGFP-paxillin (green, left panel) and RubyRed-LifeAct (red, left panel) were imaged at 5 min intervals for 6 h. Note the decreased number, size and stability of cell-matrix adhesion complexes (CMACs), and the erratic movement of the two representative cells. EGFP-paxillin is concentrated within punctate cellmatrix adhesion complexes (CMACs), while RubyRed-LifeAct associates with the F-actin cytoskeleton. After confocal image acquisition (left panel), individual cells were segmented based on RubyRed-LifeAct fluorescence (in the upper cell, the cell boundary is indicated by dark blue outline, overlaying EGFP-paxillin channel; right panel). Subsequently, CMACs within each cell were segmented and tracked based on EGFP-paxillin fluorescence (indicated by red outlines, right panel). Only one cell is segmented in this field (hence only one cell displays segmentation outlines in this example). Scale bar: 20 µm

7

8
9
10
11
12
13
14

15
16