Patrick W. Serruys, MD, PhD
|
|
|
- Hope Brown
- 5 years ago
- Views:
Transcription
1 Cardiology Update 2011 The 4th revolution in percutaneous coronary revascularization: Biodegradable drug eluting scaffold Patrick W. Serruys, MD, PhD Thoraxcenter, Erasmus MC, Rotterdam, The Netherlands


2 The four revolutions Bare-metal Drug-eluting POBA stent metallic Dissection stent and intraparietal Acute Occlusion hemorrhage Acute ST na Subacute ST na Acute recoil Bioresorbable scaffold therapy Constrictive remodeling Dissection Scaffolded by stent Neointimal hyperplasia Expansive remodeling Late Luminal Enlargement Post angioplasty 4 months later Late ST na - - +


3 Poly -LL- Lactide (PLLA) Everolimus Eluting Scaffold (BVS) PLA Molecular Weight H 2 O Hydrolysis Lactic Acid Mass Loss MSCT Mass Transport Krebs Cycle CO 2 + H 2 O


4 Bioabsorbable Drug Everolimus Eluting scaffold (BVS 1.0) Poly-lactic Acid ( PLA ) Polymer Amorphous Coated Vessel wall Coating Thin coating of amorphous PDLA containing Everolimus at a ratio of 1:1 Lower crystallinity Controlled drug release Crystalline Uncoated BACKBONE OF SCAFFOLD PLLA scaffold Backbone Provides scaffold integrity Higher crystallinity Processed for increased radial strength
 Polylactide")


5 Bioabsorbable Drug Everolimus Eluting Stent (BVS) Polylactide Degradation versus Radial Support Tie chains Crystal lamella Amorphous Tie chains Support Molecular Weight Mass Loss Mos
: OCT + Histology 7 Yucatan minipigs underwent histology only at one month (14 BVS): Histology* 6 months 12 months 18")
 2 Yucatan minipigs underwent OCT and GPC (5 BVS): OCT+GPC 1 Yucatan minipig was sacrificed after OCT (2 BVS): OCT+ Histology 4 Yucatan minipig was sacrificed (7 BVS):")
6 44 pigs implanted with BVS fully bioresorbable scaffold (BVS) Acute 2 Yorkshire landrace pigs were sacrificed after OCT immediately after procedure (4 BVS) OCT + Histology 1 month 2 Yorkshire landrace pigs were sacrificed after OCT at one month after procedure (4 BVS): OCT + Histology 7 Yucatan minipigs underwent histology only at one month (14 BVS): Histology* 6 months 12 months 18 months 24 months 36 months 48 months 7 Yucatan minipigs underwent histology only at 6 months (12 BVS): Histology* 1 Yucatan minipig underwent Gel Permeate Chromatography (GPC, 3BVS) 2 Yucatan minipigs underwent GPC (6BVS) 2 Yucatan minipigs underwent OCT and GPC (5 BVS): OCT+GPC 1 Yucatan minipig was sacrificed after OCT (2 BVS): OCT+ Histology 4 Yucatan minipig was sacrificed (7 BVS): Histology* 5 Yucatan minipigs were sacrificed after OCT at 3 years (8 BVS): OCT + Histology 3 Yucatan minipigs underwent GPC (5 BVS) One pig died before 48 months 5 Yucatan minipigs were sacrificed after OCT at 4 years (12 BVS): OCT + Histology 2 Yucatan minipigs underwent histology at 4 years (3 BVS)*


 nor smooth")
 were detected in the strut footprint.")

7 OCT and Histology: 2 years after Procedure A, B: OCT: the preserved box appearance of struts C, D: Locations of bioresorbed struts readily visible in histological sections stained with HE E: Alcian blue fills in the regions previously occupied by the struts (proteoglycan). F, G: Neither collagen (red in Trichrome staining) nor smooth muscle (brown in smooth muscle actin immunohistochemical staining) were detected in the strut footprint. H: A small rim of calcification in von Kossa staining, corresponding to the location of the PDLLA coating (black arrows, H). 3 years 2 years 1.5 years 1 years In-vitro G H E F G H


 F: von Kossa:")


8 A: OCT: Preserved box subcategory visible only at 8 and 9 o clock. B, C: HE staining: Strut footprints now coalesced with the surrounding tissue. D: Trichrome staining: the connective tissue filled in the strut footprint E: Alcian Blue: proteoglycan matrix in the strut footprint (blue) F: von Kossa: minimal calcification outlining the sites. G: SMA staining: Only a minority of cells positive with SMA in the strut footprints indicating that these cells are likely of alternate cellular origin (e.g. fibroblasts) H: Transmission electron microscopy: the strut footprints are composed of condensed, non-fibrillar glycoprotein. A OCT, Histology and TEM: 3 years after Procedure Non fibrillar Glycoprotein C D E F G H Transmission electron microscopy Non fibrillar Glycoprotein


9 2 years By chromatography, polymeric struts were no longer detectable HE staining 3 years 4 years Alcian Blue Alcian Blue Movat Strut voids were filled with young connective tissue and coalesced with vessel wall. Strut voids are minimally discernible in histology, with localized low density of smooth muscle cells at the presumed site of polymeric struts.


10 Maturation of endothelial cell junctions 1 month BVS 48 month BVS Overlaying endothelial cells, dense continuous junctions weak single junction AP Rev. A 15 Tests performed by and data on file at Abbott Vascular.


11 Transmission Electron Microscopy of Neointima and Media at 1 and 36 months Following Placement of BVS Stents More Intracellular organelles 1 Month a Neointima b Media c 2μm 2μm 36 Month AP Rev. A 14 2μm d Tests performed by and data on file at Abbott Vascular. 2μm
12 Do bioresorbable scaffolds answer the unmet needs of metallic stents?
 and metallic")

13 #1. We do not have to worry about acute recoil Cumulative frequency distribution curve of Relative Recoil of bioresorbable scaffolds (BVS) and metallic Everolimus-eluting stents (EES,Xience V) %Acute Recoil BVS 1.1: 6.7±6.4 % EES : 4.3 ± 7.1% Onuma et al. CCI % 2011/3/25
 91 88 128 Balloon Prescaffold Postscaffold P* P Angulation, 28.")
14 #2. Exceptional conformability of the BVS has already been clinically observed. Gomez et al. JACC int 2010 Conformability in BVS 1.1 (N=89) Balloon Prescaffold Postscaffold P* P Angulation, 28.7 > 10.4 < <0.001
 showed signs of shrinkage at 6 months (dubbed late recoil ) that contributed to the late luminal loss.")
15 Deficiency of the BVS 1.0 in the ABSORB Cohort A The first generation of everolimus-eluting bioresorbable scaffold (BVS1.0) showed signs of shrinkage at 6 months (dubbed late recoil ) that contributed to the late luminal loss. Angiographic measurement IVUS measurement 100% 90% 80% 70% LATE LOSS angiographic 60% 50% Late Loss = 0.43mm 40% 30% Δ Vessel Area = +0.3% Δ scaffold Area = -11.8% % Scaffold Obstruction = 5.3% 20% 10% EES*: 0.10 mm (N=23) BVS1.0: 0.43mm (N=26) BMS**: 0.85 mm (N=27) Δ Lumen Area = -16.8% 0%
 has a modified platform design and a different manufacturing process of")
 tissue prolapse")


16 Deficiency of the BVS 1.0 in the ABSORB Cohort A The second generation (BVS1.1) has a modified platform design and a different manufacturing process of the polymer. Larger Maximum Circular Unsupported scaffold area (MCUSA) tissue prolapse proximal BVS 1.0: Circumferential out-of-phase zigzag hoops linked together by three longitudinal struts between each hoop Revision 1.1 has More radial strength More uniform support and drug application Longer duration of support istal BVS 1.1: in-phase zigzag hoops linked by bridges Side branch Profile less than Cypher Track test better than ML Vision No change in strut thickness


17 Quantitative OCT Assessment of BVS 1.1 #3. Late recoil is no longer the issue. Baseline Follow-up Preclinical model: histomorphometry 28 days after implantation
18 #3. Late recoil is no longer the issue. Baseline Follow-up Strut area Strut Core area Strut Core area Preclinical model: histomorphometry 28 days after implantation


19 Quantitative OCT Assessment of BVS 1.1 Baseline Follow-up Strut area Strut Core area Lumen Area Scaffold Area Strut Core area Strut Core area Neointimal area =Scaffold area Lumen area Strut core area

20 Quantitative OCT Assessment of BVS 1.1 Baseline Follow-up Strut area Strut Core area Lumen Area Scaffold Area Strut Core area Strut Core area Neointimal area =Scaffold area Lumen area Strut core area
21 #3. Late recoil is no longer the issue. Results of Quantitative OCT Analysis Intent-to-treat (n=25) Post PCI 180 days % difference P value Mean Scaffold area, mm % No late scaffold shrinkage 0.1 Minimum scaffold area, mm % 0.63 Mean Prolapse area, mm na Mean strut area, mm na Mean strut core area, mm % ns Mean Neointimal Area, mm 2 na 1.25 Mean Flow area, mm % <0.001 Minimal flow area, mm % <0.001 % area stenosis 19% 24% 0.03 % Uncovered struts % ISA area, mm (n=12) 0.31 (n=3)
22 #3. Late recoil is no longer the issue. Results of Quantitative OCT Analysis Intent-to-treat (n=25) Post PCI 180 days % difference P value Mean Scaffold area, mm % 0.1 Minimum scaffold area, mm % 0.63 Mean Prolapse area, mm na Mean strut area, mm na Mean strut core area, mm % ns Mean Neointimal Area, mm 2 na 1.25 Mean Flow area, mm % <0.001 Minimal flow area, mm % <0.001 % area stenosis 19% 24% 0.03 % Uncovered struts % ISA area, mm (n=12) 0.31 (n=3)

23 #3. Late recoil is no longer the issue. Results of Quantitative OCT Analysis Intent-to-treat (n=25) Post PCI 180 days % difference P value Mean Scaffold area, mm % 0.1 Minimum scaffold area, mm % 0.63 Mean Prolapse area, mm na Mean strut area, mm na Mean strut core area, mm No premature 0.20sign of bioresorption -1.37% ns Mean Neointimal Area, mm 2 na 1.25 Mean Flow area, mm % <0.001 Minimal flow area, mm % <0.001 % area stenosis 19% 24% 0.03 % Uncovered struts % ISA area, mm (n=12) 0.31 (n=3)
24 #3. Late recoil is no longer the issue. Results of Quantitative OCT Analysis Intent-to-treat (n=25) Post PCI 180 days % difference P value Mean Scaffold area, mm % 0.1 Minimum scaffold area, mm % 0.63 Mean Prolapse area, mm na Mean strut area, mm na Mean strut core area, mm % ns Mean Neointimal Area, mm 2 Well na controlled 1.25inhibition of neointima Mean Flow area, mm % <0.001 Minimal flow area, mm % <0.001 % area stenosis 19% 24% 0.03 % Uncovered struts % ISA area, mm (n=12) 0.31 (n=3)
25 #3. Late recoil is no longer the issue. Results of Quantitative OCT Analysis Intent-to-treat (n=25) Post PCI 180 days % difference P value Mean Scaffold area, mm % 0.1 Minimum scaffold area, mm % 0.63 Mean Prolapse area, mm na Mean strut area, mm na Mean strut core area, mm % ns Mean Neointimal Area, mm 2 na 1.25 Mean Flow area, mm % <0.001 Minimal flow area, mm 2 Minimal 5.56 reduction 4.73 in functional -15% lumen <0.001 area % area stenosis 19% 24% 0.03 % Uncovered struts % ISA area, mm (n=12) 0.31 (n=3)
26 #3. Late recoil is no longer the issue. Results of Quantitative OCT Analysis Intent-to-treat (n=25) Post PCI 180 days % difference P value Mean Scaffold area, mm % 0.1 Minimum scaffold area, mm % 0.63 Mean Prolapse area, mm na Mean strut area, mm na Mean strut core area, mm % ns Mean Neointimal Area, mm 2 na 1.25 Mean Flow area, mm % <0.001 Minimal flow area, mm % <0.001 % area stenosis 19% 24% 0.03 % Uncovered struts Almost - complete 3.23% coverage of the struts ISA area, mm with (n=12) resolution 0.31 (n=3) of incomplete apposition


27 Post-procedure Pre-procedure A B C D E A B C D E


28 6 months Fup A B C D E A B C D E
29 What did we learn from ABSORB B1,B2 ( )? Circulation MSCT Group B1 (n = 45) QCA, IVUS, OCT, IVUS VH MSCT Baseline Months Months Months Months Months Group B2 (n = 56) MSCT
30 Cumulative frequency distribution curves of Late loss: BVS 1.1 (Cohort B) vs. Xience V (Spirit I) Months (SPIRIT I vs. B1) 12 Months (SPIRIT I vs. B2) Circulation ACC,april EES: 0.10±0.23 mm (N=22) Cohort B: 0.19±0.18 mm (N=42) EES: 0.23 ± 0.29 mm (N=22) Cohort B: 0.25 ± 0.23 mm (N=54) -0,5 0,5 1,5-0,5 0,5 1,5
 QCA, IVUS, OCT, IVUS VH MSCT Baseline 6 12 18 2 Months Months Months")
31 What did we learn from ABSORB cohort A ( )? Group A (n = 30) QCA, IVUS, OCT, IVUS VH MSCT Baseline Months Months Months Years 3 Years 4 Years 5 Years MSCT MSCT


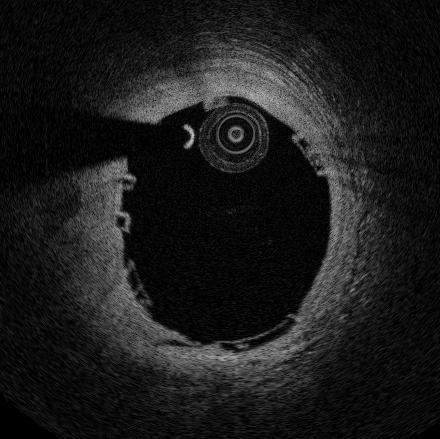
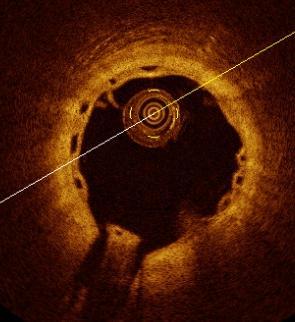
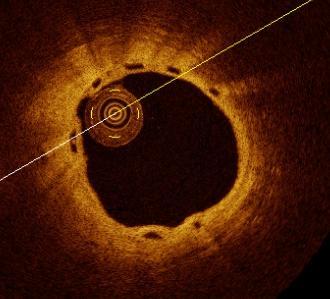
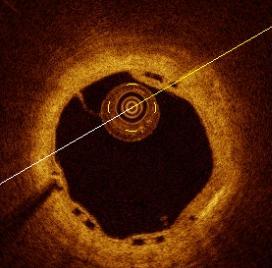
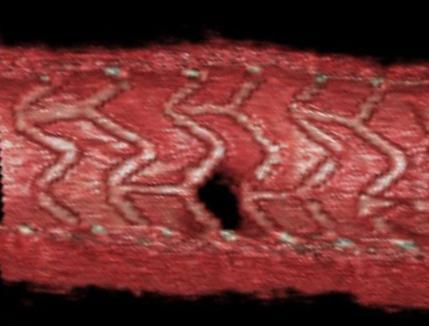
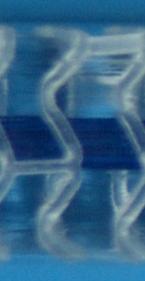
32 #4. Bioresorption is a real phenomenon. (Serruys et al. Lancet 2009) STRUTS NON DISCERNIBLE NON APPOSED Smooth Baseline 2 years

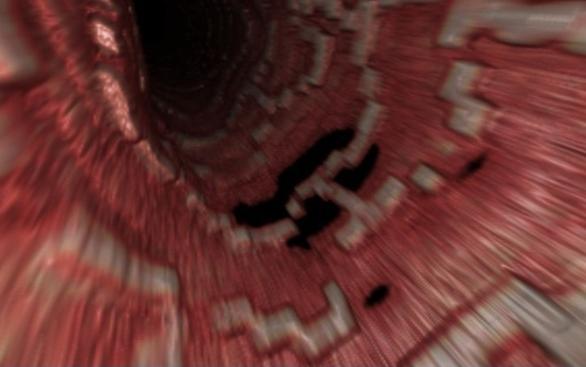
33 OFDI 3D reconstruction provides us with an exquisite endoluminal view of the process proximal distal Film No : side branch


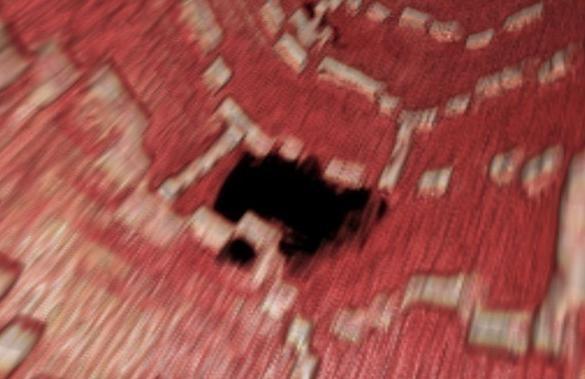


34 Today, with 3-D OFDI we can further evaluate the bioresorption process. Non-jailed 1b V type 40% Classification of Jailed sidebranch ostium according to number of compartment created by the overhanging struts with different configuration (e.g. V, T and H type) 1 2 T type 1 H type % 25% V type Absorb Cohort B (n=17) %


35 #4. Bioresorption of jailed side branch are real phenomenon. (Okamura et al. EHJ 2010)

")

36 #4. Bioresorption and vessel wall integration are real phenomena. (Lancet 2009) Pre-stenting Post-stenting 6-month 24-month 3.9mm 2 7.1mm 2 6.9mm mm 2
37 #5. Late plaque reduction and lumen enlargement have been documented. 2-Year IVUS Unpaired (BVS1.0) Post- 6-month 2-year % Diff p- PCI F/U FU (6M to 2Y) value n=25 n=25 n=18 Vessel (EEM) area (mm 2 ) 13.49* Lumen area (mm 2 ) Minimal Lumen area (mm 2 ) Plaque area (mm 2 ) 7.44* <0.001 *n=24 P-values per Wilcoxon s signed rank test % Diff based on paired values


38 Lumen Reduction Compensatory Expansive Remodeling of EEM IT PIT FA + Lumen Enlargement by Plaque Regression - Lumen Reduction Scaffolding Struts - Bioresorbable Scaffold A new treatment Paradigm for Atherosclerotic Plaque - Lumen Enlargement By Bioresorbable Scaffolding


39 Autophagy of macrophage induced by everolimus with clearance of atherosclerotic plaque Autophagosome JACC 2009


40 Lumen Reduction Compensatory Expansive Remodeling of EEM IT PIT FA + Metallic stent is the cage - Metallic Struts Struts Lumen Reduction by Intrastent Growth of tissue - Metallic Stent A classical caged lumen treatment doomed Paradigm to get for Atherosclerotic reduced Plaque -


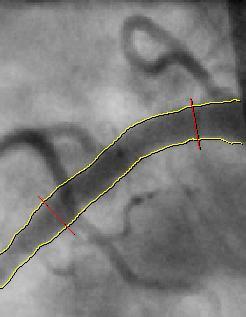
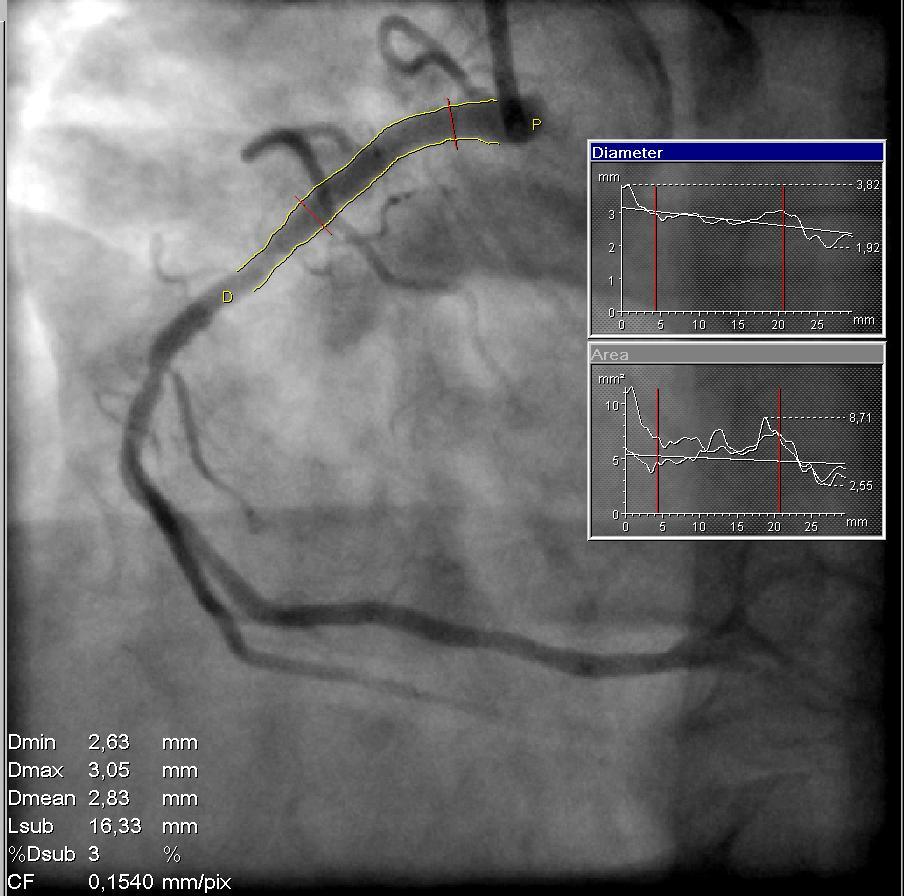
41 #6. Non-invasive imaging for early and late follow-up is now feasible. Lumen Area (mm 2 ) Lumen Area (mm 2 ) 6.0 In-stent % M FU ± ± ± % 90% 80% 70% 60% 50% 40% Mean Diameter Stenosis 19 ± 9% % Mean Area Minimal Area Reference Area 20% 10% 0%
 Mean lumen diameter, mm 3.")

42 Ach test (n=9) #7 Endothelium-dependent vasomotion is restored (Lancet 2009) Mean lumen diameter, mm 3.5 Scaffolded segment P= P=0.3 P=0.4 Pre-Ach Pre-Ach Ach Nitro Post- Ach
43 #8 No acute/subacute/late stent thrombosis up to 4 years 4 Year Clinical Results Intent to Treat Hierarchical 6 Months 30 Patients 12 Months 29 Patients* 3 Years 29 Patients* 4 Years 29 Patients* Ischemia Driven MACE, %(n) 3.3% (1)* 3.4% (1)* 3.4% (1)* 3.4% (1)* Cardiac Death, % 0.0% 0.0% 0.0% 0.0% MI, %(n) Q-Wave MI 0.0% 0.0% 0.0% 0.0% Non Q-Wave MI 3.3% (1)** 3.4% (1)** 3.4% (1)** 3.4% (1)** Ischemia Driven TLR, % by PCI 0.0% 0.0% 0.0% 0.0% by CABG 0.0% 0.0% 0.0% 0.0% No new MACE events between 6 months and 4 years No stent thrombosis up to 4 years (All patients off clopidogrel) *One patient withdrew consent after 6 months but the vital status of the patients and absence of cardiac event is known through the referring physician. **This patient also underwent a TLR, not qualified as ID-TLR (DS = 42%) followed by post-procedural troponin qualified as non- Q MI and died from his Hodgkin s disease at 888 days post-procedure. Ormiston et al. 2008, Serruys et al. 2009, Onuma et al. 2010
44 MACE (C-Death, MI, ID-TLR) #8 Clinical performance comparable to Everolimus eluting metalic stent KM estimate of MACE rate in patients treated with BVS (Cohort A and B Absorb, n=130) vs. patients treated with a single 3x 18 mm metallic EES (Spirit I+II+III, n=227) 12.0% 10.0% 8.0% 6.0% BVS(A+B1+B2) XV(SPI+SPII+SPIII RCT) 393-day HR 0.85 [0.35,2.05] p= % =1.5% 6.0% 4.0% 2.0% XV Includes only patients with single 3.0 x 18mm stent BVS Includes all patients with single lesion 0.0% Time Post Index Procedure (Months)


45 C #10 the safety of this technology remains up to 10 years. D E E B D C A B A Thorax Thorax center center Arrow indicates a metallic marker

46 Past, Present and Future N=30 N=45 N=56 N=171 Lancet 2008 & 2009, Eurointervention 2010 Circ 2010 EH 2010 Grand total:302 Just CE marked! Follow-up Enrolled To be Enrolled * Timelines based on patient follow-up dates, not data availability

47 , Thank you for your attention