Nature Structural & Molecular Biology: doi: /nsmb Supplementary Figure 1. Analyses of ECTRs by C-circle and T-circle assays.
|
|
|
- Stewart Casey
- 5 years ago
- Views:
Transcription
1 Supplementary Figure 1 Analyses of ECTRs by C-circle and T-circle assays. (a) C-circle and (b) T-circle amplification reactions using genomic DNA from different cell lines in the presence (+) or absence (-) of phi29 DNA polymerase. Using 32 P-labeled telomeric probes, C-circle reaction products and 50ng of denatured genomic DNA (input) were analyzed by dot blots, and T-circle reaction products were detected by in-gel hybridization. Asterisks denote ALT cell lines.
 Dot blots analysis of extrachromosomal DNA (ecdna) in U2OS cells prepared by fractionation using 32 P-labeled telomeric and Alu probes. Quantifications of radioisotope signals were shown in b.")
2 Supplementary Figure 2 ECTRs in U2OS cells do not induce IFNβ expression. (a-b) Dot blots analysis of extrachromosomal DNA (ecdna) in U2OS cells prepared by fractionation using 32 P-labeled telomeric and Alu probes. Quantifications of radioisotope signals were shown in b. Singles of native (Nat.) and denatured (Den.) samples indicate singlestranded DNA and total DNA, respectively. (c) Immunofluorescence staining with anti-cgas antibody (green) coupled with Tel-FISH (red) in U2OS cells expressing flag-cgas m2a. Nuclei were visualized by DAPI staining (blue). Enlarged images show co-localization between cytoplasmic ECTRs and cgas. Scale bar, 10 m. Quantifications of ECTR positive cells ( 2 cytoplasmic telomeric foci) and co-localization between ECTRs and cgas are shown (right). The ECTR positive cells with and without co-localization between cytoplasmic ECTRs and cgas are indicated as +cgas and -cgas, respectively. The n values indicate the numbers of cells analyzed. (d) T-circle assay of U2OS/Vector and U2OS/ERT2-TRF2 B cells. The cells treated with or without 4-OHT for 48 h were subjected to genomic DNA extraction and subsequent T-circle amplification reactions using phi29 DNA polymerase. Linear telomere restriction fragments (TRFs) and phi29-dependent amplification products of TCs were detected by in-gel hybridization using 32 P-labeled telomeric probes. (e) Real-time RT-PCR analysis of IFNβ mrna in U2OS/Vector and U2OS/ERT2-TRF2 B cells treated with 4-OHT for 48 h. U2OS/Vector cells transfected with poly(i:c) served as a positive control. (mean ± s.d.; n=3 technical replicates of representatives of three independent experiments) n.s., not significant, ***P 0.001, paired t-test.
 Western blots and (b) immunofluorescence staining using anti-myc antibody in BJ TL cells stably expressing vector, myc-ert2-trf2 or myc-ert2-trf2 B and treated with 4-OHT for the indicated times.")
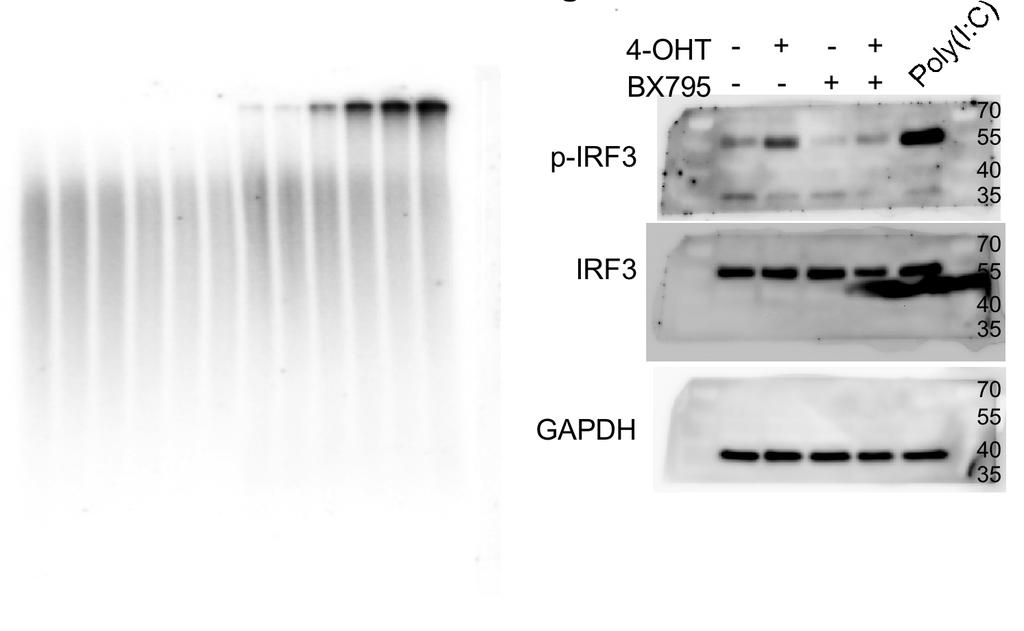
3 Supplementary Figure 3 Analysis of IFN expression in BJ TL cells expressing ERT2-TRF2 and ERT2-TRF2 B. (a) Western blots and (b) immunofluorescence staining using anti-myc antibody in BJ TL cells stably expressing vector, myc-ert2-trf2 or myc-ert2-trf2 B and treated with 4-OHT for the indicated times. Telomeric foci and nuclei were visualized following Tel-FISH and DAPI staining, respectively. Scale bar, 10 m. Arrows in b indicate representative telomeric localization of myc-ert2-trf2 and ERT2- TRF2 B. (c) Analysis of IFNβ by real-time RT-PCR in the cells in a treated with 4-OHT for 48 h. (d-f) Comparison between transient and prolong 4-OHT treatments in BJ TL /ERT2-TRF2 B cells. Schematic of experimental design of 4-OHT treatments was shown in d. Tel-FISH (red) and DAPI staining (blue) of 4-OHT-untreated (-) and -treated (+) BJ TL /ERT2-TRF2 B cells were shown in e. Scale bar, 10 m. Arrows indicate cytoplasmic telomeric foci. IFNβ NA levels were analyzed by real-time RT-PCR (f).
 Real-time RT-PCR analysis of mrna levels of indicated genes in BJ TL /ERT2-TRF2ΔB cells treated with/without 4-OHT for 48 h. Error bars indicate +/- s.e.m. of triplicate technical replicates and are representative of three independent experiments (n.")
4 Supplementary Figure 4 ECTRs induce expression of IFNβ and ISGs and affect cell proliferation in cgas and STING dependent manner. (a) Real-time RT-PCR analysis of mrna levels of indicated genes in BJ TL /ERT2-TRF2ΔB cells treated with/without 4-OHT for 48 h. Error bars indicate +/- s.e.m. of triplicate technical replicates and are representative of three independent experiments (n.s., not significant, *P 0.05, **P 0.01, paired t-test). (b) ELISA analyses of secreted IFNβ and CXCL10 from BJ TL /ERT2-TRF2ΔB cells transfected with control (sictrl: non-target) or cgas sirnas for 48 h, followed by 4-OHT treatments for 96 h. Error bars indicate +/- s.e.m. of triplicate technical replicates and are representative of three independent experiments (n.d., not detectable, *P 0.05, **P 0.01, unpaired t-test). (c-d) Western blot analyses of BJ TL /ERT2-TRF2ΔB cells transfected with control (sictrl: non-target), cgas or STING sirnas for 48 h using antibodies against cgas, STING and. (e-f) Real-time RT-PCR analysis of IFNβ mrna in BJ TL /ERT2-TRF2 B cells transfected with control (sictrl: non-target), cgas or STING sirnas for 48 h, followed by 4-OHT treatment for 48 h. (g-h) Cell growth analyses of BJ TL /ERT2-TRF2ΔB cells transfected with indicated sirnas for 48 h followed by 4-OHT treatment for 36 h. Cell numbers were analyzed at day 4 after 4-OHT addition. Relative growth rate indicates the cell number ratio of +4-OHT to - 4-OHT samples. (mean ± s.d.; n=3 technical replicates of representatives of three independent experiments) n.s., not significant, *P 0.05, **P 0.01, ***P 0.01, paired t-test.
 Western blot analyses of BJ TL /ERT2-TRF2 B cells transfected with control (sictrl: non-target), cgas or p53 (TP53) sirnas for 48 h using antibodies against cgas, TP53, p21 and.")
5 Supplementary Figure 5 Silencing cgas and p53 rescue cell proliferation. (a) Western blot analyses of BJ TL /ERT2-TRF2 B cells transfected with control (sictrl: non-target), cgas or p53 (TP53) sirnas for 48 h using antibodies against cgas, TP53, p21 and. p21 expression is transcriptionally regulated by p53, so depletion of p53 reduces p21 protein levels. (b) Cell growth analyses of BJ TL /ERT2-TRF2 B cells transfected with sirnas for 48 h, followed by 4-OHT treatment for 36 h. Cell numbers were analyzed at day 4 after 4-OHT addition. Relative growth rate indicates the cell number ratio of +4-OHT to -4-OHT samples. (mean ± s.d.; n=3 independent experiments) n.s., not significant, **P 0.01, ***P 0.001, paired t-test.
6 Supplementary Figure 6 Functional and expression analyses of STING in ALT cell lines. (a) Functional assay of STING using cgamp. Cells were permeabilized with digitonin and treated with cgamp ( nm) for 4 h, followed by real-time RT-PCR analyses of IFN mrna. (b) Relative STING mrna levels of BJ TL and in vitro-transformed ALT cell lines. (mean ± s.d.; n=3 technical replicates of representatives of three independent experiments)


dsDNA")

 Fig.")
7 Fig. 1e BJTL G292 U2OS p-tbk1 TBK1 IRF3 Saos2 p-tbk1 TBK1 IRF3 SJCRH30 Poly(I:C) dsdna Mock 3h 6h 3h 6h p-tbk1 TBK1 IRF3 Fig. 2a TOV-112D MG63 WI38-VA13 Poly(I:C)dsDNA Mock 3h 6h 3h 6h SK-N-FI Poly(I:C) dsdna Mock 3h 6h 3h 6h - Phi29 + Phi29 4-OHT (hr) Fig. 3a


")


8 Fig. 5a Fig. 3c sictrl sicgas sisting (h) 4-OHT cgas IRF3 STING Fig. 5b cgas STING Fig. 5.c cgas STING


9 Fig. 6a -4-OHT +4-OHT Fig. 6c 4-OHT IRF3 ATRX Daxx H3.3 STING Fig. 6d U2OS-Vector Mock EGFP IRF3 STING-myc GFP-ATRX GFP U2OS-STING EGFPEGFPMock EGFP ATRX ATRX >