Supporting Information for The Influence of the CTAB Surfactant on the Colloidal Seed-Mediated Synthesis of Gold Nanorods
|
|
|
- Tyler Hector Walton
- 5 years ago
- Views:
Transcription
1 Supporting Information for The Influence of the CTAB Surfactant on the Colloidal Seed-Mediated Synthesis of Gold Nanorods Danielle K. Smith and Brian A. Korgel* Department of Chemical Engineering, Texas Materials Institute, Center for Nano and Molecular Science and Technology, The University of Texas at Austin, Austin, Texas *Corresponding Author: (T) ; (F) We employed several different analytical techniques including mass spectrometry, x-ray diffraction (XRD), hydrogen-1 nuclear magnetic resonance ( 1 H NMR), carbon-13 nuclear magnetic resonance, ( 13 C NMR), and size exclusion chromatography (SEC) to determine what impurities might be present in CTAB obtained from different suppliers. In summary, we did not observe any noticeable difference. Mass spectrometry, XRD, and SEC analysis resulted in identical spectra for all of the CTAB samples examined. There were subtle differences were between the 1 H NMR and 13 C NMR spectra, however, these were identified as either residual solvent (like ethanol) or as irreproducible noise in the measurement. XRD data was acquired by drying an aqueous solution of concentrated CTAB into a film on a quartz slide using a Bruker-Nonius D8 Advance Theta-2Theta powder diffractometer with Cu KAlpha radiation (Lambda = Å) and collecting with a scintillation detector for 8 h with an incremental angle of 0.02 at a scan rate of 10 /min. LC/MS (mass spectrometry) data was collected from a Thermo-Fisher LTQ Mass Spectrometer with a Surveyor Plus HPLC pump. The sample was prepared by dissolving 1 mg of CTAB in 1 ml of doubly-distilled, deionized water. The NMR measurements were made on a Varian Inova Unity Spectrometer at 500 MHz for 1 H NMR and 125 MHz for 13 C NMR. In each case, the sample was prepared by dissolving 10 mg of CTAB in 0.6 ml of D 2 O. SEC (size exclusion chromatography) was acquired on 15 1
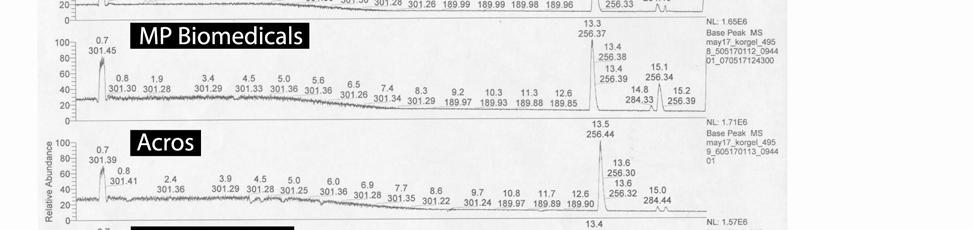
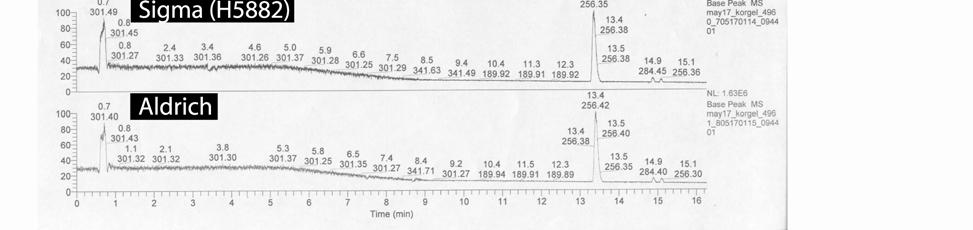
2 mg of CTAB dissolved in 1 g of DMF using a gel permeation column with an Optilab DSP refractometer and a DAWN EOS multi-angle laser light scattering detector. High-resolution transmission electron microscopy (HRTEM) imaging was performed on a JEOL 2010F transmission electron microscope operating at a voltage of 200 kv. Figure S1 shows mass spectrometry data of CTAB supplied by Fluka (52370), MP Biomedicals, Acros, Sigma (H5882), and Aldrich. Figure S2 shows XRD data of CTAB supplied by Fluka (52370) and Sigma (H5882). Figure S3 shows 1 H NMR spectra of CTAB from Fluka (52370), Sigma (H5882), and Sigma (H6269). Figures S4 and S5 contains 13 C NMR spectra of CTAB supplied by Fluka (52370), Sigma (H5882), and Sigma (H6269). Figure S6 shows SEC data of CTAB supplied by Fluka (52370) and Sigma (H5882). Figure S7 shows HRTEM images of gold seeds made from CTAB manufactured by (a) Acros and (b) MP Biomedicals that were used in the synthesis of gold nanorods. Gold nanorods resulted from the synthesis using MP Biomedicals CTAB but not Acros. Table 1 in the main text of the paper summarizes the results of the nanorod growth reactions carried out using all of these CTAB samples obtained from different suppliers. Figure S8 shows an absorbance spectra and TEM images of Au nanorods that were synthesized without the addition of Ag(NO3). Although some very long nanorods are observed, the majority of the product consists of gold paticles, as confirmed by the wavelength of the observed plasmon resonance. 2
3 3
4 4
 The primary peak is centered at 284.6.")

5 Figure S1. Mass spectrometry of CTAB supplied by Fluka (52370), MP Biomedicals, Acros, Sigma (H5882) and Aldrich. (A) The primary peak is centered at Small peaks that might be impurities appeared at (B) 256 (C) 284 (D) and 421 (E) 435, but were found to be present in approximately the same amount in all of the CTAB samples. Figure S2. XRD of CTAB supplied by Fluka (52370) and Sigma (H5882). Peaks appear at the same positions in both samples. 5
6 6
7 7
8 Figure S3. 1 H NMR spectra of CTAB supplied by (A) and (B) Fluka (52370), (C) Sigma (H5882), and (D) Sigma (H6269) in D 2 O. The same major peaks were observed in each sample. Closer examination of the peaks at and ppm in figure S3A revealed that they were artifacts that did not appear in each spectrum. The quadruplet centered at and the triplet centered at in (D) correspond to ethanol. 8
9 9
10 Figure S4. 13 C NMR spectra of CTAB supplied by (A) Fluka (52370), (B) and (C) Sigma (H5882), (D) and (E) Sigma (H6269) measured in D 2 O. All of the same major peaks were found in each sample. The peak at in (E) corresponds to ethanol. Unlabeled peaks near 30.4 correspond to the carbons 8-13 in the CTAB molecule. 1 The spectrum in (A) for CTAB from Fluka (52370) does not match exactly the spectra of the Sigma CTABs. We speculate that this was due to slight differences in calibration of the instrument, as the two Sigma CTABs were run in August 2007, whereas the Fluka (52370) CTAB was run in May Sigma (H5882) was also run in May 2006 and this spectra matched that of the Fluka (52370) spectra in (A). 10
11 11
12 Figure S5. 13 C NMR spectra of CTAB supplied by (A) and (B) Fluka (52370), (C) Sigma (H5882), (D) and (E) Sigma (H6269) in D 2 O. The peak at ppm in (C) corresponds to ethanol. 12
 (blue line)")
, which was the solvent. Figure S7.")
13 Figure S6. Size exclusion chromatography data of CTAB supplied by Fluka (52370) (blue line) and Sigma (H5882) (red line). The green line is for dimethylformamide (DMF), which was the solvent. Figure S7. HRTEM images of gold seeds used in gold nanorod synthesis made from CTAB manufactured by (a) Acros and (b) MP Biomedicals. 13
14 Absorbance (Arb. Units) Wavelength (nm) 200 nm 100 nm 100 nm 200 nm Figure S8. Au nanorods synthesized using the described recipe, but without the addition of Ag(NO 3 ) to the reaction. Although some very long nanorods (and triangles) are made, the majority of the product consists of spherical particles, as confirmed by the plasmon peak energy in the absorbance spectra (top). 14
15 References 1. Bacaloglu, R.; Bunton, C. A.; Cerichelli, G.; Ortega, F. J. Phys. Chem. 1989, 93,