INTRODUCTION TO GENETIC EPIDEMIOLOGY (1012GENEP1) Prof. Dr. Dr. K. Van Steen
|
|
|
- Clara Morton
- 5 years ago
- Views:
Transcription
1 INTRODUCTION TO GENETIC EPIDEMIOLOGY (1012GENEP1) Prof. Dr. Dr. K. Van Steen
2 GENOME-WIDE ASSOCIATION STUDIES 1 Setting the pace 1.a A hype about GWA studies 1.b Genetic terminology revisited 1.c Genetic association studies 2 Study Designs 2.a Marker level 2.b Subject level 2.c Gender level
3 3 Preliminary analyses 3.a Quality Control: Hardy-Weinberg equilibrium and missingness 3.b Linkage disequilibrium, haplotypes and SNP tagging 3.c Confounding: population stratification 4 Tests of association 4.a Single SNP 4.b Repeated single SNP tests: Multiple testing correction 4.c Replication 5 Interpretation and follow-up
4 1 Setting the pace 1.a A hype about GWA studies May he live in interesting times. Like it or not we live in interesting times. Robert Kennedy, June 7, 1966

5 How much (sequence) data are available? The complete genome sequence of humans and of many other species provides a new starting point for understanding our basic genetic makeup and how variations in our genetic instructions result in disease.
6
7
8

9
10
11

12 2008 third
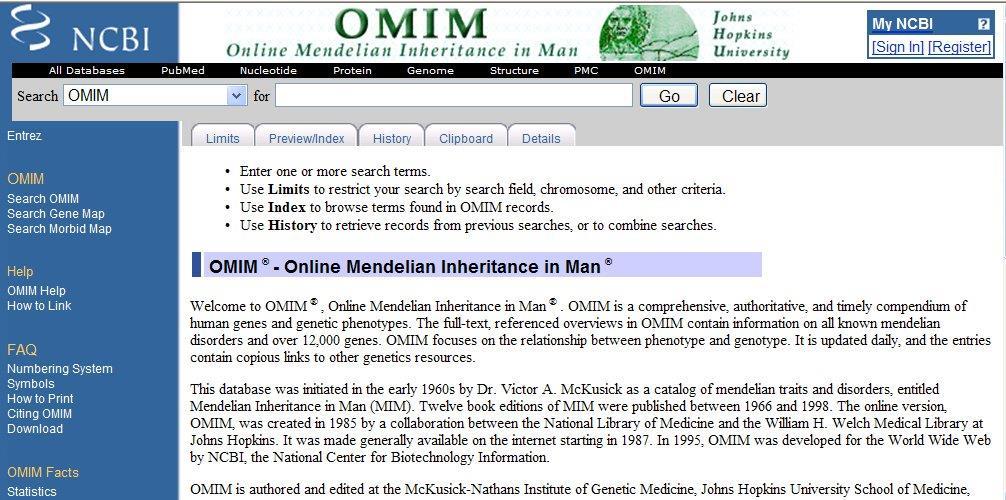
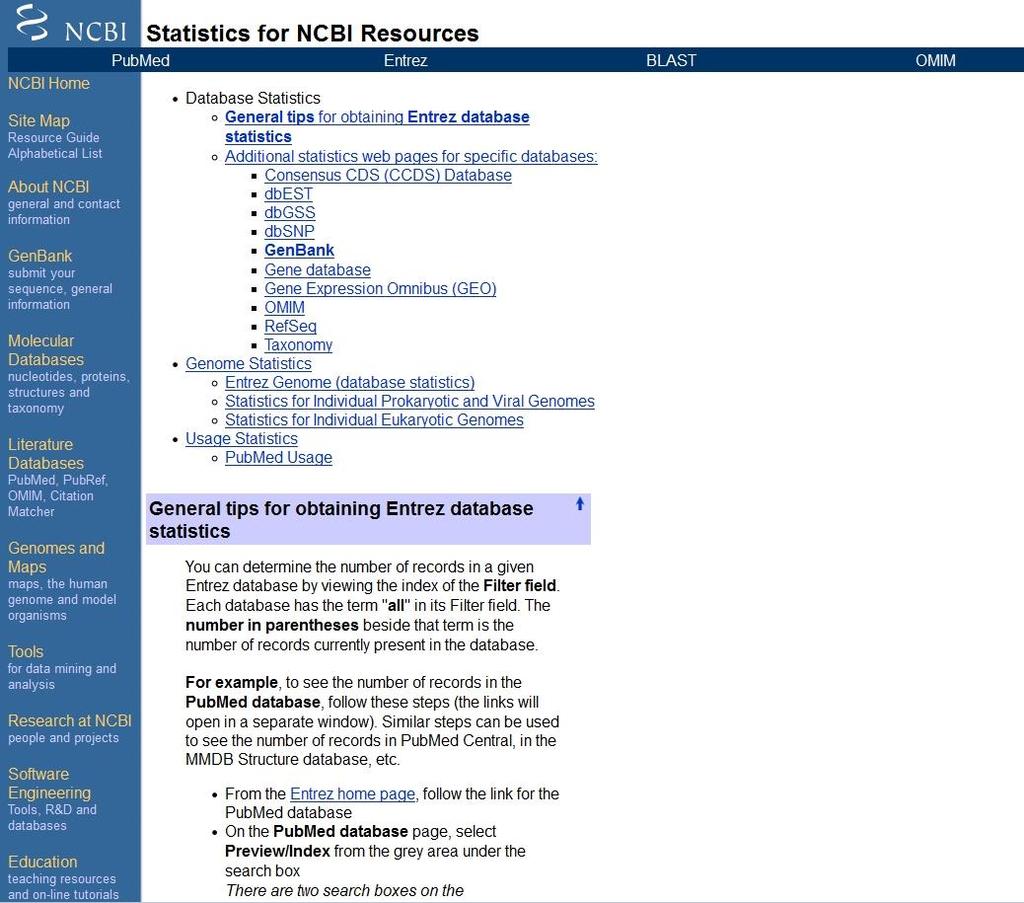
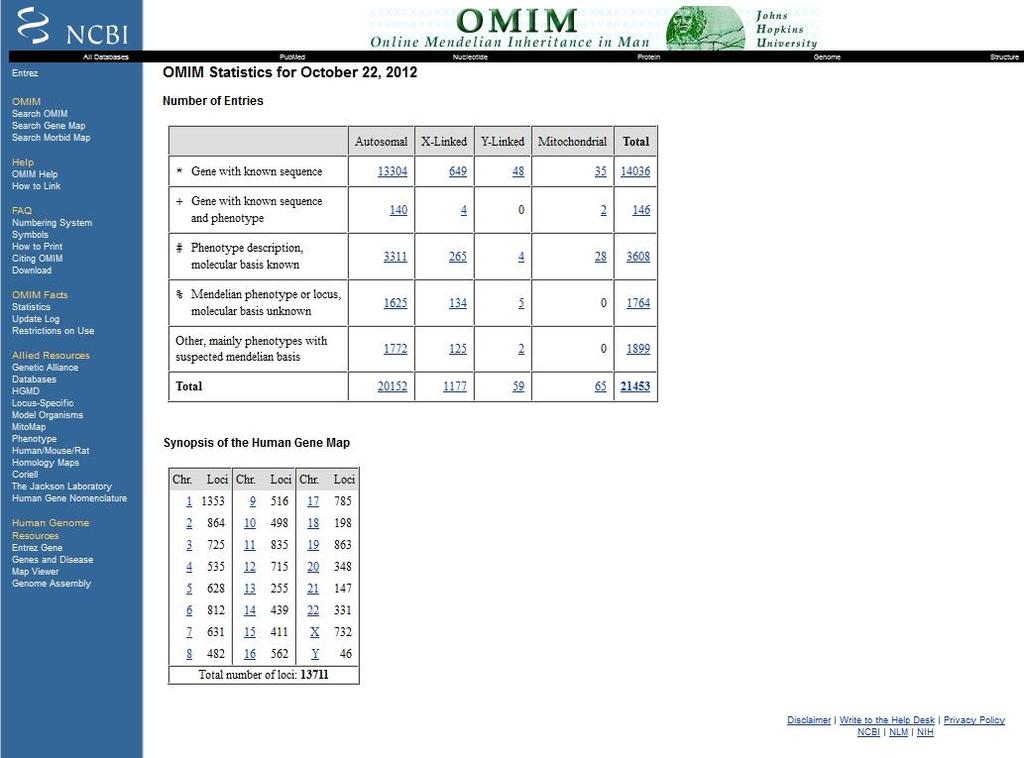
13 The pace of the molecular dissection of human disease can be measured by looking at the catalog of human genes and genetic disorders identified so far in OMIM, which is updated daily ( (V. A. McKusick, Mendelian Inheritance in Man (Johns Hopkins Univ. Press, Baltimore, ed. 12, 1998))
14
15 What is OMIM? Online Mendelian Inheritance in Man (OMIM ) is a continuously updated catalog of human genes and genetic disorders and traits, with particular focus on the molecular relationship between genetic variation and phenotypic expression. It is thus considered to be a phenotypic companion to the Human Genome Project. OMIM is a continuation of Dr. Victor A. McKusick's Mendelian Inheritance in Man, which was published through 12 editions, the last in OMIM is currently biocurated at the McKusick-Nathans Institute of Genetic Medicine, The Johns Hopkins University School of Medicine. Frequently asked questions:
16
17
18
19

20 1.b Genetic terminology revisited What is genetic epidemiology? (Ziegler and Van Steen, Brazil 2010)
21 Where is the genetic information located? (Ziegler and Van Steen, Brazil 2010)
22 Where is the genetic information located? (Ziegler and Van Steen, Brazil 2010)
23 Where is the genetic information located? (Ziegler and Van Steen, Brazil 2010)

24 What is recombination? (Ziegler and Van Steen, Brazil 2010)
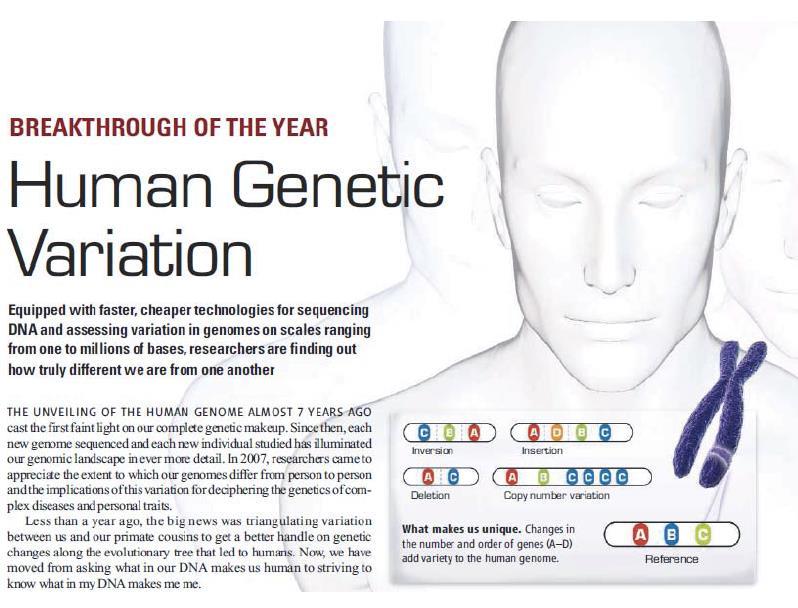
25 How much do individuals differ with respect to genetic information? (Ziegler and Van Steen, Brazil 2010)
26 How much do individuals differ with respect to genetic information? Genotype: The two alleles inherited at a specific locus. If the alleles are the same, the genotype is homozygous, if different, heterozygous. In genetic association studies, genotypes can be used for analysis as well as alleles or haplotypes. Haplotype: Linear arrangements of alleles on the same chromosome that have been inherited as a unit. A person has two haplotypes for any such series of loci, one inherited maternally and the other paternally. A haplotype may be characterized by a single allele unless a discrete chromosomal segment flanked by two alleles is meant.
27 Are haplotypes always better in association studies for disease? Analyses based on phased haplotype data rather than unphased genotypes may be quite powerful Test 1 vs. 2 for M1: Test 1 vs. 2 for M2: Test haplotype H1 vs. all others: D + d vs. d D + d vs. d D vs. d If the Disease Susceptibility Locus (DSL) is located at a marker, haplotype testing can be less powerful
28 How can individual differences be detected? (Ziegler and Van Steen, Brazil 2010)
29 What are microsatellite markers? (Ziegler and Van Steen, Brazil 2010)
30 What are single nucleotide polymorphisms? (Ziegler and Van Steen, Brazil 2010)
31 Why are SNPs preferred over STRs? (Ziegler and Van Steen, Brazil 2010)

32 Which genotyping methods are currently being used? (Ziegler and Van Steen, Brazil 2010)

33 Which genotyping methods are currently being used? (Ziegler and Van Steen, Brazil 2010)
34 1.c Genetic association studies What is a genome-wide association study? It refers to a method / methodology for interrogating all 10 million variable points across the human genome. Since variation is inherited in groups, or blocks, not all 10 million points have to be tested. Blocks are shorter though (so need for testing more points) the less closely people are related.
35
36
37 What is a genome-wide association study? Hence, a genome-wide association study is an approach that involves rapidly scanning markers across the complete sets of DNA, or genomes, of many people to find genetic variations associated with a particular disease. Once new genetic associations are identified, researchers can use the information to develop better strategies to detect, treat and prevent the disease. ( The impact on medical care from genome-wide association studies could potentially be substantial. Such research is laying the groundwork for the era of personalized medicine, in which the current one size-fits-all approach to medical care will give way to more customized strategies.
38 What do we need to carry out a genome-wide association study? The tools include - computerized databases that contain the reference human genome sequence, - a map of human genetic variation and - a set of new technologies that can quickly and accurately analyze whole-genome samples for genetic variations that contribute to the onset of a disease. (

39 What do we need to carry out a genome-wide association study?
40 What do we need to carry out a genome-wide association study? To distinguish between true and chance effects, there are several routes to be taken: - Set tight standards for statistical significance - Only consider patterns of polymorphisms that could plausibly have been generated by causal genetic variants (use understanding of and insights into human genetic history or evolutionary processes such as recombination or mutation) - Adequately deal with distorting factors, including missing data and genotyping errors (quality control measures)
 based on a case control design in which single-nucleotide polymorphisms (SNPs) across the human genome are genotyped.")
41 What is the flow of a genome-wide association study? The genome-wide association study is typically (but not solely!!!) based on a case control design in which single-nucleotide polymorphisms (SNPs) across the human genome are genotyped... (Panel A: small fragment)

42 What is the flow of a genome-wide association study? Panel B, the strength of association between each SNP and disease is calculated on the basis of the prevalence of each SNP in cases and controls. In this example, SNPs 1 and 2 on chromosome 9 are associated with disease, with P values of and 10 8, respectively (Manolio 2010)
43 What is the flow of a genome-wide association study? The plot in Panel C shows the P values for all genotyped SNPs that have survived a quality-control screen, with each chromosome shown in a different color. The results implicate a locus on chromosome 9, marked by SNPs 1 and 2, which are adjacent to each other (graph at right), and other neighboring SNPs. (Manolio 2010)
44 What is the flow of a genome-wide association study? (Ziegler 2009)
45 2 Study Designs What are the components of a study design for GWA studies? The design of a genetic association study may refer to - study scale: Genome-wide Genomic - marker design: Which markers are most informative? Microsatellites? SNPs? CNVs? Which platform is the most promising? - subject design

46 Does scale matter? candidate gene approach Can t see the forest for the trees vs genome-wide screening approach Can t see the trees for the forest

47 Does scale matter?
48 Which genetic markers to select? The Common Disease/Common Variant hypothesis (CDCV) Continuous distribution of genetic variants, shaped by mutation and selection (Ziegler and Van Steen, 2010)
49 Dichotomous Traits Quantitative Traits Observations: The higher the MAF (minor allele frequency), the higher the detection rate? The higher the MAF, the lower the penetrance?
50 Types of genetic diseases Monogenic diseases are those in which defects in a single gene produce disease. Often these disease are severe and appear early in life, e.g., cystic fibrosis. For the population as a whole, they are relatively rare. In a sense, these are pure genetic diseases: They do not require any environmental factors to elicit them. Although nutrition is not involved in the causation of monogenic diseases, these diseases can have implications for nutrition. They reveal the effects of particular proteins or enzymes that also are influenced by nutritional factors (
51 Oligogenic diseases are conditions produced by the combination of two, three, or four defective genes. Often a defect in one gene is not enough to elicit a full-blown disease; but when it occurs in the presence of other moderate defects, a disease becomes clinically manifest. It is the expectation of human geneticists that many chronic diseases can be explained by the combination of defects in a few (major) genes. A third category of genetic disorder is polygenic disease. According to the polygenic hypothesis, many mild defects in genes conspire to produce some chronic diseases. To date the full genetic basis of polygenic diseases has not been worked out; multiple interacting defects are highly complex!!! (
52 Complex diseases refer to conditions caused by many contributing factors. Such a disease is also called a multifactorial disease. - Some disorders, such as sickle cell anemia and cystic fibrosis, are caused by mutations in a single gene. - Common medical problems such as heart disease, diabetes, and obesity likely associated with the effects of multiple genes in combination with lifestyle and environmental factors, all of them possibly interacting. Challenge for many years to come
53 (Glazier et al 2002)
54 Which genetic markers to select? Linkage exists over a very broad region, entire chromosome can be done using data on only DNA markers Broad linkage regions imply studies must be followed up with more DNA markers in the region (Figure: courtesy of Ed Silverman) Must have family data with more than one affected subject E.g., microsatellites
 see later in this chapter")
55 Which genetic markers to select? Association exists over a narrow region; markers must be close to disease gene - The basic concept is linkage disequilibrium (LD) see later in this chapter Initially used for candidate genes or in linked regions Can use population-based (unrelated cases) or familybased design E.g., SNPs

56 Which DNA SNPs to select? Costs may play a role, but a balance is needed between costs and chip performance as well as coverage (e.g., exonic regions only?) Some of the fundamental principles of array technology (see future class)
57 Which DNA SNPs to select? (adapted from Manolio 2010)
58 How can technology bias be avoided? (Ziegler and Van Steen, Brazil 2010)
59 How can technology bias be avoided? (Ziegler and Van Steen, Brazil 2010)
60 How can technology bias be avoided? (Ziegler and Van Steen, Brazil 2010)
61 Next generation sequencing will overtake array technology? The competing hypothesis to the CDCV hypothesis is the Common Disease/Rare Variant (CDRV) hypothesis. It argues that multiple rare DNA sequence variations, each with relatively high penetrance, are the major contributors to genetic susceptibility to common diseases. Although some common variants that underlie complex diseases have been identified, and given the recent huge financial and scientific investment in GWA studies, there is no longer a great deal of evidence in support of the CDCV hypothesis and much of it is equivocal... Hence, nowadays, both CDCV and CDRV hypotheses have their place in current research efforts.

62 Next generation sequencing will overtake array technology?

63 Next generation sequencing will overtake array technology?
64 Crucial question: How to best capture disease predisposition? (Gut 2012)

65 Which study subjects to select? (Cordell and Clayton 2005)
66 Which study subjects to select? (Ziegler and Van Steen, 2010)
67 Which study subjects to select? (Ziegler and Van Steen, 2010)
68 Which study subjects to select? (Ziegler and Van Steen, 2010)
69 Which study subjects to select? (Ziegler and Van Steen, 2010)

70 Which study subjects to select?

71 Which study subjects to select? Rare versus common diseases (Lange and Laird 2006)

72 3 Preliminary analyses Is there a standard file format for GWA studies?

73 Is there a standard file format for GWA studies?
: (Ziegler and Van Steen 2010)")
74 3.a Quality control Why is quality control important? BEFORE (false positives!!!!): (Ziegler and Van Steen 2010)

75 Why is quality control important? AFTER: (Ziegler and Van Steen 2010)
76 What is the standard quality control? Quality control on different levels: o Subject or sample level o SNP level o X-chromosomal SNP level
77 What are standard filters on the sample level? (Ziegler and Van Steen 2010)
78 What are standard filters on the SNP level? (Ziegler and Van Steen 2010)
79 What is Hardy-Weinberg Equilibrium (HWE)? q (Ziegler and Van Steen 2010)

80 What are the assumptions of HWE?

81 What are signs of deviations from HWE? Decreased or increased HET
82 What are signs of deviations from HWE? F IT is the inbreeding coefficient of an individual (I) relative to the total (T) population, as above; F IS is the inbreeding coefficient of an individual (I) relative to the subpopulation (S), using the above for subpopulations and averaging them; and F ST is the effect of subpopulations (S) compared to the total population (T)
83 What are signs of deviations from HWE? Increased HOM (e.g., in case of population stratification; Wahlund effect)
84 How can HWE be measured?
85 How can HWE be measured? The Pearson test is easy to compute, but the χ2 approximation can be poor when there are low genotype counts, in which case it is better to use a Fisher exact test, which does not rely on the χ2 approximation. Discard loci that, for example, deviate from HWE among controls at significance level α = 10 3 or But be flexible! The open-source data-analysis software R includes the SNPassoc package that implements an exact SNP test of Hardy-Weinberg Equilibrium ( Expectations computed under the null of HWE Nr of degrees of freedom is 1 (p+q=1)
86 How can HWE be measured? A useful tool for interpreting the results of HWE and other tests on many SNPs is the log quantile quantile (QQ) p-value plot: - the negative logarithm of the i-th smallest p-value is plotted against log (i / (L + 1)), where L is the number of SNPs. The 0.3 (or 30%) quantile is the point at which 30% percent of the data fall below and 70% fall above that value. A 45-degree reference line is also plotted as visualization tool: - If the two sets come from a population with the same distribution, the points should fall approximately along this reference line. - The greater the departure from this reference line, the greater the evidence for the conclusion that the two data sets have come from populations with different distributions.

87 How can HWE be measured? (Balding 2006)

88 Why is cluster plot reading important?

89 What are standard filters on the gender level? (Ziegler and Van Steen 2010)

90 Is there a power advantage in imputing?

91 Is there a power advantage in imputing?

92 Is there a power advantage in imputing?
93 Is there a power advantage in imputing? (Spencer et al 2009)

94 What are the Travemünde criteria? (Ziegler 2009)

95 What are the Travemünde criteria? (Ziegler 2009)

96 3.b Linkage disequilibrium, haplotypes and SNP tagging Mapping the relationships among SNPs (Christensen and Murray 2007)

97 Relationships among SNPs induce multiple signals (Samani et al 2007)) These plots can be generated using the free software Haploview, but also in R!
98 Distances among cities Boston New York Providence Philadelphia Baltimore Providence 59 New York Philadelphia Baltimore Washington
99 Distances among cities
100 Distances among SNPs If a causal polymorphism is not genotyped, we can still hope to detect its effects through Linkage Disequilibrium (LD) with polymorphisms that are typed (key principle behind doing genetic association analysis ). LD is a measure of co-segregation of alleles in a population: Two alleles at different loci that occur together on the same chromosome (or gamete) more often than would be predicted by random chance. In general, LD is taken to be a measure of allelic association. Among the measures that have been proposed for two-locus haplotype data, the two most important are D (Lewontin s D prime) and r 2 (the square correlation coefficient between the two loci under study). Sample size must be increased by a factor of 1/r 2 to detect an unmeasured variant, compared with the sample size for testing the variant itself. (Jorgenson and Witte 2006)
101 Distances among SNPs The measure D is defined as the difference between the observed and expected (under the null hypothesis of independence) proportion of haplotypes bearing specific alleles at two loci: p AB - p A p B A a B p AB p ab b p Ab p ab - D is the absolute ratio of D compared with its maximum value. - D =1 : complete LD R 2 is the statistical correlation of two markers : - When R 2 =1, knowing the genotypes of alleles of one SNP is directly predictive of genotype of another SNP R 2 2 D P( A) P( a) P( B) P( b)
102 How far does linkage disequilibrium extend? (Hecker et al 2003)
103 How to interpret LD data? The patterns of LD observed in natural populations are the result of a complex interplay between genetic factors and the population's demographic history (Pritchard, 2001). LD is usually a function of distance between the two loci. This is mainly because recombination acts to break down LD in successive generations (Hill, 1966). When a mutation first occurs it is in complete LD with the nearest marker (D' = 1.0). Given enough time and as a function of the distance between the mutation and the marker, LD tends to decay and in complete equilibrium reached D' = 0 value. Thus, it decreases at every generation of random mating unless some process is opposing to the approach to linkage 'equilibrium'.
 genetic")
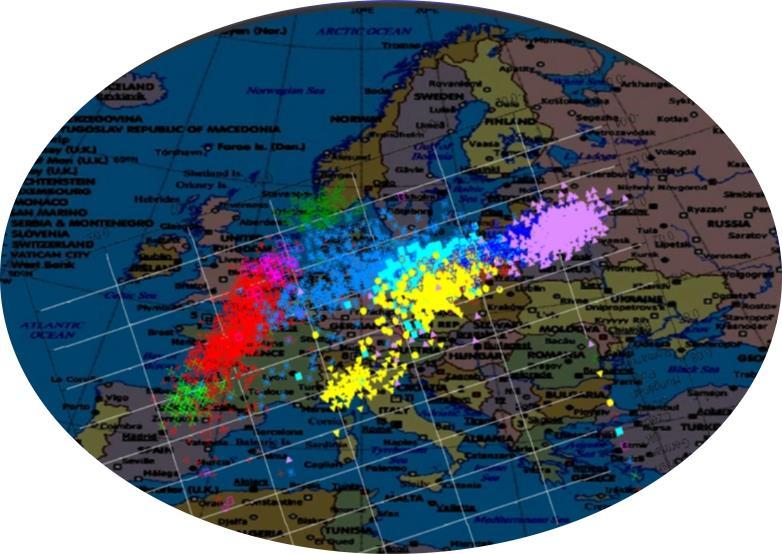
104 How to interpret LD data? Therefore, the key concept in a (population-based) genetic association study is linkage disequilibrium.

105 How to interpret LD data? It gives the rational for performing genetic association studies Phenotype: The visible or measurable (expressed) characteristic of an organism Trait: Coded phenotype
106 How can one tag SNP serve as proxy for many? (adapted from Manolio 2010)

107 How can one tag SNP serve as proxy for many? (adapted from Manolio 2010)

108 Where is the true causal variant? (Duerr et al 2006)

109 3.c Confounding What is spurious association? Spurious association refers to false positive association results due to not having accounted for population substructure as a confounding factor in the analysis
110 What is spurious association? Typically, there are two characteristics present: - A difference in proportion of individual from two (or more) subpopulation in case and controls - Subpopulations have different allele frequencies at the locus.
111 What are typical methods to deal with population stratification? Methods to deal with spurious associations generated by population structure generally require a number (at least >100) of widely spaced null SNPs that have been genotyped in cases and controls in addition to the candidate SNPs. These methods large group into: o Genomic control methods o Structured association methdos o Principal component-based methods
112 What is genomic control? In Genomic Control (GC), a 1-df association test statistic is computed at each of the null SNPs, and a parameter λ is calculated as the empirical median divided by its expectation under the chi-squared 1-df distribution. Then the association test is applied at the candidate SNPs, and if λ > 1 the test statistics are divided by λ.
113 What is genomic control? The motivation for GC is that, as we expect few if any of the null SNPs to be associated with the phenotype, a value of λ > 1 is likely to be due to the effect of population stratification, and dividing by λ cancels this effect for the candidate SNPs. GC performs well under many scenarios, but can be conservative in extreme settings (and anti-conservative if insufficient null SNPs are used). There is an analogous procedure for a general (2 df) test; The method can also be applied to other testing approaches.
114 What is a structured association method? Structured association (SA) approaches are based on the idea of attributing the genomes of study individuals to hypothetical subpopulations, and testing for association that is conditional on this subpopulation allocation. Several clustering algorithms exist to estimate the number of subpopulations. These approaches (such as Bayesian clustering approaches) are computationally demanding, and because the notion of subpopulation is a theoretical construct that only imperfectly reflects reality, the question of the correct number of subpopulations can never be fully resolved.
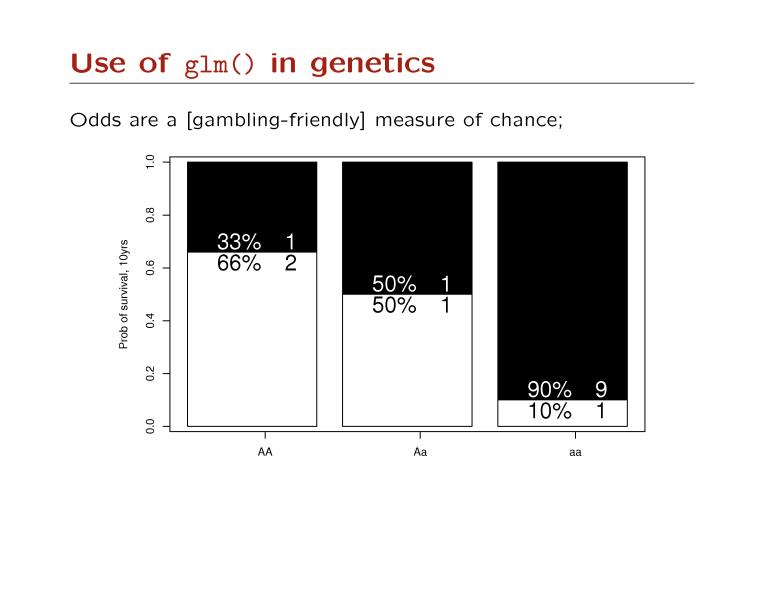
115 What is principal components analysis? When many null markers are available, principal components analysis provides a fast and effective way to diagnose population structure. Principal components are linear combinations of the original variables (here SNPs) that optimized in such a way that as much of the variation in the data is retained.
; X-axis: PC1 (26% of variance)")
116 In European data, the first 2 principal components nicely reflect the N-S and E-W axes! Y-axis: PC2 (6% of variance); X-axis: PC1 (26% of variance)
117
118 Does the same hold on a global (world) level? (Paschau 2007)
119 4 Tests of association What is the causal model underlying genetic association? (Ziegler and Van Steen 2010)
?")
120 4.a Single SNP What are common association tests (dichotomous traits)? (Ziegler and Van Steen 2010)
121 What are common association tests (dichotomous traits)? (Ziegler and Van Steen 2010)
")
122 What are common association tests (dichotomous traits)? Penetrances for simple Mendelian inheritance patterns Trait T: coded phenotype Penetrance: P(T Genotype) Complete penetrance: P(T DD) = 1 (simplified definition)
?")
123 What are common association tests (dichotomous traits)?
124 What are common association tests (dichotomous traits)? The Cochran-Armitage trend test measures a linear trend in proportions weighted by general measure of exposure dosage: variable x in regression model =#alleles Max test: computes maximum over standardized tests for different genetic models, providing a global test
125 Which test should be used in applications?

126 How are genetic effects measured? RR being
127 Which odds ratios (measures of effect) can we expect? (A and B) Histograms of susceptibility allele frequency and MAF, respectively, at confirmed susceptibility loci.. (Iles 2008)
128 Which odds ratios (measures of effect) can we expect? (C) Histogram of estimated ORs (estimate of genetic effect size) at confirmed susceptibility loci. (Iles 2008)
129 4.b Repeated single SNP tests The regression framework Regression analysis is used for explaining or modeling the relationship between a single variable Y, called the response, output or dependent variable, and one or more predictor, input, independent or explanatory variables, X 1,, X m. When m=1 it is called simple regression but when m > 1 it is called multiple regression or sometimes multivariate regression. When there is more than one Y, then it is called multivariate multiple regression The basic syntax for doing regression in R is lm(y~model) to fit linear models and glm() to fit generalized linear models (e.g. logistic regression models in the dichotomous trait setting before). Next slide: syntax!
130
131
132
133
134
135
136
137
138
139 Can screening for 1000nds of SNPs be performed automatically in R? GenAbel is designed for the efficient storage and handling of GWAS data with fast analysis tools for quality control, association with binary and quantitative traits, as well as tools for visualizing results. pbatr provides a GUI to the powerful PBAT software which performs family and population based family and population based studies. The software has been implemented to take advantage of parallel processing, which vastly reduces the computational time required for GWAS. SNPassoc provides another package for carrying out GWAS analysis. It offers descriptive statistics of the data (including patterns of missing data!) and tests for Hardy-Weinberg equilibrium. Single-point analyses with binary or quantitative traits are implemented via generalized linear models, and multiple SNPs can be analyzed for haplotypic associations or epistasis.

140 Is there one tool that fits it all? NO (
141 Other analytic methods Recursive Partitioning (CART; Breiman 1984, Foulkes 2005) Random Forests (Pavolov 1997) Combinatorial Partitioning (Nelson 2001) Multifactor-Dimensionality Reduction (Ritchie 2001) Permutation-Based Procedures (Trimming/Weighting; Hoh 2000) Multivariate Adaptive Regression Splines (Friedman 1991) Boosting (Schapire 1990) Support Vector Machines (Vapnik 2000) Neural Networks (Friedman & Tukey 1974, Friedman & Stuetzle 1981) Bayesian Pathway Modeling (Conti 2003, Cortessis & Thomas 2004) Clique-Finding (Mushlin 2006)
142 What is a multiple testing correction? Simultaneously test m null hypotheses, one for each SNP j H 0j : no association between SNP j and the trait Every statistical test comes with an inherent false positive, or type I error rate which is equal to the threshold set for statistical significance, generally However, this is just the error rate for one test. When more than one test is run, the overall type I error rate is much greater than 5%.
143 What is a multiple testing correction? Suppose 100 statistical tests are run when (1) there are no real effects and (2) these tests are independent, then the probability that no false positives occur in 100 tests is = So the probability that at least one false positive occurs is =0.994 or 99.4% There is not a single measure to quantify false positives (Hochberg et al 1987). Several multiple testing corrections have been developed and curtailed to a genome-wide association context, when deemed necessary: Bonferroni (highly conservative) [divide each single SNPbased p-value by the nr of tests before comparing to the nominal sign level 0.05] vs permutation-based (highly computational demanding) [keep the LD structure, but swap the trait labels among the subjects]


144 4.c Replication May J. Hirschhorn and D. Altshuler J Clin Endo Metab Am J Hum Genet July Am J Hum Genet July PLoS Biol Sept Nat Genet July 2006
145 What does replication mean? Replicating the genotype-phenotype association is the gold standard for proving an association is genuine Most loci underlying complex diseases will not be of large effect. It is unlikely that a single study will unequivocally establish an association without the need for replication SNPs most likely to replicate: - Showing modest to strong statistical significance - Having common minor allele frequency - Exhibiting modest to strong genetic effect size Note: Multi-stage design analysis results should not be seen as evidence for replication...
146 Guidelines for replication studies Replication studies should be of sufficient size to demonstrate the effect Replication studies should conducted in independent datasets Replication should involve the same phenotype Replication should be conducted in a similar population The same SNP should be tested The replicated signal should be in the same direction Joint analysis should lead to a lower p-value than the original report Well-designed negative studies are valuable check the NHGRI Catalog of GWA studies

147 What does validation mean? (Igl et al. 2009)
148 5 Interpretation and follow-up What have GWA studies learnt us about functionality? (Manolio 2010) Missense Synonymous Intronic 5' UTR 3' UTR mirts 5' (2kb) 3' (0.5kb) Intergenic
149 What have GWA studies learnt us about functionality? (Rebbeck et al 2004)
150 Are there criteria for assessing the functional significance of a variant? Criterion Strong Support Moderate Support Neutral Information Evidence Against Nucleotide Sequence Variant disrupts a known functional motif missense change, disrupts putative functional motif - Nonfunctional change Evolutionary Conservation Strong conservation across species, multigene family Some conservation across species or multigene family Not known No conservation Population Genetics Strong deviations from expected frequencies Some deviations from expected frequencies Not known No deviations from expected frequencies Experimental Consistent evidence in human target tissue Some evidence No data available No functional effect Exposures Variant affects relevant metabolism in target tissue Variant affects metabolism No data available Variant does not affect metabolism Epidemiology Consistent and reproducible reports Reports without replication No data available No association
151 The more we find, the more we see, the more we come to learn. The more that we explore, the more we shall return. Sir Tim Rice, Aida, 2000
152 Main References: Ziegler A and Van Steen K 2010: IBS short course on Genome-Wide Association Studies Balding D A tutorial on statistical methods for population association studies. Nature Reviews Genetics, 7, Kruglyak L The road to genomewide association studies. Nature Reviews Genetics 9: 314- Wang et al Genome-wide association studies: theoretical and practical concerns. Nature Reviews Genetics 6: 109- Peltonen L and McKusick VA Dissecting human disease in the postgenomic era. Science 291, Li Three lectures on case-control genetic association analysis. Briefings in bioinformatics 9: Rebbeck et al Assessing the function of genetic variants in candidate gene association studies 5: 589- Robinson Common Disease, Multiple Rare (and Distant) Variants. PLoS Biology 8(1): e