Measuring gene expression
|
|
|
- Johnathan Gibson
- 5 years ago
- Views:
Transcription

1 Measuring gene expression Grundlagen der Bioinformatik SS2018
2 Agenda Organization Gene expression Background Technologies FISH Nanostring Microarrays RNA-seq How to detect technological biases Visualization Quality control Normalization 2
3 Shift date of next lecture & thursday s exercise Move next Thursday s lecture and excersise to Friday the 15th Lecture 9 a.m. Exercise 1 p.m. (11 a.m. - 1 p.m. = Friday s exercise) 3
4 Gene Expression - Background 4

5 Gene Expression - mrna mrna expression gene activity Protein ~ active form of genes mrna = messenger RiboNucleic Acid DNA->mRNA-> Protein 5

6 Video time 6

7 mrna structure RNA copy of DNA gene Modified copy -> not identical Has specific sequence of bases that determine proteine Has additional cap and end E.g. Poly-A tail Only parts are translated Aim: Detect mrna expression Simplified mrna structure Wikicommons 7
8 Technologies 8
9 Fluorescence In Situ Hybridization Fluorescence in situ hybridization = FISH Illuminate mrna Qualitative -> no count information Match sequence Low throughput wikicommons 9

10 FISHy impressions Ryan Jeffs Illumination of RNA via FISH Colors specific for mrna -> location detection Nucleus, skeleton & Cell-membrane 10
11 FISH method Here: shown for DNA 1. Cut DNA and paste anchor 2. Denature DNA 3. Hybridize 4. Attach antibody and shine wikicommons 11

12 FISH / NanoString Quantitative FISH-like -> counts available Separate capture Sequence matched Medium throughput >= 1 minute 22 seconds 12
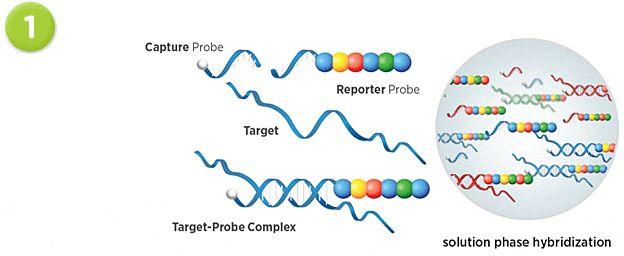
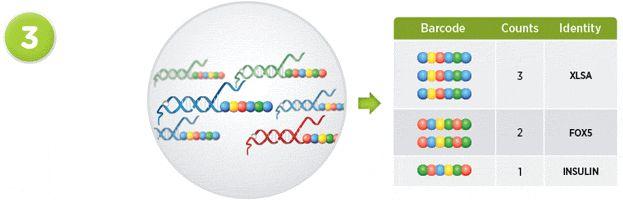
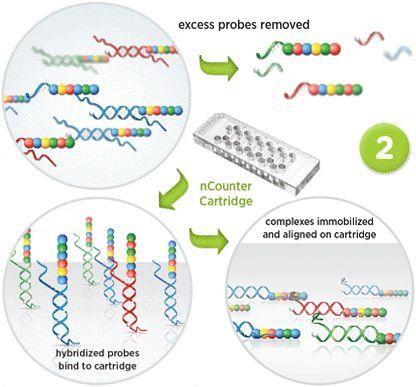
13 Nanostring 13

14 mrna Micro-Arrays Oligo-nucleotide arrays Array of pre-defined sequences Complementarily binding to mrna mrna illuminated Expression measured as light-intensity 14

15 Workflow mrna array 1. Isolation and purification 2. Reverse transcription a. cdna == complementary DNA 3. Labelling fluorescent dye cdna labeling 4. Hybridization a Washing Scanning a. Laser excitation b. detection of light intensities c. image segmentation Normalization wikicommons 15

16 Hybridization Binding of free mrna by pre-defined probe sequences Targets mrna sequences labeled Amount matches / mismatches determines illumination intensity wikicommons 16
17 Probe sequence selection Trade-off Sensitivity versus Specificity Sensitive sequence may not be specific E.g. cap or poly-a tail sequences Sensitivity := TP / (TP + FN) Specificity := TN / (TN + FP) Interesting optimization problem Probe-hybridization subject to plethora of factors Probe length GC content Secondary structure Amount matches over all transcripts Probe self or cross hybridisation Position of probe in the transcript Probe uniqueness Sensitivity vs. specificity 17
18 Two color array Expressed in sample 1 Expressed in sample 2 Expressed in samples 1 & 2 Not expressed in samples 1 & 2 18
19 Structural dye-bias two-color array Distortion of expression measurement Green channel consistently brighter than red channel Intensity-dependent 19
 doi:10.")
20 RNA-seq 1. mrna library preparation a. Shotgun-sequencing or b. cdna-sequencing 2. Amplification fragments (PCR) 3. Map reads to genome 4. Count reads per gene Wang et al., Nature Reviews Genetics volume10, pages57 63 (2009) doi: /nrg

21 Comparison Arrays vs. RNA-seq Arrays RNA-seq Cheap Expensive Standardized Non-standardized Well understood Still subject to active research Limited to know genes Detects all genes Limited detection range Dynamic range Non-specific hybridization Specific detection 21
22 Summary technologies Technology Type Price Amount genes Supervised* FISH Qualitative Low Small Yes mrna-array Qualitative/ Quantitative Low Large Yes NanoString Quantitative Medium Medium Yes RNA-seq Quantitative High Very large No *Supervised := Can only detect what we actively look for Unsupervised := Can detect novel mrna transcripts 22
23 Methods 23

24 mrna experiment design Samples Controls Two or more groups (called cohorts) Control Case Identify aggregated expression within cohorts Identify differences between aggregated expressions Ensure that measurements are comparable Cases Genes 24

25 Visualization - Boxplot Data overview Outlier identification Homogeneity-estimation 25
 vs NET (Tumor) Real-world heatmap 26")
26 Visualization - Correlation heatmap Pairwise-similarity of samples Clustering informative Bad: clustering based on study Good: clustering based on cancer-type NEC (Carcinoma) vs NET (Tumor) Real-world heatmap 26
 PC2 (second greatest effect)")
27 Principal component analysis (PCA) Two-dimensional similarity of samples Clustering Principal effects on data shown in PC1 (greatest effect) PC2 (second greatest effect) 27
28 Scatter plot Dot := one transcript in two experimental settings Points should appear around the horizontal line only a few genes are expressed at different levels Higher variation with low intensities 28
29 Mean-average (MA)-plot Visualization relationship mrna expression vs. Log2 expression difference Bias-correction two-color array Banana-shape indicates bias Shift signal to zero -> bias-correction Modified scatter plot 45 rotated Scaled 29
30 M & A calculation M := Log2 fold change (difference) FC( Value1 / Value2 ) := log2 (Value1 / Value2) FC(512 / 1024) := log2 (512/1024) = -1 A := logarithm of mean expression intensity A := 0.5 * (log2value1) + log(value2)) A := 0.5 * (log2 4) + log22) == 1.5 FC(123 / 123) := log2 (123/123) = 0 FC(512/ 256) := log2 (512/256) = 1 30
 technical and biological noise Correct undesired noise!")
31 Motivation normalization Interested in: true biological difference of mrna expression What we measure: Mixture of (unwanted) technical and biological noise Correct undesired noise! 31
32 Z-score normalization Correct for different amount of mrna per sample Z-score = scaling of counts 0 = average Examples: 2, -1, 0.1 Z = ( Xi - meanest ) / sdest Xi = expression gene i Meanest : (estimated) expr. average over all genes Sd : (estimated) expr. standard deviation of all genes 32
33 Quantile normalization Differences between the separate values 1. retained Identical distribution for each array Information lost Especially in the lower signals Matrix X a. Columns = samples b. Row = transcripts 2. Sort each column of X -> Xsort 3. Calculate row-means and store in X sort 4. Obtain Xn by rearranging columns of X'sort to have the same ordering as the corresponding input vector 33

34 Example quantile normalization 34


35 Example effect quantile normalization Important: normalization between samples, not within one sample 35